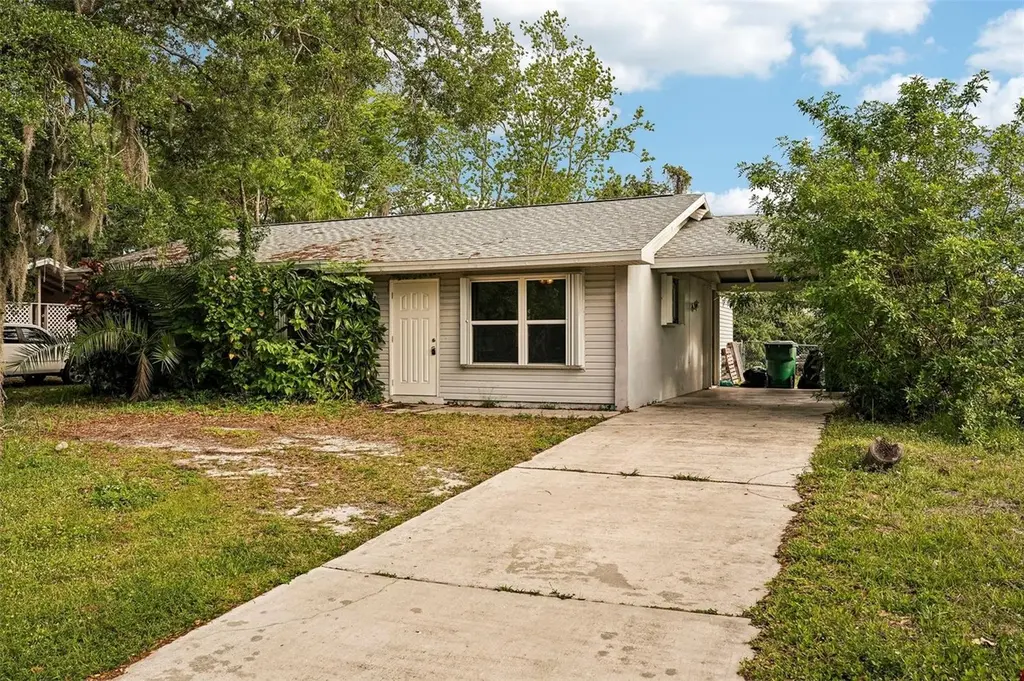
838 Cordele Ave NW · Port Charlotte, FL
Flood risk 9/10 · Severe
- FEMA flood zone
- AE
- Chance of flooding over 30 yrs
- 0.99%
- Est. flood insurance / yr
- $1,737 – $8,500
Fire risk 1/10 · Minimal
- Est. fire insurance / yr
- $947 – $1,759
Heat risk 10/10 · Severe
- Hot days now (above 107°F)
- 6 days/yr
- Hot days in 30 yrs
- 24 days/yr
Wind risk 10/10 · Severe
- Chance of severe wind over 30 yrs
- 99.0%
Air-quality risk 3/10 · Minor
- Unhealthy air days now
- 2 days/yr
- Unhealthy air days in 30 yrs
- 2 days/yr
Risk factors via First Street. Map © Google.
Why this score? — see what drove the B- grade
The composite is a weighted blend of 9 inputs, each scored 0–100. Each bar is that input's sub-score; the figure is the points it added to the 100-point composite (weight × sub-score).
- Cash flow +24.7/30.0
- ARV discount +14.8/15.0
- DSCR +8.0/10.0
- 1% rule +6.5/10.0
- Schools +4.6/10.0
- Livability +3.2/5.0
- Condition / age +2.5/5.0
- Rent growth +2.1/5.0
- Appreciation +0.0/10.0
$184,900
🖨 Deal sheet (PDF) 📄 Offer letter ✓ Due diligence
Listing remarks
Welcome to a premier investment opportunity at 838 Cordele Ave, located in the rapidly growing Port Charlotte market. This 3-bedroom, 2-bathroom residence offers approximately 1,150 sq. ft. of living space and is primed for a modern transformation. Ideal for investors, flippers, or savvy buyers looking to build instant equity, this property presents a significant value-add opportunity with solid bones and endless potential. The absence of an HOA provides maximum flexibility and fewer restrictions for your vision. Conveniently situated near local shopping and dining, this property is perfectly positioned to capitalize on a high-demand area. Opportunities in this price point move quickly&mdas
Key facts
- Maximum flexibility
- Absence of an hoa
- 0.23 acre lot
Tags
Property features AI
Finance
- Other: Property type: Residential, single family; Zoning: RSF3.5; Lot is level and within city limits; Lot dimensions approximately 80 x 125 (about 0.23 acres)
- Financial info: No lease restrictions
- HOA & community: No association; Pets allowed
Exterior
- Parking: Converted garage; Driveway; 1-car carport
- Utilities: Public water; Public sewer; Cable available; Electricity available
- Home design: Single family residence; One story; Faces south
- Construction: Block and vinyl siding construction; Shingle roof; Slab foundation; Built on one level
- Exterior features: Covered rear porch; Screened porch; Sliding doors
Interior
- Kitchen: Dishwasher; Range; Range hood; Refrigerator
- Bedrooms: 3 bedrooms
- Flooring: Carpet; Ceramic tile; Laminate
- Bathrooms: 2 full bathrooms
- Heating & cooling: Central heating; Central air conditioning
- Interior features: Ceiling fans; High ceilings; Open floorplan with living/dining combo; Solid surface counters; Solid wood cabinets
- Laundry & utility: Inside laundry room; Inside utility
Neighborhood map
What this means for you Summary
Snapshot
- This is a 3-bed/2.0-bath single-family listed at $185k.
Deal economics
- At list price, monthly cash flow is $-40 ($-476/yr) — negative.
- To cash-flow at today's rent, offer at most $178k (3.8% below list).
- Meets the 1% rule at list price ($2k rent vs $185k).
- Recommended offer: $178k (3.8% below list) — sets the bar for cash-flow.
- Cap rate 8.8% vs local median 4.2% in Port Charlotte — top-decile yield for the area; either an underpriced asset or a hidden risk that comps aren't pricing in. Stress-test before assuming the spread holds.
Location & tenants
- Location reads 65/100 on livability (#655 in FL) — a middle-class / working-renter tenant base. Strengths: cost of living A+, housing A+; Watch: employment D, amenities F, commute F.
- Charlotte (suburban): math 54% / reading 54% proficiency, ranked #22 of 73 in FL (top 30%) — acceptable for families but not a draw, mixed tenant base, ~2y average lease.
- Zoned schools: Meadow Park Elementary School (math 61% / reading 56%, grade B-, #735 of 2,144 statewide, top 35%, 701 students, 59% FRL); Murdock Middle School (math 50% / reading 45%, grade C-, #288 of 571 statewide, top 51%, 577 students, 56% FRL); Port Charlotte High School (math 23% / reading 38%, grade F, #434 of 667 statewide, top 66%, 1,649 students, 43% FRL) — zoned schools at 53% FRL track the district average.
- Market conditions: Rents soft (-1.6%/yr); 963 active listings in the ZIP; 37 comparable units currently listed for rent nearby; rentals at typical pace (median 23d on market — plan ~3-4 weeks tenant-placement turnaround); 4,585 units permitted in Charlotte County in 2024 (703 in 5+ unit buildings).
- This rent runs 41% of the median local income ($63k/yr) — at the standard rent-burdened threshold; future hikes will face affordability resistance.
Forward outlook
- Local home prices are declining (-3.0%/yr); year-one equity from $1k of loan paydown is wiped out by about $6k of value loss. Plan a longer hold.
- Charlotte County population projected at +24% by 2050 — long-run rental-demand tailwind backs the buy-and-hold thesis.
Negotiation context
- It's been on market 58 days — a 3% lower offer ($179k) is reasonable based on typical stale-listing flexibility.
- Current owner paid $110k; list at $185k implies a 68% gain — meaningful room to come down on a strong offer.
Risks & watch-outs
- Watch-outs: flood insurance adds $427/mo.
- Climate carrying-cost: in FEMA flood zone AE (mandatory federal flood insurance); severe wind risk, 99% chance of damaging wind over 30y; extreme-heat days projected 6→24/yr by 2055 (HVAC capex compounding) — expect insurance premiums to compound above CPI over the hold.
Questions for the listing agent
- What do current leases actually rent for vs. the listed asking? Can we see a recent rent roll and the last 12 months of T-12 income?
- It's been on market 58 days. Have you received any prior offers? Is the seller open to a 4% concession, seller financing, or rate buy-down credit?
- Built in 1973 — when were the roof, HVAC, electrical panel, plumbing, and water heater last replaced?
- What's the actual annual flood-insurance premium (NFIP or private), and is the property in a SFHA with mandatory coverage?
- Is there a deadline driving the sale (1031 exchange, divorce, estate, relocation)? That informs how much negotiation room exists.
- Schools are D-rated, which usually means shorter tenancies and higher turnover. Who's the typical renter profile here, and what's been the actual vacancy rate?
- What's the average days-on-market for RENTAL listings here right now (not sales)? A rising rental-DOM trend means longer vacancies and softer asking-rent achievability than the comps imply.
- What's the recent tenant-quality profile in this submarket — average credit score on applications, eviction rate, late-payment / NSF rate, and stable-employment percentage? A property-management company in the area should have these aggregated.
- How much new for-sale + rental construction is in the pipeline within 1–3 miles? Heavy new supply typically softens prices + rents 12–24 months out; constrained supply supports both.
Investment metrics
- 1% rule
- 1.15% ✓
- Cap rate
- 8.80%
- Cash-on-cash
- 8.97%
- DSCR
- 1.40
- GRM
- 7.2
CMA / ARV
- ARV (on-the-fly)
- $220,416
- Comps found
- 5
Show comp detail 5 sales within ~0.75 mi
| Address | Dist | Beds/Ba | Sqft | Sold | Price | $/sf | Match |
|---|---|---|---|---|---|---|---|
| 554 Lakemont Ave NW | 0.54mi | 2/2.0 (-1) | 1,204 (+5%) | 3mo | $160,000 | $133 | 59 |
| 915 Fairfax Ter NW | 0.64mi | 2/2.0 (-1) | 1,127 (-2%) | 4mo | $225,000 | $200 | 59 |
| 509 Beal St NW | 0.68mi | 2/2.0 (-1) | 1,169 (+2%) | 13mo | $225,000 | $192 | 49 |
| 741 Dobell Ter NW | 0.63mi | 3/2.0 | 1,168 (+2%) | 22mo | $270,800 | $232 | 49 |
| 4035 Mcintire St | 0.73mi | 3/2.0 | 1,200 (+4%) | 12mo | $155,000 | $129 | 48 |
Match score weights: distance 35% · size 25% · config 20% · recency 20%. Top-matched comps best support the ARV.
Projected returns pro-forma
-3.0% appreciation · 0.0% rent growth · sell at horizon
- IRR
- -22.3%
- Equity multiple
- 0.26×
- Total profit
- $-38,430
- Equity at exit
- $27,569
- IRR
- -32.3%
- Equity multiple
- -0.15×
- Total profit
- $-59,625
- Equity at exit
- $15,987
Cash invested: $51,772 (down + closing). Projections, not guarantees.
Landlord ↔ Tenant lean methodology
- Overall (STATE)
- 87 Strongly Landlord-Friendly
- State Florida
- 87 Strongly Landlord-Friendly · R+3
- County
- — inherits STATE
- City
- — inherits STATE
ZIP-level market 33948
- Home prices YoY
- -14.9%
- Rents YoY
- -1.6%
- Active inventory
- 963
- Price-to-rent
- 7.2×
Monthly cashflow live
- Estimated rent
- $2,133 high interval (Pro) →
- Mortgage (P&I)
- −$970
- Tax from tax record
- −$251 /mo · $3,017/yr
- Insurance
- −$77
- Flood insurance flood zone
- −$427 /mo · $5,118/yr
- HOA
- −$0
- Vacancy / Maint / Mgmt
- −$448
- Net cashflow
- $-40
Break-even live
Sensitivity live
| Price | -10% $65 | -5% $13 | +0% $-40 | +5% $-92 | +10% $-144 |
|---|---|---|---|---|---|
| Rent | -10% $-208 | -5% $-124 | +0% $-40 | +5% $45 | +10% $129 |
| Rate | -1.0pp $53 | -0.5pp $7 | base $-40 | +0.5pp $-88 | +1.0pp $-136 |
UW: 25.0% down · 7.5% · 30yr · 1.5% tax · 5.0% vac · 8.0% maint · 8.0% mgmt
Financing live
Cash to close
- Down payment
- $46,225
- Closing costs
- $5,547
- Reserves months
- —
- Total cash needed
- —
Loan-product check · same deal, 3 products live
Conventional
25% down · 7.5% · 30yr
- Down + closing
- —
- Monthly P&I
- —
- Monthly cashflow
- —
- DSCR
- —
- Eligible?
- —
Personal DTI + credit; lowest rate.
DSCR
20% down · 8.5% · 30yr
- Down + closing
- —
- Monthly P&I
- —
- Monthly cashflow
- —
- DSCR
- —
- Eligible?
- —
No personal income docs; deal must DSCR.
Hard money
10% down · 12.0% · 12mo
- Down + closing
- —
- Monthly P&I
- —
- Monthly cashflow
- —
- DSCR
- —
- Eligible?
- —
Short-term bridge; refi at stabilization.
Rent comps 37 comps
| Address | Beds | Baths | Sqft | Rent | $/sqft | DOM | Units | Dist |
|---|---|---|---|---|---|---|---|---|
| 525 Altoona St NW Port Charlotte, FL | 2.0 | 2.0 | 1002 | $1,750 | $1.75 | 23d | 1 | 0.21mi |
| 342 Millport St NW Port Charlotte, FL | 3.0 | 2.0 | 1331 | $2,250 | $1.69 | 23d | 1 | 0.22mi |
| 334 Millport St NW Port Charlotte, FL | 3.0 | 2.0 | 1459 | $2,400 | $1.64 | 23d | 1 | 0.23mi |
| 326 Millport St NW Port Charlotte, FL | 3.0 | 2.0 | 1459 | $2,400 | $1.64 | 23d | 1 | 0.24mi |
| 651 Chamber St NW Port Charlotte, FL | 3.0 | 2.0 | 1196 | $1,900 | $1.59 | 23d | 1 | 0.39mi |
| 979 Roseway Ter NW Port Charlotte, FL | 3.0 | 1.5 | 1140 | $1,525 | $1.34 | 23d | 1 | 0.54mi |
| 979 Roseway Ter NW Unit 979 Port Charlotte, FL | 2.0 | 2.0 | 1140 | $1,750 | $1.54 | 23d | 1 | 0.54mi |
| 1148 Salina Ave Port Charlotte, FL | 3.0 | 2.0 | 1449 | $3,000 | $2.07 | 23d | 1 | 0.56mi |
| 1174 Victoria Ave Port Charlotte, FL | 2.0 | 2.0 | 1092 | $1,650 | $1.51 | 23d | 1 | 0.62mi |
| 1225 Armsdale Ave Port Charlotte, FL | 3.0 | 2.0 | 1140 | $1,525 | $1.34 | 23d | 1 | 0.67mi |
| 533 Crandall St NW Port Charlotte, FL | 3.0 | 2.0 | 1328 | $1,550 | $1.17 | 23d | 1 | 0.69mi |
| 650 Hartford Dr NW Port Charlotte, FL | 2.0 | 2.0 | 1200 | $1,600 | $1.33 | 23d | 1 | 0.70mi |
| 401 Skylark Ln NW Port Charlotte, FL | 3.0 | 2.0 | 1167 | $1,650 | $1.41 | 23d | 1 | 0.90mi |
| 18522 Robinson Ave Port Charlotte, FL | 3.0 | 2.0 | 1252 | $2,000 | $1.60 | 23d | 1 | 1.01mi |
| 266 Rockwood St NW Port Charlotte, FL | 3.0 | 2.0 | 1400 | $1,850 | $1.32 | 15d | 1 | 1.08mi |
| 4123 Michel Tree St Port Charlotte, FL | 3.0 | 2.0 | 920 | $1,750 | $1.90 | 23d | 1 | 1.11mi |
| 4399 Mundella Cir Port Charlotte, FL | 3.0 | 2.0 | 1140 | $3,200 | $2.81 | 23d | 1 | 1.17mi |
| 249 Seminole Blvd NW Port Charlotte, FL | 3.0 | 2.0 | 1389 | $1,750 | $1.26 | 23d | 1 | 1.22mi |
| 18608 Alphonse Cir Port Charlotte, FL | 3.0 | 2.0 | 1441 | $4,000 | $2.78 | 23d | 1 | 1.25mi |
| 182 Chelsea Ct NW Port Charlotte, FL | 2.0 | 2.0 | 1389 | $2,200 | $1.58 | 23d | 1 | 1.26mi |
| 4342 Ewing Cir Port Charlotte, FL | 3.0 | 2.0 | 1260 | $2,500 | $1.98 | 23d | 1 | 1.27mi |
| 18625 Alphonse Cir Port Charlotte, FL | 2.0 | 2.0 | 960 | $4,000 | $4.17 | 23d | 1 | 1.28mi |
| 4518 Wynkoop Cir Port Charlotte, FL | 2.0 | 2.0 | 1409 | $1,995 | $1.42 | 15d | 1 | 1.32mi |
| 4112 Gingold St Port Charlotte, FL | 2.0 | 1.5 | 1056 | $3,300 | $3.12 | 23d | 1 | 1.34mi |
| 394 Ferris Dr NW Port Charlotte, FL | 3.0 | 2.0 | 842 | $1,395 | $1.66 | 23d | 1 | 1.35mi |
| 164 Tradewinds Dr NW Port Charlotte, FL | 2.0 | 1.0 | 750 | $1,350 | $1.80 | 23d | 1 | 1.35mi |
| 2472 Picnic St Port Charlotte, FL | 2.0 | 2.0 | 990 | $1,575 | $1.59 | 23d | 1 | 1.37mi |
| 18493 Lake Worth Blvd Port Charlotte, FL | 2.0 | 2.0 | 1006 | $1,500 | $1.49 | 23d | 1 | 1.39mi |
| 2586 Auburn Blvd Port Charlotte, FL | 2.0 | 2.0 | 1028 | $1,850 | $1.80 | 15d | 1 | 1.40mi |
| 2457 Haven St Port Charlotte, FL | 3.0 | 2.0 | 1150 | $1,775 | $1.54 | 23d | 1 | 1.40mi |
| 20550 Edgewater Dr Port Charlotte, FL | 3.0 | 2.0 | 1176 | $1,900 | $1.62 | 23d | 1 | 1.41mi |
| 1261 Joplin Ave NW Port Charlotte, FL | 2.0 | 2.0 | 1200 | $1,950 | $1.62 | 23d | 1 | 1.47mi |
| 4192 Gingold St Port Charlotte, FL | 3.0 | 2.0 | 1127 | $4,200 | $3.73 | 23d | 1 | 1.47mi |
| 2000 Forrest Nelson Blvd Unit B6 Port Charlotte, FL | 2.0 | 2.5 | 1218 | $1,400 | $1.15 | 23d | 1 | 1.47mi |
| 2223 Tinker St Port Charlotte, FL | 3.0 | 2.0 | 1337 | $2,400 | $1.80 | 23d | 1 | 1.49mi |
| 2395 Alda Ln Port Charlotte, FL | 2.0 | 2.0 | 1150 | $1,775 | $1.54 | 23d | 1 | 1.49mi |
| 18312 Driggers Ave Port Charlotte, FL | 3.0 | 2.0 | 1428 | $5,400 | $3.78 | 23d | 1 | 1.50mi |
Listing history 21 events
-
2026-06-22days on market $184,900 Active 58 DOM
-
2026-06-18days on market $184,900 Active 55 DOM
-
2026-06-17days on market $184,900 Active 54 DOM
-
2026-06-16days on market $184,900 Active 53 DOM
-
2026-06-15days on market $184,900 Active 52 DOM
-
2026-06-14days on market $184,900 Active 50 DOM
-
2026-06-13days on market $184,900 Active 49 DOM
-
2026-06-10days on market $184,900 Active 47 DOM
-
2026-06-09pricedays on market $184,900 Active 46 DOM
-
2026-06-08days on market $194,900 Active 45 DOM
-
2026-06-07days on market $194,900 Active 44 DOM
-
2026-06-05days on market $194,900 Active 41 DOM
-
2026-06-03days on market $194,900 Active 40 DOM
-
2026-06-02days on market $194,900 Active 39 DOM
-
2026-06-01days on market $194,900 Active 38 DOM
-
2026-05-31days on market $194,900 Active 37 DOM
-
2026-05-30days on market $194,900 Active 36 DOM
-
2026-04-24$199,990 Active
-
2004-03-24soldstatus $110,000
-
1994-06-29soldstatus $50,000
-
1994-06-29soldstatus $50,000
ⓘ Source: listings_history table (triggers on properties + properties_extension) + one-shot
backfill from property_details.listing_events for pre-trigger history.
Tax reassessment forecast FL · Resets to sale price
- Current annual tax
- $3,017 · $251/mo
- Projected year-2 tax
- $3,017 · $251/mo
- Expected delta
- $0/yr ($0/mo · 0.0%)
ⓘ Screening estimate from a state-policy table — verify with the county assessor before closing.
Climate risk First Street
- Flood 9/10 Extreme FEMA zone AE · 99% chance over 30 yrs
- Wildfire 1/10 Low
- Heat 10/10 Extreme 6 d/yr ≥107°F today · 24 d/yr by 30 yrs out
- Wind 10/10 Extreme 99% chance of damaging wind over 30 yrs
- Air quality 3/10 Moderate 2 unhealthy d/yr today · 2 by 30 yrs out
Nearby sold comps map
Loading sold comps map…
Walkable amenities ~0.75 mi
Loading nearby amenities…
Taxation est. · year 1
- Rental income
- $25,595
- − Mortgage interest
- −$10,357
- − Property taxes
- −$3,017
- − Insurance
- −$6,043
- − Repairs & maintenance
- −$2,048
- − Management
- −$2,048
- − Depreciation
- −$5,379
- Taxable loss
- −$3,296
- Est. tax savings @ 24.0%
- +$791
- After-tax cash flow
- $316/yr
For passive investors: Depreciation is non-cash, so a rental often shows a tax loss while cash-flowing — sheltering income. Rental losses are passive: they offset passive income freely, and up to $25,000/yr can offset ordinary (W-2) income if you actively participate and your MAGI is under $100k (phasing out to $0 by $150k); unused losses carry forward. On sale, claimed depreciation is recaptured at up to 25%, and gains may owe capital-gains tax (a 1031 exchange can defer both). Figures are a year-1 estimate at your 24.0% rate — not tax advice; consult a CPA.
Schools (NCES district)
- District
- Charlotte
- NCES district ID
- 1200240
- Math proficiency
- 54% ▼ -6.00%
- Reading proficiency
- 54% ▼ -1.00%
- Median HH income
- $44,864
- Composite
- 45.62/100
- National rank
- #2586
- State rank
- #22 of 73 in FL
Livability — Port Charlotte
- Score
- 65/100
- State rank
- #655
- US rank
- #13081
Category grades
Schools grade is shown separately in the Schools card above.
Census & demographics
- Census place
- Port Charlotte, FL
- County
- Charlotte County · 196,994 people
- City population
- 102,180
- Metro
- Punta Gorda, FL
- Population (ZIP)
- 18,696
- Household income
- $62,744
- Rent vs Own
- Severe rent burden
- 501.0
Population outlook (Charlotte County) Hauer SSP2
- Today (2025)
- 198,646 people
- By 2030
- 210,507 · +6.0%
- By 2040
- 230,857 · +16.2%
- By 2050
- 247,148 · +24.4%
- By 2075
- 281,777 · +41.8%
- By 2100
- 293,609 · +47.8%
Race, ethnicity, and origin ACS 2023
- Neighborhood character
- Predominantly White (79%)
- Race & ethnicity
- White 79% Two or more races 8% Black 7% Hispanic / Latino 7% Asian 2%
- Hispanic origin (detail)
- Mexican 2% Puerto Rican 1%
- Common ancestry
- Lithuanian 5% Romanian 4% Iranian 2%
- Foreign-born
- 11% · Canada
- Languages at home
- 88% English-only · Spanish 5% Russian/Polish/Slavic 2% Other Indo-European 1%
Political lean MEDSL · Charlotte
- 2024 margin
- Solid R (+34.0) · D 32.7% · R 66.7%
- 2008→2024 swing
- -26.7pp toward R · 2008: -7.2pp · 2024: -34.0pp
- All cycles
- 2024: R+34.0 2020: R+26.6 2016: R+27.8 2012: R+14.3 2008: R+7.2
Not yet ingested
- Civics
- —
Market trends
- HPI YoY
- ▼ -55.31%
- Current HPI
- 315.0548
- Rent YoY
- ▼ -1.63%
- Metro
- Punta Gorda, FL
- State GDP YoY
- ▲ 3.28%
- F500 in state
- 36
Industry mix (Fortune 500 HQ in FL)
| Industry | F500 HQs | Revenue |
|---|---|---|
| Industrial Technology | 2 | $29B |
|
||
| Insurance | 2 | $17B |
|
||
| Retail | 1 | $60B |
|
||
| Technology Distribution | 1 | $58B |
|
||
| Homebuilding | 1 | $35B |
|
||
| Technology Manufacturing | 1 | $35B |
|
||
Price history
+300.0% since first listed4 events — show timeline
- 2026-04-24 Listed $199,990 Stellar MLS as Distributed by MLS Grid
- 2004-03-24 Sold (Public Records) $110,000 Public Records
- 1994-06-29 Sold (Public Records) $50,000 Public Records
- 1994-06-29 Sold (Public Records) $50,000 Public Records
Property tax history
+8.0%/yrLatest (2025): $3,017 · +6.1% YoY. Source: county tax records.
Cash-flow waterfall
monthlySold comps — $/sqft
last 12 mo · ≤1 miLoading sold comps…