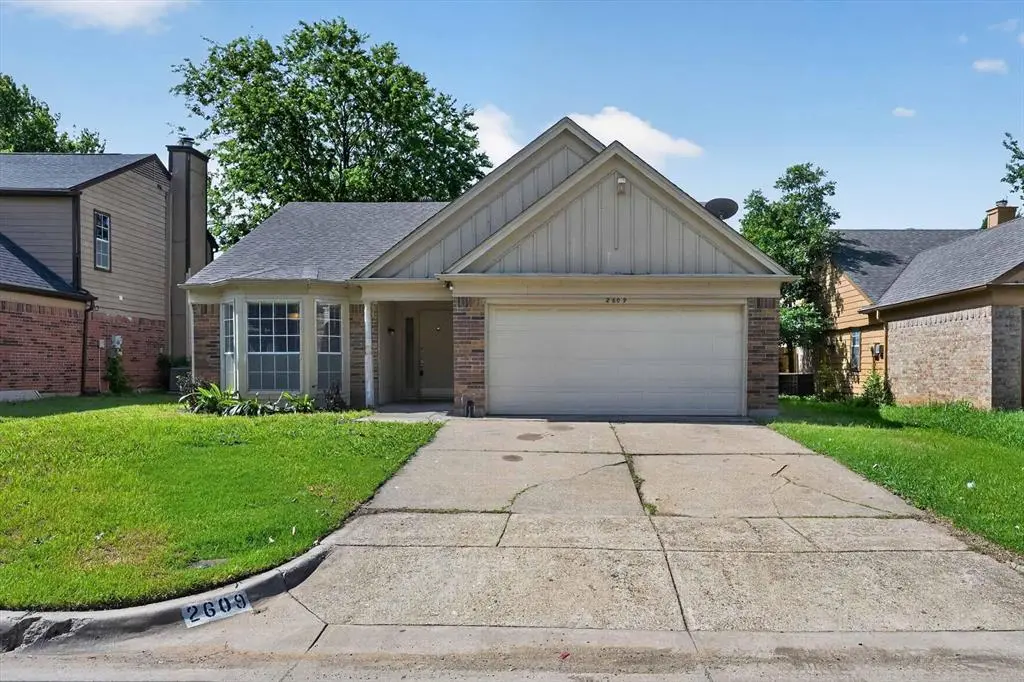
2609 Coldstream Dr · Fort Worth, TX
Flood risk 1/10 · Minimal
- FEMA flood zone
- X (unshaded)
- Chance of flooding over 30 yrs
- 0.0%
- Est. flood insurance / yr
- $507 – $1,088
Fire risk 4/10 · Minor
- Est. fire insurance / yr
- $1,222 – $2,270
Heat risk 7/10 · Major
- Hot days now (above 108°F)
- 7 days/yr
- Hot days in 30 yrs
- 23 days/yr
Wind risk 5/10 · Moderate
- Chance of severe wind over 30 yrs
- 26.0%
Air-quality risk 3/10 · Minor
- Unhealthy air days now
- 2 days/yr
- Unhealthy air days in 30 yrs
- 3 days/yr
Risk factors via First Street. Map © Google.
Why this score? — see what drove the D grade
The composite is a weighted blend of 9 inputs, each scored 0–100. Each bar is that input's sub-score; the figure is the points it added to the 100-point composite (weight × sub-score).
- ARV discount +13.7/15.0
- Cash flow +10.5/30.0
- Livability +4.0/5.0
- 1% rule +3.4/10.0
- DSCR +3.0/10.0
- Rent growth +2.8/5.0
- Schools +2.5/10.0
- Condition / age +2.5/5.0
- Appreciation +0.0/10.0
$245,000
🖨 Deal sheet (PDF) 📄 Offer letter ✓ Due diligence
Listing remarks MLS
Conveniently located close to shopping and parks! Cozy wood burning fireplace in large living area. Open floor plan is perfect for entertaining! Breakfast area in kitchen with lots of cabinet space. Walk in closet in master has built ins. 2nd Bedroom has built-in cabinets, great for an office space.
Key facts
- Open layout
- 5,837 sq ft lot
- 2 garage spots
Tags
Property features AI
Finance
- Financial info: Accepted financing: Cash, Conventional, FHA, VA
- HOA & community: No association
Exterior
- Parking: Concrete driveway; Garage; Attached 2-car garage
- Security: Other security features
- Utilities: City water; City sewer; Cable available
- Home design: Single-family residence; One-story
- Construction: Built in 1986
- Exterior features: Lot under 0.5 acre (about 0.134 acres); Curbs
Interior
- Kitchen: Dishwasher; Disposal; Microwave
- Bedrooms: 3 bedrooms (primary bedroom on main level)
- Bathrooms: 2 full bathrooms
- Heating & cooling: Central heating; Central air conditioning; 1 fireplace (other type)
- Interior features: Cable TV available; Other interior features
Neighborhood map
What this means for you Summary
Snapshot
- This is a 3-bed/2.0-bath single-family listed at $245k.
Deal economics
- At list price, monthly cash flow is $-126 ($-2k/yr) — negative.
- To cash-flow at today's rent, offer at most $223k (9.1% below list).
- To meet the 1% rule (rent ≥ 1% of price), the offer needs to be $207k (15.5% below list).
- Recommended offer: $207k (15.5% below list) — sets the bar for 1% rule.
- Cap rate 5.7% vs local median 3.9% in Fort Worth — top-decile yield for the area; either an underpriced asset or a hidden risk that comps aren't pricing in. Stress-test before assuming the spread holds.
Location & tenants
- Location reads 80/100 on livability (#49 in TX, #1,954 nationally) — a professional / high-income tenant draw. Strengths: amenities A+, cost of living A+, housing A+; Watch: crime F.
- Crowley ISD (urban): math 23% / reading 32% proficiency, ranked #643 of 826 in TX (top 78%) — low school quality limits family demand, transient renter base, plan for 1-2y turnover.
- Zoned schools: Meadowcreek El (math 21% / reading 23%, grade F, #3,333 of 4,322 statewide, top 80%, 534 students, 86% FRL); Crowley Middle (math 17% / reading 28%, grade F, #1,341 of 1,662 statewide, top 82%, 977 students, 86% FRL); North Crowley H S (math 20% / reading 35%, grade F, #1,183 of 1,632 statewide, top 73%, 2,920 students, 71% FRL) — zoned schools average 81% FRL vs 52% district-wide (29 pts higher); higher-poverty schools than district average — tighter screening recommended.
- Market conditions: Rents rising (+1.1%/yr); 367 active listings in the ZIP; 40 comparable units currently listed for rent nearby; rentals at typical pace (median 27d on market — plan ~3-4 weeks tenant-placement turnaround); solid renter incomes; 18,938 units permitted in Tarrant County in 2024 (8,336 in 5+ unit buildings).
Forward outlook
- Local home prices are declining (-3.0%/yr); year-one equity from $2k of loan paydown is wiped out by about $7k of value loss. Plan a longer hold.
- Tarrant County population projected at +41% by 2050 — long-run rental-demand tailwind backs the buy-and-hold thesis.
Negotiation context
- It's been on market 34 days — a 3% lower offer ($238k) is reasonable based on typical stale-listing flexibility.
- 5 sale attempts since 20y ago with the ask held roughly flat each time — persistent listings suggest the price (not the market) is what's stuck; bring a comps-based counter.
Risks & watch-outs
- Climate carrying-cost: moderate wind risk, 26% chance of damaging wind over 30y; extreme-heat days projected 7→23/yr by 2055 (HVAC capex compounding) — expect insurance premiums to compound above CPI over the hold.
Questions for the listing agent
- What do current leases actually rent for vs. the listed asking? Can we see a recent rent roll and the last 12 months of T-12 income?
- It's been on market 34 days. Have you received any prior offers? Is the seller open to a 16% concession, seller financing, or rate buy-down credit?
- Is there a deadline driving the sale (1031 exchange, divorce, estate, relocation)? That informs how much negotiation room exists.
- Schools are D-rated, which usually means shorter tenancies and higher turnover. Who's the typical renter profile here, and what's been the actual vacancy rate?
- Crime grade is F in this area — have there been break-ins, vandalism, or insurance claims at this property in the last 3 years? What carrier currently insures it and at what premium?
- The area grade is low — what's the realistic commute time and amenity access for the typical tenant pool here? Any planned neighborhood developments (good or bad) we should know about?
- What's the average days-on-market for RENTAL listings here right now (not sales)? A rising rental-DOM trend means longer vacancies and softer asking-rent achievability than the comps imply.
- What's the recent tenant-quality profile in this submarket — average credit score on applications, eviction rate, late-payment / NSF rate, and stable-employment percentage? A property-management company in the area should have these aggregated.
- How much new for-sale + rental construction is in the pipeline within 1–3 miles? Heavy new supply typically softens prices + rents 12–24 months out; constrained supply supports both.
Investment metrics
- 1% rule
- 0.84% ✗
- Cap rate
- 5.67%
- Cash-on-cash
- -2.21%
- DSCR
- 0.90
- GRM
- 9.9
CMA / ARV
- ARV (median comp)
- $284,251
- List price
- $245,000
- Delta
- -13.81%
- Verdict
- UNDERPRICED
- Comps
- 20 within 1.0 mi
Show comp detail 12 sales within ~0.75 mi
| Address | Dist | Beds/Ba | Sqft | Sold | Price | $/sf | Match |
|---|---|---|---|---|---|---|---|
| 2413 Dahlia Dr | 0.25mi | 3/2.0 | 1,516 (+5%) | 1mo | $309,990 | $204 | 80 |
| 2729 Clovermeadow Dr | 0.42mi | 3/2.0 | 1,422 (-2%) | 1mo | $229,900 | $162 | 76 |
| 7741 Galemeadow Ct | 0.39mi | 3/2.0 | 1,400 (-3%) | 1mo | $260,000 | $186 | 75 |
| 7660 Hollow Forest Dr | 0.40mi | 3/2.0 | 1,404 (-3%) | 2mo | $262,000 | $187 | 74 |
| 8120 Sycamore Brook Dr | 0.21mi | 3/2.0 | 1,600 (+10%) | 2mo | $285,000 | $178 | 71 |
| 2516 Dahlia Dr | 0.13mi | 3/2.5 | 1,632 (+13%) | 0mo | $252,000 | $154 | 70 |
| 3317 Fairmeadows Ln | 0.52mi | 3/2.0 | 1,520 (+5%) | 3mo | $265,000 | $174 | 66 |
| 2413 Hawkwood Ct | 0.63mi | 3/2.0 | 1,416 (-2%) | 2mo | $265,000 | $187 | 65 |
| 8509 Delta Way | 0.59mi | 4/2.0 (+1) | 1,357 (-6%) | 1mo | $240,000 | $177 | 56 |
| 2104 Shane Ave | 0.69mi | 3/2.0 | 1,597 (+10%) | 2mo | $299,000 | $187 | 49 |
| 8505 Tallahassee Ln | 0.65mi | 3/2.0 | 1,281 (-12%) | 2mo | $225,000 | $176 | 49 |
| 8524 Gatlinburg Dr | 0.74mi | 3/2.5 | 1,633 (+13%) | 1mo | $259,900 | $159 | 42 |
Match score weights: distance 35% · size 25% · config 20% · recency 20%. Top-matched comps best support the ARV.
Projected returns pro-forma
-3.0% appreciation · 1.07% rent growth · sell at horizon
- IRR
- -22.2%
- Equity multiple
- 0.25×
- Total profit
- $-51,610
- Equity at exit
- $36,530
- IRR
- -22.0%
- Equity multiple
- -0.03×
- Total profit
- $-70,561
- Equity at exit
- $21,183
Cash invested: $68,600 (down + closing). Projections, not guarantees.
Landlord ↔ Tenant lean methodology
- Overall (STATE)
- 87 Strongly Landlord-Friendly
- State Texas
- 87 Strongly Landlord-Friendly · R+5
- County
- — inherits STATE
- City
- — inherits STATE
ZIP-level market 76123
- Home prices YoY
- -17.9%
- Rents YoY
- 1.1%
- Active inventory
- 367
- Price-to-rent
- 9.9×
Monthly cashflow live
- Estimated rent
- $2,069 high interval (Pro) →
- Mortgage (P&I)
- −$1,285
- Tax from tax record
- −$374 /mo · $4,488/yr
- Insurance
- −$102
- HOA
- −$0
- Lot rent
- −$0
- Vacancy / Maint / Mgmt
- −$435
- Net cashflow
- $-126
Break-even live
Sensitivity live
| Price | -10% $12 | -5% $-57 | +0% $-126 | +5% $-196 | +10% $-265 |
|---|---|---|---|---|---|
| Rent | -10% $-290 | -5% $-208 | +0% $-126 | +5% $-45 | +10% $37 |
| Rate | -1.0pp $-3 | -0.5pp $-64 | base $-126 | +0.5pp $-190 | +1.0pp $-254 |
UW: 25.0% down · 7.5% · 30yr · 1.5% tax · 5.0% vac · 8.0% maint · 8.0% mgmt
Financing live
Cash to close
- Down payment
- $61,250
- Closing costs
- $7,350
- Reserves months
- —
- Total cash needed
- —
Loan-product check · same deal, 3 products live
Conventional
25% down · 7.5% · 30yr
- Down + closing
- —
- Monthly P&I
- —
- Monthly cashflow
- —
- DSCR
- —
- Eligible?
- —
Personal DTI + credit; lowest rate.
DSCR
20% down · 8.5% · 30yr
- Down + closing
- —
- Monthly P&I
- —
- Monthly cashflow
- —
- DSCR
- —
- Eligible?
- —
No personal income docs; deal must DSCR.
Hard money
10% down · 12.0% · 12mo
- Down + closing
- —
- Monthly P&I
- —
- Monthly cashflow
- —
- DSCR
- —
- Eligible?
- —
Short-term bridge; refi at stabilization.
Rent comps 40 comps
| Address | Beds | Baths | Sqft | Rent | $/sqft | DOM | Units | Dist |
|---|---|---|---|---|---|---|---|---|
| 2616 Harvest Moon Dr Fort Worth, TX | 3.0 | 2.0 | 1436 | $2,350 | $1.64 | 4d | 1 | 0.15mi |
| 8213 Camellia Tree Ct Fort Worth, TX | 3.0 | 2.0 | 1337 | $1,900 | $1.42 | 46d | 1 | 0.17mi |
| 8220 Runner Oak Ln Fort Worth, TX | 3.0 | 2.0 | 1337 | $1,970 | $1.47 | 27d | 1 | 0.23mi |
| 8320 Hackberry Tree Dr Fort Worth, TX | 3.0 | 2.0 | 1337 | $1,970 | $1.47 | 46d | 1 | 0.27mi |
| 2508 Creekwood Ln Fort Worth, TX | 3.0 | 2.5 | 1867 | $2,145 | $1.15 | 7d | 1 | 0.29mi |
| 2609 Galemeadow Dr Fort Worth, TX | 3.0 | 2.0 | 1356 | $1,995 | $1.47 | 7d | 1 | 0.29mi |
| 8312 Runner Oak Ln Fort Worth, TX | 3.0 | 2.0 | 1337 | $1,970 | $1.47 | 27d | 1 | 0.30mi |
| 8336 Yaupon Holly Trl Fort Worth, TX | 4.0 | 2.5 | 1751 | $2,180 | $1.25 | 27d | 1 | 0.31mi |
| 8361 Horned Maple Trl Fort Worth, TX | 3.0 | 2.0 | 1523 | $2,200 | $1.44 | 46d | 1 | 0.31mi |
| 2605 Bear Oak Dr Fort Worth, TX | 3.0 | 2.0 | 1337 | $1,950 | $1.46 | 7d | 1 | 0.36mi |
| 7741 Galemeadow Ct Fort Worth, TX | 3.0 | 2.0 | 1400 | $1,870 | $1.34 | 23d | 1 | 0.40mi |
| 2805 Galemeadow Dr Fort Worth, TX | 3.0 | 1.5 | 1285 | $1,931 | $1.50 | 1d | 1 | 0.40mi |
| 3100 Fairmeadows Ln Fort Worth, TX | 3.0 | 2.0 | 1219 | $1,965 | $1.61 | 27d | 1 | 0.42mi |
| 2520 Clovermeadow Dr Fort Worth, TX | 3.0 | 2.0 | 1567 | $2,029 | $1.29 | 7d | 1 | 0.42mi |
| 8300 Auburn Dr Fort Worth, TX | 3.0 | 2.5 | 1857 | $1,850 | $1.00 | 1d | 1 | 0.44mi |
| 8328 Ohara Ln Fort Worth, TX | 3.0 | 2.5 | 1826 | $2,145 | $1.17 | 46d | 1 | 0.45mi |
| 2913 Vicksburg Ln Fort Worth, TX | 3.0 | 2.0 | 1720 | $1,800 | $1.05 | 27d | 1 | 0.46mi |
| 7664 Hollow Point Dr Fort Worth, TX | 3.0 | 2.0 | 1400 | $1,895 | $1.35 | 27d | 1 | 0.46mi |
| 8345 Ohara Ln Fort Worth, TX | 4.0 | 2.0 | 1793 | $1,906 | $1.06 | 46d | 1 | 0.46mi |
| 2911 Forest Creek Dr Fort Worth, TX | 3.0 | 2.0 | 1188 | $1,800 | $1.52 | 15d | 1 | 0.49mi |
| 8420 Cloverglen Ln Fort Worth, TX | 3.0 | 2.0 | 1445 | $1,955 | $1.35 | 0d | 1 | 0.50mi |
| 8457 Asheville Ln Fort Worth, TX | 4.0 | 2.0 | 1796 | $2,049 | $1.14 | 46d | 1 | 0.51mi |
| 7617 Hollow Forest Dr Fort Worth, TX | 3.0 | 2.0 | 1400 | $1,905 | $1.36 | 0d | 1 | 0.51mi |
| 2808 Adams Fall Ln Fort Worth, TX | 3.0 | 2.0 | 1545 | $2,100 | $1.36 | 46d | 1 | 0.52mi |
| 2056 Graham Ranch Rd Fort Worth, TX | 3.0 | 2.0 | 1553 | $1,900 | $1.22 | 27d | 1 | 0.52mi |
| 7616 Rainbow Creek Dr Fort Worth, TX | 3.0 | 2.0 | 1400 | $1,855 | $1.32 | 46d | 1 | 0.52mi |
| 8436 Cloverglen Ln Fort Worth, TX | 3.0 | 2.0 | 1166 | $1,825 | $1.57 | 46d | 1 | 0.53mi |
| 3309 Creekwood Ln Fort Worth, TX | 4.0 | 2.0 | 1748 | $2,100 | $1.20 | 0d | 1 | 0.56mi |
| 8505 Delta Way Fort Worth, TX | 3.0 | 2.0 | 1090 | $2,500 | $2.29 | 46d | 1 | 0.58mi |
| 3207 Forest Creek Dr Fort Worth, TX | 3.0 | 2.0 | 1176 | $1,950 | $1.66 | 46d | 1 | 0.60mi |
| 8564 Charleston Ave Fort Worth, TX | 3.0 | 2.5 | 1463 | $1,875 | $1.28 | 27d | 1 | 0.62mi |
| 3104 Stonewall Ln Fort Worth, TX | 3.0 | 2.0 | 1112 | $1,725 | $1.55 | 1d | 1 | 0.64mi |
| 8612 Orleans Ln Fort Worth, TX | 3.0 | 2.0 | 1790 | $1,900 | $1.06 | 46d | 1 | 0.65mi |
| 8525 Auburn Dr Fort Worth, TX | 3.0 | 2.5 | 1463 | $3,229 | $2.21 | 0d | 1 | 0.65mi |
| 3124 Stonewall Ln Fort Worth, TX | 3.0 | 2.0 | 1378 | $1,875 | $1.36 | 7d | 1 | 0.66mi |
| 2109 Shane Ave Fort Worth, TX | 3.0 | 2.5 | 1563 | $1,990 | $1.27 | 23d | 1 | 0.67mi |
| 2201 Sycamore School Rd Unit 2258 Fort Worth, TX | 2.0 | 2.0 | 1200 | $1,135 | $0.95 | 46d | 1 | 0.69mi |
| 2201 Sycamore School Rd Unit 611 Fort Worth, TX | 3.0 | 2.0 | 1318 | $1,322 | $1.00 | 46d | 1 | 0.69mi |
| 2201 Sycamore School Rd Unit 3121 Fort Worth, TX | 3.0 | 2.0 | 1318 | $1,322 | $1.00 | 0d | 1 | 0.69mi |
| 2201 Sycamore School Rd Unit 2121 Fort Worth, TX | 2.0 | 2.0 | 1200 | $1,145 | $0.95 | 0d | 1 | 0.69mi |
Listing history 23 events
-
2026-06-08statusdays on market $245,000 Pending 34 DOM
-
2026-06-07days on market $245,000 Active Option Contract 33 DOM
-
2026-06-04days on market $245,000 Active Option Contract 30 DOM
-
2026-06-03days on market $245,000 Active Option Contract 29 DOM
-
2026-06-02days on market $245,000 Active Option Contract 28 DOM
-
2026-06-01days on market $245,000 Active Option Contract 27 DOM
-
2026-05-31days on market $245,000 Active Option Contract 26 DOM
-
2026-05-05$245,000 Active 568-char remark
-
2015-06-16soldstatus Sold
-
2015-05-13soldstatus
-
2015-04-25status Pending
-
2015-04-21soldstatus Sold
Show marketing remark (302 chars)
Conveniently located close to shopping and parks! Cozy wood burning fireplace in large living area. Open floor plan is perfect for entertaining! Breakfast area in kitchen with lots of cabinet space. Walk in closet in master has built ins. 2nd Bedroom has built-in cabinets, great for an office space.
-
2015-04-15status Active
-
2015-04-15status Pending
-
2015-04-15$108,000 Active
-
2015-04-02historical Active Option Contract
Show marketing remark (302 chars)
Conveniently located close to shopping and parks! Cozy wood burning fireplace in large living area. Open floor plan is perfect for entertaining! Breakfast area in kitchen with lots of cabinet space. Walk in closet in master has built ins. 2nd Bedroom has built-in cabinets, great for an office space.
-
2015-03-31$108,000 Active
Show marketing remark (302 chars)
Conveniently located close to shopping and parks! Cozy wood burning fireplace in large living area. Open floor plan is perfect for entertaining! Breakfast area in kitchen with lots of cabinet space. Walk in closet in master has built ins. 2nd Bedroom has built-in cabinets, great for an office space.
-
2006-09-29soldstatus
-
2006-09-20soldstatus
-
2006-07-28historical
-
2006-06-08$95,000
-
1992-07-28soldstatus
-
1986-10-02soldstatus
ⓘ Source: listings_history table (triggers on properties + properties_extension) + one-shot
backfill from property_details.listing_events for pre-trigger history.
Tax reassessment forecast TX · Resets to sale price
- Current annual tax
- $4,488 · $374/mo
- Projected year-2 tax
- $4,488 · $374/mo
- Expected delta
- $0/yr ($0/mo · 0.0%)
ⓘ Screening estimate from a state-policy table — verify with the county assessor before closing.
Climate risk First Street
- Flood 1/10 Low FEMA zone X (unshaded) · 0% chance over 30 yrs
- Wildfire 4/10 Moderate
- Heat 7/10 Severe 7 d/yr ≥108°F today · 23 d/yr by 30 yrs out
- Wind 5/10 Major 26% chance of damaging wind over 30 yrs
- Air quality 3/10 Moderate 2 unhealthy d/yr today · 3 by 30 yrs out
Nearby sold comps map
Loading sold comps map…
Walkable amenities ~0.75 mi
Loading nearby amenities…
Taxation est. · year 1
- Rental income
- $24,830
- − Mortgage interest
- −$13,724
- − Property taxes
- −$4,488
- − Insurance
- −$1,225
- − Repairs & maintenance
- −$1,986
- − Management
- −$1,986
- − Depreciation
- −$7,127
- Taxable loss
- −$5,707
- Est. tax savings @ 24.0%
- +$1,370
- After-tax cash flow
- $-145/yr
For passive investors: Depreciation is non-cash, so a rental often shows a tax loss while cash-flowing — sheltering income. Rental losses are passive: they offset passive income freely, and up to $25,000/yr can offset ordinary (W-2) income if you actively participate and your MAGI is under $100k (phasing out to $0 by $150k); unused losses carry forward. On sale, claimed depreciation is recaptured at up to 25%, and gains may owe capital-gains tax (a 1031 exchange can defer both). Figures are a year-1 estimate at your 24.0% rate — not tax advice; consult a CPA.
Schools (NCES district)
- District
- Crowley ISD
- NCES district ID
- 4815910
- Math proficiency
- 23% ▼ -15.00%
- Reading proficiency
- 32% ▼ -6.00%
- Median HH income
- $59,810
- Composite
- 25.04/100
- National rank
- #7549
- State rank
- #643 of 826 in TX
Livability — Fort Worth
- Score
- 80/100
- State rank
- #49
- US rank
- #1954
Category grades
Schools grade is shown separately in the Schools card above.
Census & demographics
- Census place
- Fort Worth, TX
- County
- Tarrant County · 2,033,669 people
- City population
- 911,619
- Metro
- Dallas-Fort Worth-Arlington, TX
- Population (ZIP)
- 42,957
- Household income
- $102,768
- Rent vs Own
- Severe rent burden
- 975.0
Population outlook (Tarrant County) Hauer SSP2
- Today (2025)
- 2,380,417 people
- By 2030
- 2,578,900 · +8.3%
- By 2040
- 2,974,995 · +25.0%
- By 2050
- 3,350,489 · +40.8%
- By 2075
- 4,216,909 · +77.2%
- By 2100
- 4,741,527 · +99.2%
Race, ethnicity, and origin ACS 2023
- Neighborhood character
- Highly diverse neighborhood (Simpson 0.73)
- Race & ethnicity
- Black 37% Hispanic / Latino 26% White 24% Two or more races 15% Asian 8%
- Hispanic origin (detail)
- Mexican 22%
- Common ancestry
- Italian 1% Romanian 1% Slovak 1%
- Foreign-born
- 17% · Canada, Vietnam, Jamaica
- Languages at home
- 75% English-only · Spanish 16% Other Indo-European 3% Vietnamese 2%
Political lean MEDSL · Tarrant
- 2024 margin
- Lean R (+5.1) · D 46.7% · R 51.9% · Other 1.4%
- 2008→2024 swing
- +6.6pp toward D · 2008: -11.7pp · 2024: -5.1pp
- All cycles
- 2024: R+5.1 2020: D+0.2 2016: R+8.7 2012: R+15.7 2008: R+11.7
Not yet ingested
- Civics
- —
Market trends
- HPI YoY
- ▼ -50.54%
- Current HPI
- 231.1377
- Rent YoY
- ▲ 1.07%
- Metro
- Dallas-Fort Worth-Arlington, TX
- State GDP YoY
- ▲ 3.95%
- F500 in state
- 110
Industry mix (Fortune 500 HQ in TX)
| Industry | F500 HQs | Revenue |
|---|---|---|
| Energy | 16 | $1,198B |
|
||
| Technology | 5 | $198B |
|
||
| Engineering / Construction | 4 | $72B |
|
||
| Energy Services | 3 | $60B |
|
||
| Utilities | 3 | $41B |
|
||
| Healthcare | 2 | $330B |
|
||
Price history
+157.9% since first listed18 events — show timeline
- 2026-06-08 Pending — NTREIS
- 2026-05-29 Contingent — NTREIS
- 2026-05-05 Listed $245,000 NTREIS
- 2015-06-16 Sold (MLS) — NTREIS
- 2015-05-13 Sold (Public Records) — Public Records
- 2015-04-25 Pending — NTREIS
- 2015-04-21 Sold (MLS) — NTREIS
- 2015-04-15 Relisted — NTREIS
- 2015-04-15 Pending — NTREIS
- 2015-04-15 Listed $108,000 NTREIS
- 2015-04-02 Contingent — NTREIS
- 2015-03-31 Listed $108,000 NTREIS
- 2006-09-29 Sold (Public Records) — Public Records
- 2006-09-20 Sold (MLS) — NTREIS
- 2006-07-28 Listing Removed — NTREIS
- 2006-06-08 Listed $95,000 NTREIS
- 1992-07-28 Sold (Public Records) — Public Records
- 1986-10-02 Sold (Public Records) — Public Records
Property tax history
+3.8%/yrLatest (2025): $4,488 · -15.1% YoY. Source: county tax records.
Cash-flow waterfall
monthlySold comps — $/sqft
last 12 mo · ≤1 miLoading sold comps…