48806 Havirland Rd · Lexington Park, MD
Flood risk 4/10 · Minor
- FEMA flood zone
- X (unshaded)
- Chance of flooding over 30 yrs
- 0.13%
- Est. flood insurance / yr
- $507 – $1,088
Fire risk 3/10 · Minor
- Est. fire insurance / yr
- $755 – $1,403
Heat risk 9/10 · Severe
- Hot days now (above 102°F)
- 7 days/yr
- Hot days in 30 yrs
- 18 days/yr
Wind risk 7/10 · Major
- Chance of severe wind over 30 yrs
- 76.0%
Air-quality risk 2/10 · Minimal
- Unhealthy air days now
- 1 days/yr
- Unhealthy air days in 30 yrs
- 1 days/yr
Risk factors via First Street. Map © Google.
Why this score? — see what drove the B+ grade
The composite is a weighted blend of 9 inputs, each scored 0–100. Each bar is that input's sub-score; the figure is the points it added to the 100-point composite (weight × sub-score).
- Cash flow +28.5/30.0
- ARV discount +15.0/15.0
- DSCR +10.0/10.0
- 1% rule +7.7/10.0
- Appreciation +3.2/10.0
- Livability +3.1/5.0
- Schools +3.0/10.0
- Rent growth +2.6/5.0
- Condition / age +2.5/5.0
$175,000
🖨 Deal sheet 📄 Offer letter ✓ Due diligence
Listing remarks MLS
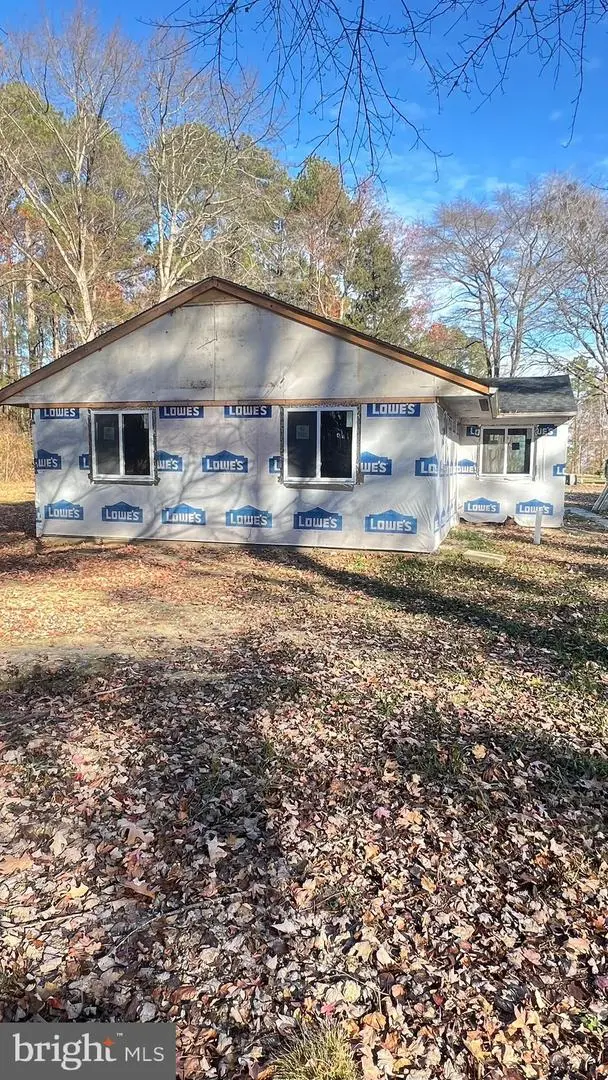
Investor or builder opportunity! 48806 Havirland Rd is a partially renovated property being sold as-is. The seller has completed substantial scope of work but is unable to finish due to running out of funds. Completed improvements include: • Survey drawing completed • Foundation and waterproofing – 100% complete • All wood joints replaced – 100% •Floor plywood replaced – 100% - Window replacement – 100% • Interior walls replaced – 100% • Perimeter walls replaced where needed – 100% • Wood rafters repaired where needed Partially completed work: • Insulation – approximately 80% complete • Roof replacement – approximately 80% complete • Electrical rough-in – approximately 70% complete • Plumbing rough-in – approximately 60% complete This listing also includes the adjacent lot, offering two total parcels for added value and potential expansion. Excellent opportunity for investors, builders, or buyers looking to finish and customize to their specifications. Sold strictly as-is
Key facts
- 0.55 acre lot
- Built 1954
- Listed 108 days
Tags
Neighborhood map
What this means for you Summary
Snapshot
- This is a 3-bed/2.0-bath single-family listed at $175k.
Deal economics
- At list price, monthly cash flow is $571 ($7k/yr) — positive.
- The deal already cash-flows at list — no discount required.
- Meets the 1% rule at list price ($2k rent vs $175k).
- Recommended offer: $159k (9.0% below list) — sets the bar for market timing.
- Cap rate 10.2% vs local median 4.0% in Lexington Park — top-decile yield for the area; either an underpriced asset or a hidden risk that comps aren't pricing in. Stress-test before assuming the spread holds.
Location & tenants
- Location reads 61/100 on livability (#331 in MD) — a middle-class / working-renter tenant base. Strengths: employment A+, housing A; Watch: schools D, crime F, amenities F.
- St. Mary'S County Public Schools (rural): math 23% / reading 38% proficiency, ranked #8 of 24 in MD (top 33%) — families likely to look elsewhere, expect single-tenant / working-renter base with shorter leases.
- Market conditions: Rents flat; 91 active listings in the ZIP; solid renter incomes; 265 units permitted in St. Mary's County in 2024 (0 in 5+ unit buildings).
Forward outlook
- Local home prices are declining (-3.0%/yr); year-one equity from $1k of loan paydown is wiped out by about $5k of value loss. Plan a longer hold.
- St. Mary's County population projected at +16% by 2050 — long-run rental-demand tailwind backs the buy-and-hold thesis.
Negotiation context
- It's been on market 109 days — a 9% lower offer ($159k) is reasonable based on typical stale-listing flexibility.
- 2 sale attempts since 4y ago; this cycle's ask has dropped $25k (12%) from the opening price — seller is motivated, your offer sets the floor, not the list.
- Current owner paid $112k; list at $175k implies a 56% gain — meaningful room to come down on a strong offer.
Risks & watch-outs
- Watch-outs: built in 1954 — expect roof / HVAC / electrical / plumbing capex.
- Climate carrying-cost: major wind risk, 76% chance of damaging wind over 30y; extreme-heat days projected 7→18/yr by 2055 (HVAC capex compounding) — expect insurance premiums to compound above CPI over the hold.
Questions for the listing agent
- It's been on market 109 days. Have you received any prior offers? Is the seller open to a 9% concession, seller financing, or rate buy-down credit?
- Built in 1954 — when were the roof, HVAC, electrical panel, plumbing, and water heater last replaced?
- Why hasn't it sold? Are there any deal-killer items the seller is aware of (foundation, flood, title, zoning, code violations)?
- Is there a deadline driving the sale (1031 exchange, divorce, estate, relocation)? That informs how much negotiation room exists.
- Schools are D-rated, which usually means shorter tenancies and higher turnover. Who's the typical renter profile here, and what's been the actual vacancy rate?
- Crime grade is F in this area — have there been break-ins, vandalism, or insurance claims at this property in the last 3 years? What carrier currently insures it and at what premium?
- What's the average days-on-market for RENTAL listings here right now (not sales)? A rising rental-DOM trend means longer vacancies and softer asking-rent achievability than the comps imply.
- What's the recent tenant-quality profile in this submarket — average credit score on applications, eviction rate, late-payment / NSF rate, and stable-employment percentage? A property-management company in the area should have these aggregated.
- How much new for-sale + rental construction is in the pipeline within 1–3 miles? Heavy new supply typically softens prices + rents 12–24 months out; constrained supply supports both.
Investment metrics
- 1% rule
- 1.27% ✓
- Cap rate
- 10.21%
- Cash-on-cash
- 13.99%
- DSCR
- 1.62
- GRM
- 6.6
CMA / ARV
- ARV (median comp)
- $349,900
- List price
- $175,000
- Delta
- -49.99%
- Verdict
- UNDERPRICED
- Comps
- 7 within 1.0 mi
Show comp detail 2 sales within ~0.75 mi
| Address | Dist | Beds/Ba | Sqft | Sold | Price | $/sf | Match |
|---|---|---|---|---|---|---|---|
| 20183 Tippett Rd | 0.29mi | 3/1.5 | 1,536 (+0%) | 11mo | $560,000 | $365 | 75 |
| 48550 Havirland Rd | 0.51mi | 3/2.0 | 1,456 (-5%) | 14mo | $392,000 | $269 | 56 |
Match score weights: distance 35% · size 25% · config 20% · recency 20%. Top-matched comps best support the ARV.
Projected returns pro-forma
-3.0% appreciation · 0.49% rent growth · sell at horizon
- IRR
- 1.4%
- Equity multiple
- 1.05×
- Total profit
- $2,570
- Equity at exit
- $26,093
- IRR
- 8.4%
- Equity multiple
- 1.57×
- Total profit
- $27,807
- Equity at exit
- $15,131
Cash invested: $49,000 (down + closing). Projections, not guarantees.
Landlord ↔ Tenant lean methodology
- Overall (STATE)
- 27 Tenant-Leaning
- State Maryland
- 27 Tenant-Leaning · D+14
- County
- — inherits STATE
- City
- — inherits STATE
ZIP-level market 20653
- Home prices YoY
- -1.4%
- Rents YoY
- 0.5%
- Active inventory
- 91
- Price-to-rent
- 6.6×
Monthly cashflow live
- Estimated rent
- $2,221 medium interval (Pro) →
- Mortgage (P&I)
- −$918
- Tax from tax record
- −$192 /mo · $2,308/yr
- Insurance
- −$73
- HOA
- −$0
- Vacancy / Maint / Mgmt
- −$466
- Net cashflow
- $571
Break-even live
UW: 25.0% down · 7.5% · 30yr · 1.5% tax · 5.0% vac · 8.0% maint · 8.0% mgmt
Financing live
Cash to close
- Down payment
- $43,750
- Closing costs
- $5,250
- Reserves months
- —
- Total cash needed
- —
Loan-product check · same deal, 3 products live
Conventional
25% down · 7.5% · 30yr
- Down + closing
- —
- Monthly P&I
- —
- Monthly cashflow
- —
- DSCR
- —
- Eligible?
- —
Personal DTI + credit; lowest rate.
DSCR
20% down · 8.5% · 30yr
- Down + closing
- —
- Monthly P&I
- —
- Monthly cashflow
- —
- DSCR
- —
- Eligible?
- —
No personal income docs; deal must DSCR.
Hard money
10% down · 12.0% · 12mo
- Down + closing
- —
- Monthly P&I
- —
- Monthly cashflow
- —
- DSCR
- —
- Eligible?
- —
Short-term bridge; refi at stabilization.
Listing history 16 events
-
2026-06-12days on market $175,000 Active 109 DOM
-
2026-06-09days on market $175,000 Active 106 DOM
-
2026-06-08days on market $175,000 Active 105 DOM
-
2026-06-07days on market $175,000 Active 104 DOM
-
2026-06-05days on market $175,000 Active 101 DOM
-
2026-06-02days on market $175,000 Active 99 DOM
-
2026-06-01days on market $175,000 Active 98 DOM
-
2026-05-31days on market $175,000 Active 97 DOM
-
2026-05-30days on market $175,000 Active 96 DOM
-
2026-04-24price $175,000 1101-char remark
Show marketing remark (1101 chars)
Investor or builder opportunity! 48806 Havirland Rd is a partially renovated property being sold as-is. The seller has completed substantial scope of work but is unable to finish due to running out of funds. Completed improvements include: • Survey drawing completed • Foundation and waterproofing – 100% complete • All wood joints replaced – 100% •Floor plywood replaced – 100% - Window replacement – 100% • Interior walls replaced – 100% • Perimeter walls replaced where needed – 100% • Wood rafters repaired where needed Partially completed work: • Insulation – approximately 80% complete • Roof replacement – approximately 80% complete • Electrical rough-in – approximately 70% complete • Plumbing rough-in – approximately 60% complete This listing also includes the adjacent lot, offering two total parcels for added value and potential expansion. Excellent opportunity for investors, builders, or buyers looking to finish and customize to their specifications. Sold strictly as-is
-
2026-02-23$199,900 Active 1101-char remark
Show marketing remark (1101 chars)
Investor or builder opportunity! 48806 Havirland Rd is a partially renovated property being sold as-is. The seller has completed substantial scope of work but is unable to finish due to running out of funds. Completed improvements include: • Survey drawing completed • Foundation and waterproofing – 100% complete • All wood joints replaced – 100% •Floor plywood replaced – 100% - Window replacement – 100% • Interior walls replaced – 100% • Perimeter walls replaced where needed – 100% • Wood rafters repaired where needed Partially completed work: • Insulation – approximately 80% complete • Roof replacement – approximately 80% complete • Electrical rough-in – approximately 70% complete • Plumbing rough-in – approximately 60% complete This listing also includes the adjacent lot, offering two total parcels for added value and potential expansion. Excellent opportunity for investors, builders, or buyers looking to finish and customize to their specifications. Sold strictly as-is
-
2024-05-22soldstatus $112,000
-
2022-03-10soldstatus $99,900
-
2022-03-04soldstatus $99,900 Closed 190-char remark
Show marketing remark (190 chars)
Sale includes house and lot and joining lot. House needs major work. View of the Chesapeake Bay across the street. Water and beach access across the street. Property sold "as is. "
-
2022-02-18status Pending 190-char remark
Show marketing remark (190 chars)
Sale includes house and lot and joining lot. House needs major work. View of the Chesapeake Bay across the street. Water and beach access across the street. Property sold "as is. "
-
2022-02-15$99,900 Active 190-char remark
Show marketing remark (190 chars)
Sale includes house and lot and joining lot. House needs major work. View of the Chesapeake Bay across the street. Water and beach access across the street. Property sold "as is. "
ⓘ Source: listings_history table (triggers on properties + properties_extension) + one-shot
backfill from property_details.listing_events for pre-trigger history.
Tax reassessment forecast MD · Partial reset (capped growth)
- Current annual tax
- $2,308 · $192/mo
- Projected year-2 tax
- $2,308 · $192/mo
- Expected delta
- $0/yr ($0/mo · 0.0%)
ⓘ Screening estimate from a state-policy table — verify with the county assessor before closing.
Climate risk First Street
- Flood 4/10 Moderate FEMA zone X (unshaded) · 13% chance over 30 yrs
- Wildfire 3/10 Moderate
- Heat 9/10 Extreme 7 d/yr ≥102°F today · 18 d/yr by 30 yrs out
- Wind 7/10 Severe 76% chance of damaging wind over 30 yrs
- Air quality 2/10 Low 1 unhealthy d/yr today · 1 by 30 yrs out
Nearby sold comps map
Loading sold comps map…
Walkable amenities ~0.75 mi
Loading nearby amenities…
Taxation est. · year 1
- Rental income
- $26,646
- − Mortgage interest
- −$9,803
- − Property taxes
- −$2,308
- − Insurance
- −$875
- − Repairs & maintenance
- −$2,132
- − Management
- −$2,132
- − Depreciation
- −$5,091
- Taxable income
- $4,306
- Est. tax owed @ 24.0%
- −$1,033
- After-tax cash flow
- $5,821/yr
For passive investors: Depreciation is non-cash, so a rental often shows a tax loss while cash-flowing — sheltering income. Rental losses are passive: they offset passive income freely, and up to $25,000/yr can offset ordinary (W-2) income if you actively participate and your MAGI is under $100k (phasing out to $0 by $150k); unused losses carry forward. On sale, claimed depreciation is recaptured at up to 25%, and gains may owe capital-gains tax (a 1031 exchange can defer both). Figures are a year-1 estimate at your 24.0% rate — not tax advice; consult a CPA.
Schools (NCES district)
- District
- St. Mary'S County Public Schools
- NCES district ID
- 2400600
- Math proficiency
- 23% ▼ -23.00%
- Reading proficiency
- 38% ▼ -12.00%
- Median HH income
- $83,240
- Composite
- 29.74/100
- National rank
- #6444
- State rank
- #8 of 24 in MD
Livability — Lexington Park
- Score
- 61/100
- State rank
- #331
- US rank
- #17418
Category grades
Schools grade is shown separately in the Schools card above.
Census & demographics
- County
- Saint Marys County · 48,152 people
- City population
- 26,852
- Metro
- California-Lexington Park, MD
- Population (ZIP)
- 26,852
- Household income
- $103,048
- Rent vs Own
- Severe rent burden
- 1571.0
Population outlook (St. Mary's County) Hauer SSP2
- Today (2025)
- 123,125 people
- By 2030
- 128,374 · +4.3%
- By 2040
- 137,305 · +11.5%
- By 2050
- 143,065 · +16.2%
- By 2075
- 153,408 · +24.6%
- By 2100
- 151,790 · +23.3%
Race, ethnicity, and origin ACS 2023
- Neighborhood character
- Diverse neighborhood (Simpson 0.63)
- Race & ethnicity
- White 54% Black 28% Two or more races 11% Hispanic / Latino 6% Asian 4%
- Hispanic origin (detail)
- Mexican 3% Puerto Rican 1%
- Common ancestry
- Romanian 2% Slovak 2% Italian 1%
- Foreign-born
- 6% · Canada, Jamaica
- Languages at home
- 92% English-only · Spanish 3% Tagalog/Filipino 3% Other Asian/Pacific 1%
Political lean MEDSL · St. Mary's
- 2024 margin
- R (+17.2) · D 40.2% · R 57.4% · Other 2.4%
- 2008→2024 swing
- -4.4pp toward R · 2008: -12.8pp · 2024: -17.2pp
- All cycles
- 2024: R+17.2 2020: R+13.8 2016: R+24.6 2012: R+16.1 2008: R+12.8
Not yet ingested
- Civics
- —
Market trends
- HPI YoY
- ▼ -3.67%
- Current HPI
- 256.5435
- Rent YoY
- ▲ 0.49%
- Metro
- California-Lexington Park, MD
- State GDP YoY
- ▲ 2.97%
- F500 in state
- 12
Industry mix (Fortune 500 HQ in MD)
| Industry | F500 HQs | Revenue |
|---|---|---|
| Aerospace / Defense | 1 | $71B |
|
||
| Utilities | 1 | $25B |
|
||
| Hotels | 1 | $24B |
|
||
| Consumer Goods | 1 | $7B |
|
||
| Real Estate | 1 | $6B |
|
||
| Chemicals | 1 | $2B |
|
||
Price history
+75.2% since first listed7 events — show timeline
- 2026-04-24 Price Changed $175,000 BRIGHT MLS
- 2026-02-23 Listed $199,900 BRIGHT MLS
- 2024-05-22 Sold (Public Records) $112,000 Public Records
- 2022-03-10 Sold (Public Records) $99,900 Public Records
- 2022-03-04 Sold (MLS) $99,900 BRIGHT MLS
- 2022-02-18 Pending — BRIGHT MLS
- 2022-02-15 Listed $99,900 BRIGHT MLS
Property tax history
+4.1%/yrLatest (2025): $2,308 · +6.9% YoY. Source: county tax records.
Cash-flow waterfall
monthlySold comps — $/sqft
last 12 mo · ≤1 miLoading sold comps…