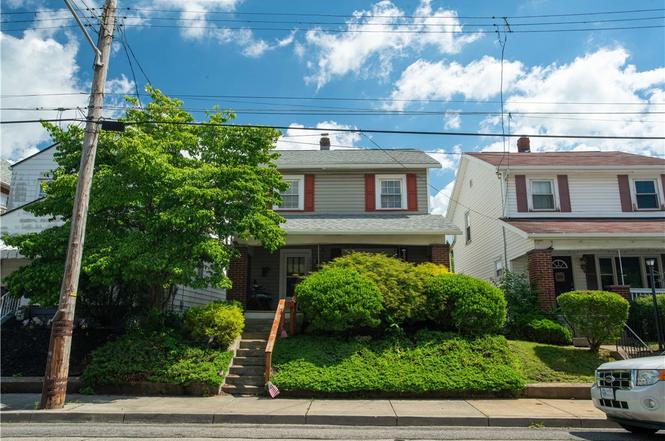
1343 Virginia Ave · Monaca, PA
Flood risk 7/10 · Major
- FEMA flood zone
- X (unshaded)
- Chance of flooding over 30 yrs
- 0.76%
- Est. flood insurance / yr
- $473 – $860
Fire risk 1/10 · Minimal
- Est. fire insurance / yr
- $511 – $949
Heat risk 4/10 · Minor
- Hot days now (above 97°F)
- 8 days/yr
- Hot days in 30 yrs
- 20 days/yr
Wind risk 2/10 · Minimal
- Chance of severe wind over 30 yrs
- —
Air-quality risk 3/10 · Minor
- Unhealthy air days now
- 2 days/yr
- Unhealthy air days in 30 yrs
- 4 days/yr
Risk factors via First Street. Map © Google.
Why this score? — see what drove the C- grade
The composite is a weighted blend of 9 inputs, each scored 0–100. Each bar is that input's sub-score; the figure is the points it added to the 100-point composite (weight × sub-score).
- ARV discount +15.0/15.0
- Cash flow +14.3/30.0
- Schools +5.0/10.0
- DSCR +4.3/10.0
- 1% rule +4.0/10.0
- Livability +4.0/5.0
- Rent growth +2.5/5.0
- Condition / age +2.5/5.0
- Appreciation +0.0/10.0
$150,000
🖨 Deal sheet (PDF) 📄 Offer letter ✓ Due diligence
Listing remarks MLS
CHARMING HOME! MANY UPDATES: NEW SID'G, ROOF, WIN, AIR & ELECTRICAL! * * CALL SELLER B4 SHOWING * * (MISSY'S
Key facts
- Covered front porch
- Functional kitchen
- Decorative fireplace
Tags
Property features AI
Exterior
- Parking: Detached garage with off-street parking (1 total parking space indicated)
- Utilities: Public water; Public sewer
- Home design: Two-story home; Vinyl siding; Asphalt roof; Resale property
- Construction: Vinyl siding construction; Asphalt roof
- Exterior features: Lot approximately 30x100; Small lot (about 0.07 acres)
Interior
- Kitchen: Kitchen on main level (13x09)
- Bedrooms: Three bedrooms (two upper-level bedrooms listed with dimensions: 13x11 and 13x12; a third upper bedroom 10x09)
- Bathrooms: One full bathroom
- Heating & cooling: Forced air gas heating; Central air conditioning
- Interior features: Full basement with interior entry; Fireplace in the living/family room
Neighborhood map
What this means for you Summary
Snapshot
- This is a 3-bed/1.0-bath single-family listed at $150k.
Deal economics
- At list price, monthly cash flow is $-29 ($-348/yr) — negative.
- To cash-flow at today's rent, offer at most $145k (3.4% below list).
- To meet the 1% rule (rent ≥ 1% of price), the offer needs to be $135k (10.2% below list).
- Recommended offer: $135k (10.2% below list) — sets the bar for 1% rule.
- Cap rate 6.5% vs local median 4.6% in Monaca — top-decile yield for the area; either an underpriced asset or a hidden risk that comps aren't pricing in. Stress-test before assuming the spread holds.
Location & tenants
- Location reads 81/100 on livability (#182 in PA, #1,516 nationally) — a professional / high-income tenant draw. Strengths: crime A+, cost of living A+, housing A+; Watch: amenities F, employment D-.
- Zoned schools: Todd Lane El Sch (math 44% / reading 61%, grade C-, #578 of 1,518 statewide, top 38%, 493 students, 28% FRL); Central Valley Ms (math 26% / reading 58%, grade D-, #221 of 512 statewide, top 45%, 543 students, 23% FRL); Central Valley Hs (math 87%, 709 students, 22% FRL).
- Market conditions: 79 active listings in the ZIP; 9 comparable units currently listed for rent nearby; rentals leasing fast (median 6d on market — plan ~1-2 weeks tenant-placement turnaround); 272 units permitted in Beaver County in 2024 (80 in 5+ unit buildings).
Forward outlook
- Local home prices are declining (-3.0%/yr); year-one equity from $1k of loan paydown is wiped out by about $4k of value loss. Plan a longer hold.
- Beaver County population projected at -14% by 2050 — secular population decline; favor cash flow + early exit over multi-decade hold.
Negotiation context
- Only 3 days on market — expect competitive offers; lowballing is unlikely to land.
- 2 sale attempts since 28y ago with the ask held roughly flat each time — persistent listings suggest the price (not the market) is what's stuck; bring a comps-based counter.
- Current owner paid $81k; list at $150k implies a 85% gain — meaningful room to come down on a strong offer.
Risks & watch-outs
- Watch-outs: flood insurance adds $56/mo; built in 1930 — expect roof / HVAC / electrical / plumbing capex.
- Climate carrying-cost: major flood risk — expect insurance premiums to compound above CPI over the hold.
Questions for the listing agent
- What do current leases actually rent for vs. the listed asking? Can we see a recent rent roll and the last 12 months of T-12 income?
- Built in 1930 — when were the roof, HVAC, electrical panel, plumbing, and water heater last replaced?
- What's the actual annual flood-insurance premium (NFIP or private), and is the property in a SFHA with mandatory coverage?
- Is there a deadline driving the sale (1031 exchange, divorce, estate, relocation)? That informs how much negotiation room exists.
- Schools are B-rated — typically a magnet for longer-tenancy family renters. What's the average tenant stay here, and is there a school-zone premium baked into asking?
- What's the average days-on-market for RENTAL listings here right now (not sales)? A rising rental-DOM trend means longer vacancies and softer asking-rent achievability than the comps imply.
- What's the recent tenant-quality profile in this submarket — average credit score on applications, eviction rate, late-payment / NSF rate, and stable-employment percentage? A property-management company in the area should have these aggregated.
- How much new for-sale + rental construction is in the pipeline within 1–3 miles? Heavy new supply typically softens prices + rents 12–24 months out; constrained supply supports both.
Investment metrics
- 1% rule
- 0.90% ✗
- Cap rate
- 6.51%
- Cash-on-cash
- 0.76%
- DSCR
- 1.03
- GRM
- 9.3
CMA / ARV
- ARV (on-the-fly)
- $182,336
- Comps found
- 12
Show comp detail 12 sales within ~0.75 mi
| Address | Dist | Beds/Ba | Sqft | Sold | Price | $/sf | Match |
|---|---|---|---|---|---|---|---|
| 1213 Virginia Ave | 0.15mi | 3/1.5 | 1,290 (+5%) | 3mo | $105,000 | $81 | 80 |
| 1533 Indiana Ave | 0.14mi | 2/1.0 (-1) | 1,072 (-13%) | 7mo | $150,000 | $140 | 61 |
| 303 13th St | 0.09mi | 2/2.0 (-1) | 1,096 (-11%) | 9mo | $159,900 | $146 | 61 |
| 1536 Marshall Rd | 0.63mi | 3/1.0 | 1,280 (+4%) | 4mo | $65,000 | $51 | 60 |
| 600 Indiana Ave | 0.60mi | 3/2.5 | 1,288 (+4%) | 1mo | $190,000 | $148 | 58 |
| 627 Wayne Ave | 0.67mi | 3/2.0 | 1,170 (-5%) | 2mo | $203,000 | $174 | 54 |
| 1199 Marshall Rd | 0.66mi | 3/2.0 | 1,333 (+8%) | 2mo | $225,000 | $169 | 50 |
| 1215 Cascade Rd | 0.67mi | 3/2.0 | 1,316 (+7%) | 8mo | $225,000 | $171 | 46 |
| 211 8th St | 0.52mi | 2/1.5 (-1) | 1,080 (-12%) | 3mo | $82,500 | $76 | 46 |
| 611 Alexander Ave | 0.72mi | 3/1.5 | 1,104 (-10%) | 4mo | $229,900 | $208 | 44 |
| 1201 Marshall Rd | 0.65mi | 3/1.0 | 1,372 (+11%) | 9mo | $165,000 | $120 | 43 |
| 1044 Charles St | 0.66mi | 4/3.0 (+1) | 1,404 (+14%) | 8mo | $259,000 | $184 | 26 |
Match score weights: distance 35% · size 25% · config 20% · recency 20%. Top-matched comps best support the ARV.
Projected returns pro-forma
-3.0% appreciation · 3.0% rent growth · sell at horizon
- IRR
- -17.6%
- Equity multiple
- 0.38×
- Total profit
- $-26,098
- Equity at exit
- $22,365
- IRR
- -9.6%
- Equity multiple
- 0.41×
- Total profit
- $-24,880
- Equity at exit
- $12,969
Cash invested: $42,000 (down + closing). Projections, not guarantees.
Landlord ↔ Tenant lean methodology
- Overall (STATE)
- 62 Landlord-Friendly
- State Pennsylvania
- 62 Landlord-Friendly · EVEN
- County
- — inherits STATE
- City
- — inherits STATE
ZIP-level market 15061
- Home prices YoY
- -28.6%
- Active inventory
- 79
- Price-to-rent
- 9.3×
Monthly cashflow live
- Estimated rent
- $1,347 high interval (Pro) →
- Mortgage (P&I)
- −$787
- Tax from tax record
- −$188 /mo · $2,261/yr
- Insurance
- −$62
- Flood insurance flood zone
- −$56 /mo · $666/yr
- HOA
- −$0
- Vacancy / Maint / Mgmt
- −$283
- Net cashflow
- $-29
Break-even live
Sensitivity live
| Price | -10% $56 | -5% $13 | +0% $-29 | +5% $-71 | +10% $-114 |
|---|---|---|---|---|---|
| Rent | -10% $-135 | -5% $-82 | +0% $-29 | +5% $24 | +10% $77 |
| Rate | -1.0pp $47 | -0.5pp $9 | base $-29 | +0.5pp $-68 | +1.0pp $-107 |
UW: 25.0% down · 7.5% · 30yr · 1.5% tax · 5.0% vac · 8.0% maint · 8.0% mgmt
Financing live
Cash to close
- Down payment
- $37,500
- Closing costs
- $4,500
- Reserves months
- —
- Total cash needed
- —
Loan-product check · same deal, 3 products live
Conventional
25% down · 7.5% · 30yr
- Down + closing
- —
- Monthly P&I
- —
- Monthly cashflow
- —
- DSCR
- —
- Eligible?
- —
Personal DTI + credit; lowest rate.
DSCR
20% down · 8.5% · 30yr
- Down + closing
- —
- Monthly P&I
- —
- Monthly cashflow
- —
- DSCR
- —
- Eligible?
- —
No personal income docs; deal must DSCR.
Hard money
10% down · 12.0% · 12mo
- Down + closing
- —
- Monthly P&I
- —
- Monthly cashflow
- —
- DSCR
- —
- Eligible?
- —
Short-term bridge; refi at stabilization.
Rent comps 9 comps
| Address | Beds | Baths | Sqft | Rent | $/sqft | DOM | Units | Dist |
|---|---|---|---|---|---|---|---|---|
| 1228 Eckert Rd Monaca, PA | 4.0 | 1.0 | 1185 | $1,550 | $1.31 | 45d | 1 | 0.71mi |
| 1003 Locust Dr Monaca, PA | 3.0 | 2.5 | 1320 | $1,650 | $1.25 | 16d | 1 | 0.85mi |
| 635 3rd Ave Freedom, PA | 2.0 | 1.0 | 1050 | $950 | $0.90 | 0d | 1 | 0.99mi |
| 243 Pennsylvania Ave Unit 1 Rochester, PA | 2.0 | 1.0 | 1000 | $1,100 | $1.10 | 16d | 1 | 1.01mi |
| 2014 Birch Rd Monaca, PA | 3.0 | 2.5 | 1192 | $1,825 | $1.53 | 0d | 1 | 1.04mi |
| 526 Adams St Unit 2 Rochester, PA | 3.0 | 1.0 | 1000 | $850 | $0.85 | 45d | 1 | 1.13mi |
| 230 W Madison St Unit 6 Rochester, PA | 2.0 | 1.0 | 975 | $1,100 | $1.13 | 0d | 1 | 1.19mi |
| 467 Reno St Rochester, PA | 3.0 | 1.0 | 1092 | $1,200 | $1.10 | 3d | 1 | 1.23mi |
| 1401 4th Ave #1 Freedom, PA | 2.0 | 1.0 | 955 | $850 | $0.89 | 5d | 1 | 1.46mi |
Listing history 3 events
-
2026-06-21days on market $150,000 Active 3 DOM
-
2026-06-19remarks 699-char remark
-
2026-06-19$150,000 Active 1 DOM
ⓘ Source: listings_history table (triggers on properties + properties_extension) + one-shot
backfill from property_details.listing_events for pre-trigger history.
Tax reassessment forecast PA · Partial reset (capped growth)
- Current annual tax
- $2,261 · $188/mo
- Projected year-2 tax
- $2,315 · $193/mo
- Expected delta
- +$55/yr (+$5/mo · 2.4%)
ⓘ Screening estimate from a state-policy table — verify with the county assessor before closing.
Climate risk First Street
- Flood 7/10 Severe FEMA zone X (unshaded) · 76% chance over 30 yrs
- Wildfire 1/10 Low
- Heat 4/10 Moderate 8 d/yr ≥97°F today · 20 d/yr by 30 yrs out
- Wind 2/10 Low
- Air quality 3/10 Moderate 2 unhealthy d/yr today · 4 by 30 yrs out
Nearby sold comps map
Loading sold comps map…
Walkable amenities ~0.75 mi
Loading nearby amenities…
Taxation est. · year 1
- Rental income
- $16,163
- − Mortgage interest
- −$8,402
- − Property taxes
- −$2,261
- − Insurance
- −$1,416
- − Repairs & maintenance
- −$1,293
- − Management
- −$1,293
- − Depreciation
- −$4,364
- Taxable loss
- −$2,866
- Est. tax savings @ 24.0%
- +$688
- After-tax cash flow
- $340/yr
For passive investors: Depreciation is non-cash, so a rental often shows a tax loss while cash-flowing — sheltering income. Rental losses are passive: they offset passive income freely, and up to $25,000/yr can offset ordinary (W-2) income if you actively participate and your MAGI is under $100k (phasing out to $0 by $150k); unused losses carry forward. On sale, claimed depreciation is recaptured at up to 25%, and gains may owe capital-gains tax (a 1031 exchange can defer both). Figures are a year-1 estimate at your 24.0% rate — not tax advice; consult a CPA.
Schools (NCES district)
No district data.
Livability — Monaca
- Score
- 81/100
- State rank
- #182
- US rank
- #1516
Category grades
Schools grade is shown separately in the Schools card above.
Census & demographics
- Census place
- Monaca, PA
- County
- Beaver County · 116,001 people
- City population
- 12,413
- Metro
- Pittsburgh, PA
- Population (ZIP)
- 12,413
- Household income
- $73,010
- Rent vs Own
- Severe rent burden
- 123.0
Population outlook (Beaver County) Hauer SSP2
- Today (2025)
- 164,976 people
- By 2030
- 161,449 · -2.1%
- By 2040
- 151,752 · -8.0%
- By 2050
- 141,155 · -14.4%
- By 2075
- 118,142 · -28.4%
- By 2100
- 91,740 · -44.4%
Race, ethnicity, and origin ACS 2023
- Neighborhood character
- Predominantly White (88%)
- Race & ethnicity
- White 88% Two or more races 5% Black 5% Hispanic / Latino 3%
- Common ancestry
- Romanian 6% Serbian 3% Slovak 1%
- Foreign-born
- 2% · Canada
- Languages at home
- 97% English-only · Spanish 1%
Political lean MEDSL · Beaver
- 2024 margin
- Strong R (+20.7) · D 39.2% · R 59.9%
- 2008→2024 swing
- -17.9pp toward R · 2008: -2.8pp · 2024: -20.7pp
- All cycles
- 2024: R+20.7 2020: R+17.7 2016: R+20.1 2012: R+6.6 2008: R+2.8
Not yet ingested
- Civics
- —
Market trends
- HPI YoY
- ▼ -93.11%
- Current HPI
- 232.6703
- Rent YoY
- —
- Metro
- Pittsburgh, PA
- State GDP YoY
- ▲ 1.68%
- F500 in state
- 34
Industry mix (Fortune 500 HQ in PA)
| Industry | F500 HQs | Revenue |
|---|---|---|
| Healthcare | 2 | $309B |
|
||
| Insurance | 2 | $27B |
|
||
| Telecommunications / Media | 1 | $124B |
|
||
| Industrial Distribution | 1 | $22B |
|
||
| Financial Services | 1 | $20B |
|
||
| Chemicals / Materials | 1 | $18B |
|
||
Price history
+900.0% since first listed7 events — show timeline
- 2026-06-18 Listed $150,000 West Penn MLS
- 2001-07-26 Sold (Public Records) $81,000 Public Records
- 1998-12-17 Sold (Public Records) $68,000 Public Records
- 1998-12-17 Sold (MLS) $68,000 West Penn MLS
- 1998-06-29 Listed $73,000 West Penn MLS
- 1990-01-31 Sold (Public Records) $28,000 Public Records
- 1979-10-01 Sold (Public Records) $15,000 Public Records
Property tax history
+2.5%/yrLatest (2026): $2,261 · +4.3% YoY. Source: county tax records.
Cash-flow waterfall
monthlySold comps — $/sqft
last 12 mo · ≤1 miLoading sold comps…