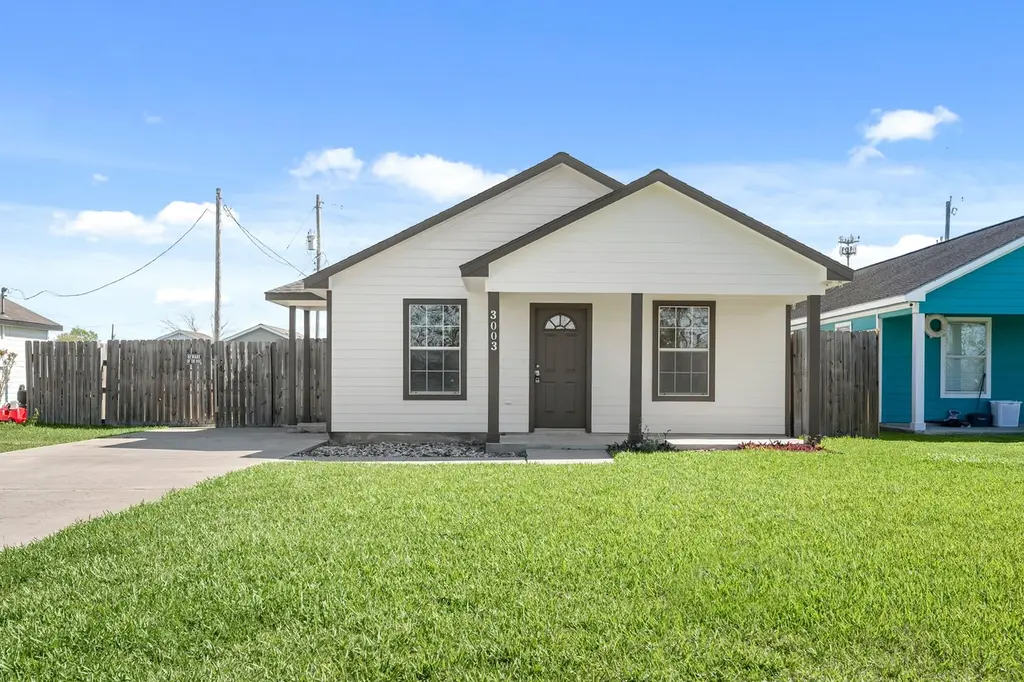
3003 Florida St · Dickinson, TX
Flood risk 6/10 · Moderate
- FEMA flood zone
- X (shaded)
- Chance of flooding over 30 yrs
- 0.57%
- Est. flood insurance / yr
- $507 – $1,088
Fire risk 1/10 · Minimal
- Est. fire insurance / yr
- $1,222 – $2,270
Heat risk 10/10 · Severe
- Hot days now (above 110°F)
- 7 days/yr
- Hot days in 30 yrs
- 27 days/yr
Wind risk 9/10 · Severe
- Chance of severe wind over 30 yrs
- 99.0%
Air-quality risk 2/10 · Minimal
- Unhealthy air days now
- 1 days/yr
- Unhealthy air days in 30 yrs
- 1 days/yr
Risk factors via First Street. Map © Google.
Why this score? — see what drove the D grade
The composite is a weighted blend of 9 inputs, each scored 0–100. Each bar is that input's sub-score; the figure is the points it added to the 100-point composite (weight × sub-score).
- Cash flow +13.1/30.0
- ARV discount +9.8/15.0
- DSCR +3.9/10.0
- 1% rule +3.8/10.0
- Schools +3.5/10.0
- Livability +3.4/5.0
- Rent growth +2.5/5.0
- Condition / age +2.5/5.0
- Appreciation +0.0/10.0
$199,000
🖨 Deal sheet (PDF) 📄 Offer letter ✓ Due diligence
Listing remarks MLS
Charming 3-bedroom, 2-bath home featuring thoughtful interior updates and fresh exterior paint. This inviting property offers a spacious backyard—perfect for relaxing or entertaining—and is nestled on a quiet street. Conveniently located in the heart of Dickinson with easy access to major freeways, this home combines comfort and accessibility. Don’t miss out—schedule your showing today!
Key facts
- Quiet street
- Spacious backyard
- Interior updates
Tags
Neighborhood map
What this means for you Summary
Snapshot
- This is a 3-bed/2.0-bath single-family listed at $199k.
Deal economics
- At list price, monthly cash flow is $-6 ($-76/yr) — negative.
- To cash-flow at today's rent, offer at most $198k (0.6% below list).
- To meet the 1% rule (rent ≥ 1% of price), the offer needs to be $175k (12.0% below list).
- Recommended offer: $175k (12.0% below list) — sets the bar for 1% rule.
- Cap rate 6.3% vs local median 2.4% in Dickinson — top-decile yield for the area; either an underpriced asset or a hidden risk that comps aren't pricing in. Stress-test before assuming the spread holds.
Location & tenants
- Location reads 67/100 on livability (#533 in TX) — a middle-class / working-renter tenant base. Strengths: cost of living A+, housing A+, employment A-; Watch: amenities F, commute F, health & safety F.
- Dickinson ISD (suburban): math 39% / reading 40% proficiency, ranked #366 of 826 in TX (top 44%) — families likely to look elsewhere, expect single-tenant / working-renter base with shorter leases; 60% free/reduced lunch — lower-income household profile, screen leases tightly.
- Zoned schools: Jake Silbernagel El (math 36% / reading 33%, grade F, #1,995 of 4,322 statewide, top 50%, 640 students, 86% FRL); R D Mcadams J H (math 32% / reading 40%, grade F, #805 of 1,662 statewide, top 50%, 950 students, 65% FRL); Dickinson H S (math 30% / reading 46%, grade F, #880 of 1,632 statewide, top 54%, 3,619 students, 64% FRL).
- Market conditions: Rents soft (-0.1%/yr); 678 active listings in the ZIP; 22 comparable units currently listed for rent nearby; rentals at typical pace (median 15d on market — plan ~3-4 weeks tenant-placement turnaround); solid renter incomes; 3,258 units permitted in Galveston County in 2024 (0 in 5+ unit buildings).
Forward outlook
- Local home prices are declining (-3.0%/yr); year-one equity from $1k of loan paydown is wiped out by about $6k of value loss. Plan a longer hold.
- Galveston County population projected at +43% by 2050 — long-run rental-demand tailwind backs the buy-and-hold thesis.
Negotiation context
- It's been on market 64 days — a 6% lower offer ($187k) is reasonable based on typical stale-listing flexibility.
Risks & watch-outs
- Climate carrying-cost: major flood risk; severe wind risk, 99% chance of damaging wind over 30y; extreme-heat days projected 7→27/yr by 2055 (HVAC capex compounding) — expect insurance premiums to compound above CPI over the hold.
Questions for the listing agent
- What do current leases actually rent for vs. the listed asking? Can we see a recent rent roll and the last 12 months of T-12 income?
- It's been on market 64 days. Have you received any prior offers? Is the seller open to a 12% concession, seller financing, or rate buy-down credit?
- Why hasn't it sold? Are there any deal-killer items the seller is aware of (foundation, flood, title, zoning, code violations)?
- Is there a deadline driving the sale (1031 exchange, divorce, estate, relocation)? That informs how much negotiation room exists.
- Schools are D-rated, which usually means shorter tenancies and higher turnover. Who's the typical renter profile here, and what's been the actual vacancy rate?
- The area grade is low — what's the realistic commute time and amenity access for the typical tenant pool here? Any planned neighborhood developments (good or bad) we should know about?
- What's the average days-on-market for RENTAL listings here right now (not sales)? A rising rental-DOM trend means longer vacancies and softer asking-rent achievability than the comps imply.
- What's the recent tenant-quality profile in this submarket — average credit score on applications, eviction rate, late-payment / NSF rate, and stable-employment percentage? A property-management company in the area should have these aggregated.
- How much new for-sale + rental construction is in the pipeline within 1–3 miles? Heavy new supply typically softens prices + rents 12–24 months out; constrained supply supports both.
Investment metrics
- 1% rule
- 0.88% ✗
- Cap rate
- 6.25%
- Cash-on-cash
- -0.14%
- DSCR
- 0.99
- GRM
- 9.5
CMA / ARV
- ARV (median comp)
- $209,593
- List price
- $199,000
- Delta
- -5.05%
- Verdict
- FAIR
- Comps
- 20 within 1.0 mi
Show comp detail 12 sales within ~0.75 mi
| Address | Dist | Beds/Ba | Sqft | Sold | Price | $/sf | Match |
|---|---|---|---|---|---|---|---|
| 3003 Florida St | 0.00mi | 3/2.0 | 1,222 (0%) | 1mo | $199,000 | $163 | 99 |
| 3232 Teakwood Cir | 0.36mi | 3/2.0 | 1,302 (+6%) | 14mo | $199,900 | $154 | 61 |
| 2804 Daisy St | 0.44mi | 3/2.0 | 1,344 (+10%) | 4mo | $199,000 | $148 | 59 |
| 3103 Avenue H | 0.59mi | 3/1.0 | 1,243 (+2%) | 8mo | $139,000 | $112 | 59 |
| 4416 33rd St | 0.65mi | 4/2.0 (+1) | 1,248 (+2%) | 11mo | $225,000 | $180 | 52 |
| 3240 Teakwood Cir | 0.35mi | 3/2.0 | 1,379 (+13%) | 15mo | $236,000 | $171 | 50 |
| 4007 Raspberry Ct | 0.56mi | 3/2.0 | 1,310 (+7%) | 15mo | $249,000 | $190 | 49 |
| 4009 Victoria Ave | 0.68mi | 3/2.0 | 1,121 (-8%) | 9mo | $209,900 | $187 | 47 |
| 2217 Avenue F | 0.71mi | 3/1.0 | 1,188 (-3%) | 17mo | $145,000 | $122 | 44 |
| 2807 Chicago St | 0.52mi | 4/2.0 (+1) | 1,390 (+14%) | 7mo | $175,000 | $126 | 42 |
| 2702 Avenue H | 0.66mi | 3/2.0 | 1,365 (+12%) | 10mo | $239,900 | $176 | 42 |
| 4023 Cranberry Ct | 0.50mi | 2/2.0 (-1) | 1,074 (-12%) | 18mo | $199,990 | $186 | 36 |
Match score weights: distance 35% · size 25% · config 20% · recency 20%. Top-matched comps best support the ARV.
Projected returns pro-forma
-3.0% appreciation · 0.0% rent growth · sell at horizon
- IRR
- -20.0%
- Equity multiple
- 0.32×
- Total profit
- $-37,745
- Equity at exit
- $29,672
- IRR
- -21.3%
- Equity multiple
- 0.05×
- Total profit
- $-53,075
- Equity at exit
- $17,206
Cash invested: $55,720 (down + closing). Projections, not guarantees.
Landlord ↔ Tenant lean methodology
- Overall (STATE)
- 87 Strongly Landlord-Friendly
- State Texas
- 87 Strongly Landlord-Friendly · R+5
- County
- — inherits STATE
- City
- — inherits STATE
ZIP-level market 77539
- Home prices YoY
- -29.8%
- Rents YoY
- -0.1%
- Active inventory
- 678
- Price-to-rent
- 9.5×
Monthly cashflow live
- Estimated rent
- $1,751 high interval (Pro) →
- Mortgage (P&I)
- −$1,044
- Tax from tax record
- −$263 /mo · $3,159/yr
- Insurance
- −$83
- HOA
- −$0
- Vacancy / Maint / Mgmt
- −$368
- Net cashflow
- $-6
Break-even live
Sensitivity live
| Price | -10% $106 | -5% $50 | +0% $-6 | +5% $-63 | +10% $-119 |
|---|---|---|---|---|---|
| Rent | -10% $-145 | -5% $-75 | +0% $-6 | +5% $63 | +10% $132 |
| Rate | -1.0pp $94 | -0.5pp $44 | base $-6 | +0.5pp $-58 | +1.0pp $-110 |
UW: 25.0% down · 7.5% · 30yr · 1.5% tax · 5.0% vac · 8.0% maint · 8.0% mgmt
Financing live
Cash to close
- Down payment
- $49,750
- Closing costs
- $5,970
- Reserves months
- —
- Total cash needed
- —
Loan-product check · same deal, 3 products live
Conventional
25% down · 7.5% · 30yr
- Down + closing
- —
- Monthly P&I
- —
- Monthly cashflow
- —
- DSCR
- —
- Eligible?
- —
Personal DTI + credit; lowest rate.
DSCR
20% down · 8.5% · 30yr
- Down + closing
- —
- Monthly P&I
- —
- Monthly cashflow
- —
- DSCR
- —
- Eligible?
- —
No personal income docs; deal must DSCR.
Hard money
10% down · 12.0% · 12mo
- Down + closing
- —
- Monthly P&I
- —
- Monthly cashflow
- —
- DSCR
- —
- Eligible?
- —
Short-term bridge; refi at stabilization.
Rent comps 22 comps
| Address | Beds | Baths | Sqft | Rent | $/sqft | DOM | Units | Dist |
|---|---|---|---|---|---|---|---|---|
| 3206 Teakwood Cir Dickinson, TX | 3.0 | 2.0 | 1323 | $1,915 | $1.45 | 24d | 1 | 0.38mi |
| 3011 FM 517 Rd E Unit 3015 Dickinson, TX | 2.0 | 1.0 | 1050 | $1,300 | $1.24 | 45d | 1 | 0.86mi |
| 3011 FM 517 Rd E Dickinson, TX | 2.0 | 1.0 | 1050 | $1,300 | $1.24 | 45d | 1 | 0.86mi |
| 2103 Holly Dr Dickinson, TX | 2.0 | 1.0 | 840 | $1,450 | $1.73 | 45d | 1 | 0.87mi |
| 5008 Asia Ln Dickinson, TX | 3.0 | 2.0 | 1475 | $1,739 | $1.18 | 14d | 1 | 1.08mi |
| 2147 Aruba Calle Dickinson, TX | 2.0 | 2.0 | 1069 | $1,550 | $1.45 | 19d | 1 | 1.16mi |
| 5015 Akumal Calle Dickinson, TX | 2.0 | 2.5 | 1132 | $1,650 | $1.46 | 45d | 1 | 1.19mi |
| 5049 Hauna Ln Dickinson, TX | 3.0 | 2.0 | 1272 | $1,795 | $1.41 | 5d | 1 | 1.20mi |
| 2130 Saint Lucia Calle Dickinson, TX | 2.0 | 2.5 | 1272 | $1,550 | $1.22 | 19d | 1 | 1.23mi |
| 2114 Saint Lucia Calle Dickinson, TX | 2.0 | 2.5 | 1132 | $1,450 | $1.28 | 0d | 1 | 1.24mi |
| 2106 Saint Lucia Calle Dickinson, TX | 2.0 | 2.5 | 1272 | $1,550 | $1.22 | 5d | 1 | 1.24mi |
| 2114 Roatan Calle Dickinson, TX | 2.0 | 2.5 | 1132 | $1,700 | $1.50 | 0d | 1 | 1.29mi |
| 5053 Akumal Calle Dickinson, TX | 2.0 | 2.5 | 1272 | $1,750 | $1.38 | 0d | 1 | 1.30mi |
| 5101 Coba Calle Dickinson, TX | 3.0 | 2.0 | 1140 | $1,500 | $1.32 | 45d | 1 | 1.32mi |
| 5098 Akumal Calle Dickinson, TX | 2.0 | 2.5 | 1272 | $1,700 | $1.34 | 6d | 1 | 1.39mi |
| 555 FM 646 Rd Unit 612 Dickinson, TX | 2.0 | 2.0 | 1140 | $1,495 | $1.31 | 14d | 1 | 1.39mi |
| 555 FM 646 Rd Unit 592 Dickinson, TX | 2.0 | 2.0 | 1140 | $1,470 | $1.29 | 17d | 1 | 1.39mi |
| 555 FM 646 Rd Unit 2162 Dickinson, TX | 2.0 | 2.0 | 1102 | $1,674 | $1.52 | 7d | 1 | 1.39mi |
| 555 FM 646 Rd Unit 578 Dickinson, TX | 2.0 | 2.0 | 1102 | $1,658 | $1.50 | 0d | 1 | 1.39mi |
| 5102 Akumal Calle Dickinson, TX | 2.0 | 2.5 | 1132 | $1,450 | $1.28 | 45d | 1 | 1.39mi |
| 5139 Martinique Calle Dickinson, TX | 3.0 | 2.0 | 1140 | $1,750 | $1.54 | 6d | 1 | 1.42mi |
| 555 Fm RD Dickinson, TX | 1.0–2.0 | 1.0–2.0 | 1056 | $1,945 | $1.84 | 4d | 27 | 1.43mi |
Listing history 4 events
-
2026-05-13status Pending 413-char remark
Show marketing remark (413 chars)
Charming 3-bedroom, 2-bath home featuring thoughtful interior updates and fresh exterior paint. This inviting property offers a spacious backyard—perfect for relaxing or entertaining—and is nestled on a quiet street. Conveniently located in the heart of Dickinson with easy access to major freeways, this home combines comfort and accessibility. Don’t miss out—schedule your showing today!
-
2026-04-10price $199,000 413-char remark
Show marketing remark (413 chars)
Charming 3-bedroom, 2-bath home featuring thoughtful interior updates and fresh exterior paint. This inviting property offers a spacious backyard—perfect for relaxing or entertaining—and is nestled on a quiet street. Conveniently located in the heart of Dickinson with easy access to major freeways, this home combines comfort and accessibility. Don’t miss out—schedule your showing today!
-
2026-04-02price $205,000 413-char remark
Show marketing remark (413 chars)
Charming 3-bedroom, 2-bath home featuring thoughtful interior updates and fresh exterior paint. This inviting property offers a spacious backyard—perfect for relaxing or entertaining—and is nestled on a quiet street. Conveniently located in the heart of Dickinson with easy access to major freeways, this home combines comfort and accessibility. Don’t miss out—schedule your showing today!
-
2026-03-17$215,000 Active 413-char remark
Show marketing remark (413 chars)
Charming 3-bedroom, 2-bath home featuring thoughtful interior updates and fresh exterior paint. This inviting property offers a spacious backyard—perfect for relaxing or entertaining—and is nestled on a quiet street. Conveniently located in the heart of Dickinson with easy access to major freeways, this home combines comfort and accessibility. Don’t miss out—schedule your showing today!
ⓘ Source: listings_history table (triggers on properties + properties_extension) + one-shot
backfill from property_details.listing_events for pre-trigger history.
Tax reassessment forecast TX · Resets to sale price
- Current annual tax
- $3,159 · $263/mo
- Projected year-2 tax
- $3,642 · $303/mo
- Expected delta
- +$483/yr (+$40/mo · 15.3%)
ⓘ Screening estimate from a state-policy table — verify with the county assessor before closing.
Climate risk First Street
- Flood 6/10 Major FEMA zone X (shaded) · 57% chance over 30 yrs
- Wildfire 1/10 Low
- Heat 10/10 Extreme 7 d/yr ≥110°F today · 27 d/yr by 30 yrs out
- Wind 9/10 Extreme 99% chance of damaging wind over 30 yrs
- Air quality 2/10 Low 1 unhealthy d/yr today · 1 by 30 yrs out
Nearby sold comps map
Loading sold comps map…
Walkable amenities ~0.75 mi
Loading nearby amenities…
Taxation est. · year 1
- Rental income
- $21,014
- − Mortgage interest
- −$11,147
- − Property taxes
- −$3,159
- − Insurance
- −$995
- − Repairs & maintenance
- −$1,681
- − Management
- −$1,681
- − Depreciation
- −$5,789
- Taxable loss
- −$3,438
- Est. tax savings @ 24.0%
- +$825
- After-tax cash flow
- $749/yr
For passive investors: Depreciation is non-cash, so a rental often shows a tax loss while cash-flowing — sheltering income. Rental losses are passive: they offset passive income freely, and up to $25,000/yr can offset ordinary (W-2) income if you actively participate and your MAGI is under $100k (phasing out to $0 by $150k); unused losses carry forward. On sale, claimed depreciation is recaptured at up to 25%, and gains may owe capital-gains tax (a 1031 exchange can defer both). Figures are a year-1 estimate at your 24.0% rate — not tax advice; consult a CPA.
Schools (NCES district)
- District
- Dickinson ISD
- NCES district ID
- 4817070
- Math proficiency
- 39% ▼ -11.00%
- Reading proficiency
- 40% ▼ -2.00%
- Median HH income
- $61,318
- Composite
- 35.16/100
- National rank
- #5005
- State rank
- #366 of 826 in TX
Livability — Dickinson
- Score
- 67/100
- State rank
- #533
- US rank
- #10431
Category grades
Schools grade is shown separately in the Schools card above.
Census & demographics
- County
- Galveston County · 357,330 people
- City population
- 49,375
- Metro
- Houston-The Woodlands-Sugar Land, TX
- Population (ZIP)
- 49,375
- Household income
- $89,111
- Rent vs Own
- Severe rent burden
- 869.0
Population outlook (Galveston County) Hauer SSP2
- Today (2025)
- 390,640 people
- By 2030
- 425,226 · +8.9%
- By 2040
- 493,765 · +26.4%
- By 2050
- 559,698 · +43.3%
- By 2075
- 719,260 · +84.1%
- By 2100
- 819,628 · +109.8%
Race, ethnicity, and origin ACS 2023
- Neighborhood character
- Diverse neighborhood (Simpson 0.64)
- Race & ethnicity
- White 47% Hispanic / Latino 37% Two or more races 19% Black 10% Asian 3%
- Hispanic origin (detail)
- Mexican 29% Puerto Rican 2%
- Common ancestry
- Italian 3% Romanian 2% Lithuanian 1%
- Foreign-born
- 13% · Canada, Vietnam
- Languages at home
- 73% English-only · Spanish 24% Vietnamese 1% Other Indo-European 1%
Political lean MEDSL · Galveston
- 2024 margin
- Strong R (+27.4) · D 35.7% · R 63.1% · Other 1.2%
- 2008→2024 swing
- -7.9pp toward R · 2008: -19.5pp · 2024: -27.4pp
- All cycles
- 2024: R+27.4 2020: R+22.6 2016: R+22.6 2012: R+26.9 2008: R+19.5
Not yet ingested
- Civics
- —
Market trends
- HPI YoY
- ▼ -109.46%
- Current HPI
- 258.0104
- Rent YoY
- ▼ -0.12%
- Metro
- Houston-The Woodlands-Sugar Land, TX
- State GDP YoY
- ▲ 3.95%
- F500 in state
- 110
Industry mix (Fortune 500 HQ in TX)
| Industry | F500 HQs | Revenue |
|---|---|---|
| Energy | 16 | $1,198B |
|
||
| Technology | 5 | $198B |
|
||
| Engineering / Construction | 4 | $72B |
|
||
| Energy Services | 3 | $60B |
|
||
| Utilities | 3 | $41B |
|
||
| Healthcare | 2 | $330B |
|
||
Price history
-7.4% since first listed4 events — show timeline
- 2026-05-13 Pending — HARMLS
- 2026-04-10 Price Changed $199,000 HARMLS
- 2026-04-02 Price Changed $205,000 HARMLS
- 2026-03-17 Listed $215,000 HARMLS
Property tax history
+6.9%/yrLatest (2025): $3,159 · +9.3% YoY. Source: county tax records.
Cash-flow waterfall
monthlySold comps — $/sqft
last 12 mo · ≤1 miLoading sold comps…