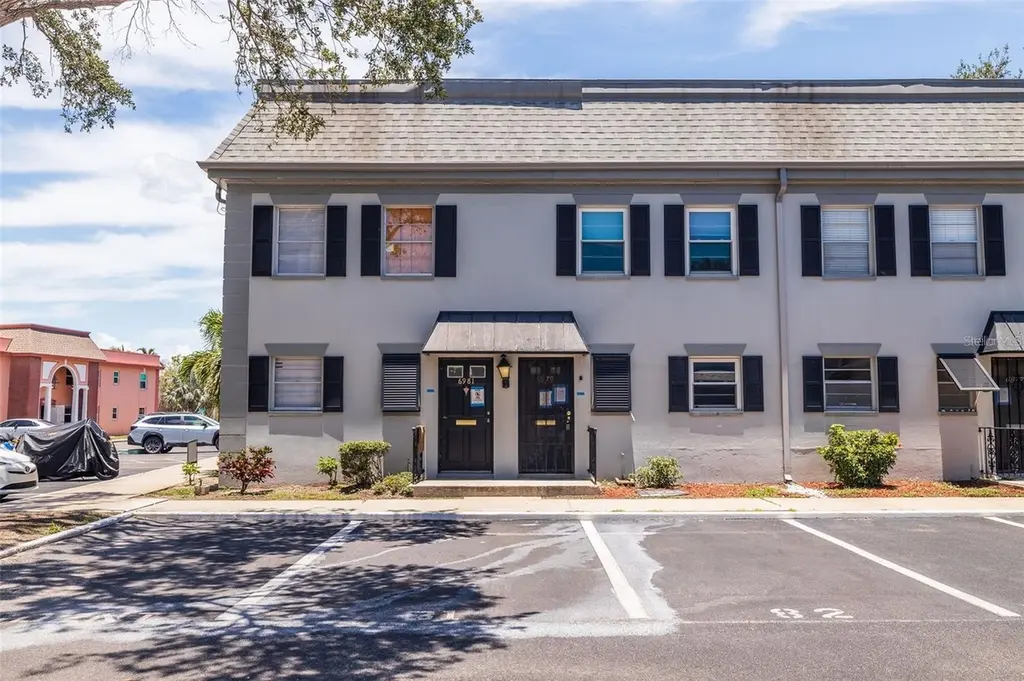
6979 Place DE LA Paix #6979 · South Pasadena, FL
Flood risk 10/10 · Severe
- FEMA flood zone
- AE
- Chance of flooding over 30 yrs
- 0.99%
- Est. flood insurance / yr
- $1,737 – $8,500
Fire risk 1/10 · Minimal
- Est. fire insurance / yr
- $947 – $1,759
Heat risk 10/10 · Severe
- Hot days now (above 106°F)
- 7 days/yr
- Hot days in 30 yrs
- 26 days/yr
Wind risk 10/10 · Severe
- Chance of severe wind over 30 yrs
- 99.0%
Air-quality risk 4/10 · Minor
- Unhealthy air days now
- 4 days/yr
- Unhealthy air days in 30 yrs
- 4 days/yr
Risk factors via First Street. Map © Google.
Why this score? — see what drove the B grade
The composite is a weighted blend of 9 inputs, each scored 0–100. Each bar is that input's sub-score; the figure is the points it added to the 100-point composite (weight × sub-score).
- Cash flow +30.0/30.0
- 1% rule +10.0/10.0
- DSCR +10.0/10.0
- ARV discount +7.5/15.0
- Schools +4.3/10.0
- Livability +4.1/5.0
- Condition / age +2.5/5.0
- Rent growth +2.3/5.0
- Appreciation +0.0/10.0
$126,000
🖨 Deal sheet (PDF) 📄 Offer letter ✓ Due diligence
Listing remarks
Short Sale. Under market value! Amazing opportunity to own a two-story condo less than 3 miles to the beach! Great community, all ages. Plenty of parking for guests to visit. Pool open year round. Walking distance to Publix, Winn-Dixie, Walmart Neighborhood Store, Ace Hardware, Gas stations, stores and many restaurants. This property scored an 81 out of 100 on the Walking Score meter. You can accomplish all you need on foot or bicycle. Bring your creative ideas to your newly renovated property. Home boasts a spacious living room and dining combo. Brand New sliding glass door to enjoy your covered patio. Brand new kitchen will be installed with all new appliances. 1/2 bath downstairs. Storag
Key facts
- Community pool
- Built 1968
Property features AI
Finance
- Other: Unfurnished; Buyer approval required for community
- Financial info: Lease restrictions apply
- HOA & community: HOA required with monthly fees; Association amenities include a pool; Association fee covers cable TV, internet, pool, common area taxes, maintenance (structure and grounds), management, pest control, sewer, trash, water, escrow reserves, fidelity bond; Association approval required; Community features include community mailbox, reclaimed water irrigation, pool, sidewalks, and street lights; Pets allowed (max 15 lbs)
Exterior
- Parking: No specific parking details provided
- Security: No specific security features listed
- Utilities: Public water; Public sewer; Electricity connected; Cable connected; High-speed internet available; Sewer connected; Water connected
- Home design: Residential condominium; Two-story building; Faces southwest; Unit on floor 1
- Construction: Block construction; Shingle roof; Slab foundation; Building/Unit identified as BLDG 6979, UNIT 6979
- Exterior features: Covered patio; Patio; Awnings; Exterior lighting; Sliding doors; Landscaped with trees; Paved road access
Interior
- Kitchen: Dishwasher; Range; Refrigerator
- Bedrooms: 2 bedrooms
- Flooring: Laminate flooring
- Bathrooms: 1 full bathroom; 1 half bathroom
- Heating & cooling: Central heating (electric); Central air conditioning
- Interior features: Ceiling fans; Open floorplan; Living room/dining room combo
- Laundry & utility: No laundry hook-ups in unit (none listed)
Neighborhood map
What this means for you Summary
Snapshot
- This is a 2-bed/1.5-bath condo listed at $126k.
Deal economics
- At list price, monthly cash flow is $363 ($4k/yr) — positive.
- The deal already cash-flows at list — no discount required.
- Meets the 1% rule at list price ($2k rent vs $126k).
- Cap rate 13.8% vs local median 0.7% in South Pasadena — top-decile yield for the area; either an underpriced asset or a hidden risk that comps aren't pricing in. Stress-test before assuming the spread holds.
Location & tenants
- Location reads 82/100 on livability (#77 in FL, #1,260 nationally) — a professional / high-income tenant draw. Strengths: commute A+, health & safety A+, cost of living A; Watch: schools D, amenities D, employment D-.
- Pinellas (suburban): math 51% / reading 51% proficiency, ranked #31 of 73 in FL (top 42%) — acceptable for families but not a draw, mixed tenant base, ~2y average lease.
- Market conditions: Rents soft (-0.6%/yr); 458 active listings in the ZIP; 40 comparable units currently listed for rent nearby; rentals at typical pace (median 25d on market — plan ~3-4 weeks tenant-placement turnaround); 2,676 units permitted in Pinellas County in 2024 (1,422 in 5+ unit buildings).
- This rent runs 38% of the median local income ($70k/yr) — at the standard rent-burdened threshold; future hikes will face affordability resistance.
Forward outlook
- Local home prices are declining (-3.0%/yr); year-one equity from $871 of loan paydown is wiped out by about $4k of value loss. Plan a longer hold.
- Pinellas County population projected at +14% by 2050 — modest demand growth; plan on rents tracking national, not racing it.
Negotiation context
- Only 1 days on market — expect competitive offers; lowballing is unlikely to land.
- 10 sale attempts since 7y ago with the ask held roughly flat each time — persistent listings suggest the price (not the market) is what's stuck; bring a comps-based counter.
Risks & watch-outs
- Watch-outs: flood insurance adds $427/mo.
- Climate carrying-cost: in FEMA flood zone AE (mandatory federal flood insurance); severe wind risk, 99% chance of damaging wind over 30y; extreme-heat days projected 7→26/yr by 2055 (HVAC capex compounding) — expect insurance premiums to compound above CPI over the hold.
Questions for the listing agent
- Built in 1968 — when were the roof, HVAC, electrical panel, plumbing, and water heater last replaced?
- What's the actual annual flood-insurance premium (NFIP or private), and is the property in a SFHA with mandatory coverage?
- Any open or pending special assessments — roof, HVAC, plumbing, elevator, façade? What's the per-unit balance and payoff schedule, and is the seller paying it off at close or rolling it to the buyer?
- Is there a deadline driving the sale (1031 exchange, divorce, estate, relocation)? That informs how much negotiation room exists.
- Schools are D-rated, which usually means shorter tenancies and higher turnover. Who's the typical renter profile here, and what's been the actual vacancy rate?
- What's the average days-on-market for RENTAL listings here right now (not sales)? A rising rental-DOM trend means longer vacancies and softer asking-rent achievability than the comps imply.
- What's the recent tenant-quality profile in this submarket — average credit score on applications, eviction rate, late-payment / NSF rate, and stable-employment percentage? A property-management company in the area should have these aggregated.
- How much new apartment / multifamily construction is in the pipeline within 1–3 miles? Heavy new supply (>2% of stock underway) typically softens rents 12–24 months out; light construction supports rent growth.
Investment metrics
- 1% rule
- 1.74% ✓
- Cap rate
- 13.82%
- Cash-on-cash
- 26.86%
- DSCR
- 2.20
- GRM
- 4.8
CMA / ARV
No comps found within radius.
Projected returns pro-forma
-3.0% appreciation · 0.0% rent growth · sell at horizon
- IRR
- -2.6%
- Equity multiple
- 0.90×
- Total profit
- $-3,357
- Equity at exit
- $18,787
- IRR
- 1.7%
- Equity multiple
- 1.10×
- Total profit
- $3,450
- Equity at exit
- $10,894
Cash invested: $35,280 (down + closing). Projections, not guarantees.
Landlord ↔ Tenant lean methodology
- Overall (STATE)
- 87 Strongly Landlord-Friendly
- State Florida
- 87 Strongly Landlord-Friendly · R+3
- County
- — inherits STATE
- City
- — inherits STATE
ZIP-level market 33707
- Rents YoY
- -0.6%
- Active inventory
- 458
- Price-to-rent
- 4.8×
Monthly cashflow live
- Estimated rent
- $2,189 high interval (Pro) →
- Mortgage (P&I)
- −$661
- Tax from tax record
- −$226 /mo · $2,713/yr
- Insurance
- −$52
- Flood insurance flood zone
- −$427 /mo · $5,118/yr
- HOA
- −$0
- Vacancy / Maint / Mgmt
- −$460
- Net cashflow
- $363
Break-even live
Sensitivity live
| Price | -10% $435 | -5% $399 | +0% $363 | +5% $328 | +10% $292 |
|---|---|---|---|---|---|
| Rent | -10% $190 | -5% $277 | +0% $363 | +5% $450 | +10% $536 |
| Rate | -1.0pp $427 | -0.5pp $395 | base $363 | +0.5pp $331 | +1.0pp $297 |
UW: 25.0% down · 7.5% · 30yr · 1.5% tax · 5.0% vac · 8.0% maint · 8.0% mgmt
Financing live
Cash to close
- Down payment
- $31,500
- Closing costs
- $3,780
- Reserves months
- —
- Total cash needed
- —
Loan-product check · same deal, 3 products live
Conventional
25% down · 7.5% · 30yr
- Down + closing
- —
- Monthly P&I
- —
- Monthly cashflow
- —
- DSCR
- —
- Eligible?
- —
Personal DTI + credit; lowest rate.
DSCR
20% down · 8.5% · 30yr
- Down + closing
- —
- Monthly P&I
- —
- Monthly cashflow
- —
- DSCR
- —
- Eligible?
- —
No personal income docs; deal must DSCR.
Hard money
10% down · 12.0% · 12mo
- Down + closing
- —
- Monthly P&I
- —
- Monthly cashflow
- —
- DSCR
- —
- Eligible?
- —
Short-term bridge; refi at stabilization.
Rent comps 40 comps
| Address | Beds | Baths | Sqft | Rent | $/sqft | DOM | Units | Dist |
|---|---|---|---|---|---|---|---|---|
| 7050 Sunset Dr S #716 South Pasadena, FL | 2.0 | 2.0 | 1180 | $2,250 | $1.91 | 25d | 1 | 0.03mi |
| 1130 Rue Des Chateaux South Pasadena, FL | 2.0 | 2.0 | 960 | $1,949 | $2.03 | 8d | 1 | 0.04mi |
| 1130 Rue Des Chateaux South Pasadena, FL | 2.0 | 2.0 | 960 | $1,949 | $2.03 | 11d | 1 | 0.04mi |
| 1140 Rue des Rois #1140 South Pasadena, FL | 2.0 | 1.5 | 1045 | $1,995 | $1.91 | 25d | 1 | 0.05mi |
| 6950 Avenue des Palais Unit 2A South Pasadena, FL | 1.0 | 1.0 | 720 | $1,650 | $2.29 | 22d | 1 | 0.05mi |
| 1153 Rue des Rois Unit 1B South Pasadena, FL | 2.0 | 2.0 | 960 | $2,200 | $2.29 | 25d | 1 | 0.06mi |
| 1195 Rue des Chateaux Unit 1B South Pasadena, FL | 1.0 | 1.0 | 720 | $1,850 | $2.57 | 4d | 1 | 0.07mi |
| 6931 Hibiscus Ave S Unit 3 South Pasadena, FL | 2.0 | 1.0 | 789 | $1,800 | $2.28 | 25d | 1 | 0.18mi |
| 7125 14th Ave S South Pasadena, FL | 2.0 | 2.0 | 1000 | $2,000 | $2.00 | 4d | 1 | 0.26mi |
| 1320 Pasadena Ave S #203 South Pasadena, FL | 2.0 | 2.0 | 1030 | $2,600 | $2.52 | 4d | 1 | 0.27mi |
| 1316 Pasadena Ave S #202 South Pasadena, FL | 2.0 | 2.0 | 1030 | $2,300 | $2.23 | 4d | 1 | 0.30mi |
| 1316 Pasadena Ave S #204 South Pasadena, FL | 1.0 | 1.5 | 875 | $1,900 | $2.17 | 4d | 1 | 0.30mi |
| 1324 Pasadena Ave S #205 South Pasadena, FL | 1.0 | 1.5 | 875 | $1,695 | $1.94 | 4d | 1 | 0.30mi |
| 1328 Pasadena Ave S #206 South Pasadena, FL | 2.0 | 2.0 | 1100 | $2,700 | $2.45 | 25d | 1 | 0.33mi |
| 6860 Park St S South Pasadena, FL | 2.0 | 2.0 | 1500 | $2,500 | $1.67 | 25d | 1 | 0.35mi |
| 1473 Durling Dr S South Pasadena, FL | 3.0 | 2.0 | 1264 | $4,000 | $3.16 | 25d | 1 | 0.37mi |
| 1750 Harbor Pl S South Pasadena, FL | 1.0 | 1.5 | 920 | $2,325 | $2.53 | 25d | 2 | 0.38mi |
| 7540 Bay Island Dr S South Pasadena, FL | 2.0 | 1.0–2.0 | 827 | $2,900 | $3.50 | 12d | 3 | 0.49mi |
| 7645 Sun Island Dr S #101 South Pasadena, FL | 2.0 | 2.0 | 1385 | $3,200 | $2.31 | 25d | 1 | 0.50mi |
| 904 67th St S Saint Petersburg, FL | 3.0 | 1.0 | 1169 | $2,750 | $2.35 | 14d | 1 | 0.51mi |
| 7625 Sun Island Dr S #107 South Pasadena, FL | 2.0 | 2.0 | 1045 | $2,100 | $2.01 | 25d | 1 | 0.53mi |
| 7625 Sun Island Dr S #108 South Pasadena, FL | 2.0 | 2.0 | 1170 | $3,000 | $2.56 | 25d | 1 | 0.53mi |
| 7405 Bay Island Dr S South Pasadena, FL | 2.0–3.0 | 2.0 | 1192 | $2,000 | $1.68 | 4d | 2 | 0.54mi |
| 6660 Date Palm Ave S Unit 1018211P St. Petersburg, FL | 3.0 | 2.0 | 1345 | $7,147 | $5.31 | 8d | 1 | 0.57mi |
| 7700 Sun Island Dr S #503 South Pasadena, FL | 2.0 | 2.0 | 1215 | $2,395 | $1.97 | 25d | 1 | 0.58mi |
| 7700 Sun Island Dr S #402 South Pasadena, FL | 1.0 | 1.5 | 900 | $2,000 | $2.22 | 25d | 1 | 0.58mi |
| 1824 Shore Dr S South Pasadena, FL | 1.0–2.0 | 1.0 | 669 | $3,000 | $4.48 | 4d | 1 | 0.59mi |
| 7300 Sun Island Dr S #905 South Pasadena, FL | 1.0 | 1.5 | 1120 | $2,300 | $2.05 | 25d | 1 | 0.60mi |
| 7910 Sun Island Dr S #101 South Pasadena, FL | 2.0 | 2.0 | 1170 | $2,500 | $2.14 | 25d | 1 | 0.60mi |
| 1846 Shore Dr S Unit 101 South Pasadena, FL | 1.0 | 1.0 | 747 | $1,900 | $2.54 | 25d | 1 | 0.65mi |
| 1846 Shore Dr S Unit 120 South Pasadena, FL | 2.0 | 1.0 | 860 | $3,000 | $3.49 | 25d | 1 | 0.65mi |
| 1846 Shore Dr S Unit 103 South Pasadena, FL | 1.0 | 1.0 | 740 | $2,200 | $2.97 | 25d | 1 | 0.65mi |
| 1848 Shore Dr S #402 South Pasadena, FL | 1.0 | 1.5 | 905 | $2,300 | $2.54 | 25d | 1 | 0.67mi |
| 7600 Sun Island Dr S #205 South Pasadena, FL | 2.0 | 2.0 | 1250 | $2,190 | $1.75 | 25d | 1 | 0.67mi |
| 7600 Sun Island Dr S South Pasadena, FL | 2.0 | 2.0 | 1400 | $2,350 | $1.68 | 4d | 1 | 0.67mi |
| 7400 Sun Island Dr S #503 South Pasadena, FL | 2.0 | 2.0 | 1230 | $2,750 | $2.24 | 25d | 1 | 0.68mi |
| 7400 Sun Island Dr S #505 South Pasadena, FL | 2.0 | 2.0 | 1325 | $2,000 | $1.51 | 25d | 1 | 0.68mi |
| 7400 Sun Island Dr S #311 South Pasadena, FL | 2.0 | 2.0 | 1300 | $2,600 | $2.00 | 25d | 1 | 0.68mi |
| 1868 Shore Dr S #102 South Pasadena, FL | 1.0 | 1.5 | 830 | $2,000 | $2.41 | 4d | 1 | 0.70mi |
| 1885 Shore Dr S South Pasadena, FL | 1.0–2.0 | 1.0–2.0 | 891 | $2,365 | $2.65 | 2d | 10 | 0.74mi |
HOA detail condo
- Monthly dues
- $0 · $0/yr
- Likely covers
- gaspool
- Assessments
- None detected in remarks — confirm with the listing agent.
Listing history 41 events
-
2026-05-07status Pending
-
2026-05-07$126,000 Active
-
2025-09-14historical
-
2025-09-13price $179,000
-
2025-09-11status Active
-
2025-07-29status Pending
-
2025-07-22price $199,000
-
2025-07-15price $210,000
-
2025-07-08$220,000 Active
-
2024-09-28historical
-
2024-08-14price $225,000
-
2024-07-03price $250,000
-
2024-06-06price $265,000
-
2024-05-22price $270,000
-
2024-05-08price $273,500
-
2024-04-30price $275,000
-
2024-04-10$279,000 Active
-
2024-03-15historical
-
2024-02-27price $295,000
-
2024-01-14$300,000 Active
-
2022-05-12soldstatus $275,000
-
2021-05-10soldstatus $181,500 Closed
-
2021-05-06soldstatus $181,500
-
2021-04-10status Pending
-
2021-04-05status Active
-
2021-03-30status Pending
-
2021-03-27$180,000 Active
-
2020-02-10soldstatus $127,000
-
2020-02-07soldstatus $127,000 Sold
-
2020-01-13status Pending
-
2020-01-10price $129,000
-
2019-12-09price $135,000
-
2019-11-06price $139,500
-
2019-07-25status Active
-
2019-07-24status Pending
-
2019-06-28status Active
-
2019-06-20status Pending
-
2019-05-29$144,900 Active
-
2003-06-18soldstatus $100,000
-
1989-04-27soldstatus $54,500
-
1983-08-01soldstatus $62,000
ⓘ Source: listings_history table (triggers on properties + properties_extension) + one-shot
backfill from property_details.listing_events for pre-trigger history.
Tax reassessment forecast FL · Resets to sale price
- Current annual tax
- $2,713 · $226/mo
- Projected year-2 tax
- $2,713 · $226/mo
- Expected delta
- $0/yr ($0/mo · 0.0%)
ⓘ Screening estimate from a state-policy table — verify with the county assessor before closing.
Climate risk First Street
- Flood 10/10 Extreme FEMA zone AE · 99% chance over 30 yrs
- Wildfire 1/10 Low
- Heat 10/10 Extreme 7 d/yr ≥106°F today · 26 d/yr by 30 yrs out
- Wind 10/10 Extreme 99% chance of damaging wind over 30 yrs
- Air quality 4/10 Moderate 4 unhealthy d/yr today · 4 by 30 yrs out
Nearby sold comps map
Loading sold comps map…
Walkable amenities ~0.75 mi
Loading nearby amenities…
Taxation est. · year 1
- Rental income
- $26,266
- − Mortgage interest
- −$7,058
- − Property taxes
- −$2,713
- − Insurance
- −$5,748
- − Repairs & maintenance
- −$2,101
- − Management
- −$2,101
- − Depreciation
- −$3,665
- Taxable income
- $2,878
- Est. tax owed @ 24.0%
- −$691
- After-tax cash flow
- $3,669/yr
For passive investors: Depreciation is non-cash, so a rental often shows a tax loss while cash-flowing — sheltering income. Rental losses are passive: they offset passive income freely, and up to $25,000/yr can offset ordinary (W-2) income if you actively participate and your MAGI is under $100k (phasing out to $0 by $150k); unused losses carry forward. On sale, claimed depreciation is recaptured at up to 25%, and gains may owe capital-gains tax (a 1031 exchange can defer both). Figures are a year-1 estimate at your 24.0% rate — not tax advice; consult a CPA.
Schools (NCES district)
- District
- Pinellas
- NCES district ID
- 1201560
- Math proficiency
- 51% ▼ -5.00%
- Reading proficiency
- 51% ▼ -3.00%
- Median HH income
- $46,270
- Composite
- 43.27/100
- National rank
- #3046
- State rank
- #31 of 73 in FL
Livability — South Pasadena
- Score
- 82/100
- State rank
- #77
- US rank
- #1260
Category grades
Schools grade is shown separately in the Schools card above.
Census & demographics
- Census place
- South Pasadena, FL
- County
- Pinellas County · 939,478 people
- Metro
- Tampa-St. Petersburg-Clearwater, FL
- Population (ZIP)
- 24,324
- Household income
- $69,951
- Rent vs Own
- Severe rent burden
- 1371.0
Population outlook (Pinellas County) Hauer SSP2
- Today (2025)
- 1,027,532 people
- By 2030
- 1,063,586 · +3.5%
- By 2040
- 1,125,020 · +9.5%
- By 2050
- 1,168,637 · +13.7%
- By 2075
- 1,265,188 · +23.1%
- By 2100
- 1,260,357 · +22.7%
Race, ethnicity, and origin ACS 2023
- Neighborhood character
- Predominantly White (81%)
- Race & ethnicity
- White 81% Two or more races 7% Hispanic / Latino 7% Black 6% Asian 2%
- Hispanic origin (detail)
- Mexican 2% Puerto Rican 1% Cuban 1%
- Common ancestry
- Romanian 5% Lithuanian 3% Slovak 3%
- Foreign-born
- 11% · Canada, Vietnam
- Languages at home
- 89% English-only · Spanish 5% Russian/Polish/Slavic 1% French/Haitian/Cajun 1%
Political lean MEDSL · Pinellas
- 2024 margin
- Lean R (+5.2) · D 46.9% · R 52.1%
- 2008→2024 swing
- -13.5pp toward R · 2008: 8.3pp · 2024: -5.2pp
- All cycles
- 2024: R+5.2 2020: D+0.2 2016: R+1.1 2012: D+5.6 2008: D+8.3
Not yet ingested
- Civics
- —
Market trends
- HPI YoY
- ▼ -555.96%
- Current HPI
- 359.4858
- Rent YoY
- ▼ -0.61%
- Metro
- Tampa-St. Petersburg-Clearwater, FL
- State GDP YoY
- ▲ 3.28%
- F500 in state
- 36
Industry mix (Fortune 500 HQ in FL)
| Industry | F500 HQs | Revenue |
|---|---|---|
| Industrial Technology | 2 | $29B |
|
||
| Insurance | 2 | $17B |
|
||
| Retail | 1 | $60B |
|
||
| Technology Distribution | 1 | $58B |
|
||
| Homebuilding | 1 | $35B |
|
||
| Technology Manufacturing | 1 | $35B |
|
||
Price history
+103.2% since first listed41 events — show timeline
- 2026-05-07 Pending — Stellar MLS as Distributed by MLS Grid
- 2026-05-07 Listed $126,000 Stellar MLS as Distributed by MLS Grid
- 2025-09-14 Listing Removed — Stellar MLS as Distributed by MLS Grid
- 2025-09-13 Price Changed $179,000 Stellar MLS as Distributed by MLS Grid
- 2025-09-11 Relisted — Stellar MLS as Distributed by MLS Grid
- 2025-07-29 Pending — Stellar MLS as Distributed by MLS Grid
- 2025-07-22 Price Changed $199,000 Stellar MLS as Distributed by MLS Grid
- 2025-07-15 Price Changed $210,000 Stellar MLS as Distributed by MLS Grid
- 2025-07-08 Listed $220,000 Stellar MLS as Distributed by MLS Grid
- 2024-09-28 Listing Removed — Stellar MLS as Distributed by MLS Grid
- 2024-08-14 Price Changed $225,000 Stellar MLS as Distributed by MLS Grid
- 2024-07-03 Price Changed $250,000 Stellar MLS as Distributed by MLS Grid
- 2024-06-06 Price Changed $265,000 Stellar MLS as Distributed by MLS Grid
- 2024-05-22 Price Changed $270,000 Stellar MLS as Distributed by MLS Grid
- 2024-05-08 Price Changed $273,500 Stellar MLS as Distributed by MLS Grid
- 2024-04-30 Price Changed $275,000 Stellar MLS as Distributed by MLS Grid
- 2024-04-10 Listed $279,000 Stellar MLS as Distributed by MLS Grid
- 2024-03-15 Listing Removed — Stellar MLS as Distributed by MLS Grid
- 2024-02-27 Price Changed $295,000 Stellar MLS as Distributed by MLS Grid
- 2024-01-14 Listed $300,000 Stellar MLS as Distributed by MLS Grid
- 2022-05-12 Sold (Public Records) $275,000 Public Records
- 2021-05-10 Sold (MLS) $181,500 Stellar MLS as Distributed by MLS Grid
- 2021-05-06 Sold (Public Records) $181,500 Public Records
- 2021-04-10 Pending — Stellar MLS as Distributed by MLS Grid
- 2021-04-05 Relisted — Stellar MLS as Distributed by MLS Grid
- 2021-03-30 Pending — Stellar MLS as Distributed by MLS Grid
- 2021-03-27 Listed $180,000 Stellar MLS as Distributed by MLS Grid
- 2020-02-10 Sold (Public Records) $127,000 Public Records
- 2020-02-07 Sold (MLS) $127,000 Stellar MLS as Distributed by MLS Grid
- 2020-01-13 Pending — Stellar MLS as Distributed by MLS Grid
- 2020-01-10 Price Changed $129,000 Stellar MLS as Distributed by MLS Grid
- 2019-12-09 Price Changed $135,000 Stellar MLS as Distributed by MLS Grid
- 2019-11-06 Price Changed $139,500 Stellar MLS as Distributed by MLS Grid
- 2019-07-25 Relisted — Stellar MLS as Distributed by MLS Grid
- 2019-07-24 Pending — Stellar MLS as Distributed by MLS Grid
- 2019-06-28 Relisted — Stellar MLS as Distributed by MLS Grid
- 2019-06-20 Pending — Stellar MLS as Distributed by MLS Grid
- 2019-05-29 Listed $144,900 Stellar MLS as Distributed by MLS Grid
- 2003-06-18 Sold (Public Records) $100,000 Public Records
- 1989-04-27 Sold (Public Records) $54,500 Public Records
- 1983-08-01 Sold (Public Records) $62,000 Public Records
Property tax history
+7.2%/yrLatest (2025): $2,713 · -38.7% YoY. Source: county tax records.
Cash-flow waterfall
monthlySold comps — $/sqft
last 12 mo · ≤1 miLoading sold comps…