267 Huntwell West Ave · Ranson, WV
Flood risk No data
- FEMA flood zone
- —
- Chance of flooding over 30 yrs
- —
- Est. flood insurance / yr
- —
Fire risk No data
- Est. fire insurance / yr
- —
Heat risk No data
- Hot days now (above threshold)
- —
- Hot days in 30 yrs
- —
Wind risk No data
- Chance of severe wind over 30 yrs
- —
Air-quality risk No data
- Unhealthy air days now
- —
- Unhealthy air days in 30 yrs
- —
Risk factors via First Street. Map © Google.
Why this score? — see what drove the D+ grade
The composite is a weighted blend of 9 inputs, each scored 0–100. Each bar is that input's sub-score; the figure is the points it added to the 100-point composite (weight × sub-score).
- ARV discount +14.2/15.0
- Appreciation +10.0/10.0
- Cash flow +7.1/30.0
- Schools +3.4/10.0
- Livability +3.3/5.0
- Rent growth +2.5/5.0
- Condition / age +2.5/5.0
- 1% rule +2.2/10.0
- DSCR +1.3/10.0
$335,999
🖨 Deal sheet (PDF) 📄 Offer letter ✓ Due diligence
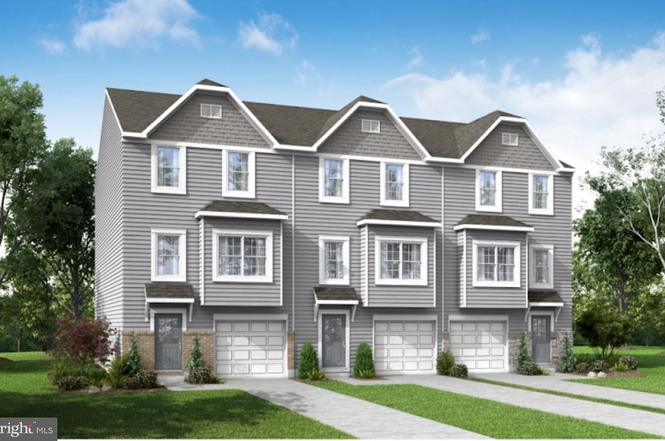
Listing remarks
🏡 54 Sumter Ave Model Home | June 2026 Delivery St. Peter ‘G’ – 4BR | 3.5BA | 1-Car Garage | Finished Lower Level🔥 Under Construction – Secure It Now Before Completion! The largest townhome floorplan in the Ranson & Charles Town area — offering up to 2,349 sq. ft. of modern living space. ✨ Home Highlights 🍽 Open-concept main level perfect for entertaining 🪨 Granite countertops + designer backsplash 🧰 Stainless steel appliances 🪵 Luxury vinyl plank flooring 🌅 Composite deck 🛏 4 Bedrooms 🛁 3.5 Bathrooms 🚗 1-Car Garage with opener + remotes 🛌 Upper Level Retreat 🚿 Deluxe Silver primary bath with rain shower 👕 Spacious walk-in closet 🧺 Bedroom-level laundry
Key facts
- $64 HOA
- Garage
- Built 2026
Property features AI
Finance
- Other: Pets allowed with no pet restrictions; Irrigation water rights; Model home / directions available for community location
- HOA & community: Monthly HOA fee of $65; HOA includes trash service; Community amenities include tot lots/playground
Exterior
- Parking: Attached garage with garage door opener (1-car)
- Utilities: Public water; Public sewer; Electric hot water; Cable, satellite, broadband internet available; Cable TV and phone service available
- Home design: Interior townhouse/rowhouse; Fee simple ownership; Excellent condition; Construction by Maronda Homes; Construction not completed (model/home community); Architectural shingle roof; No basement (slab foundation)
- Construction: Shake siding and stone exterior materials; Slab foundation; Energy-efficient windows
- Exterior features: Exterior lighting; Gutter system; Sidewalks; Not in a federal flood zone
Interior
- Kitchen: Built-in microwave; Microwave; Oven - Single (electric); Oven/Range - Electric; Dishwasher; Disposal; Refrigerator; Icemaker; Water dispenser; Stainless steel appliances; Energy-efficient appliances
- Bedrooms: Three bedrooms on the upper level
- Flooring: Luxury vinyl plank; Partially carpeted
- Bathrooms: Two full bathrooms on upper level; One half bathroom on main level
- Heating & cooling: Energy Star heating system (electric); Central A/C (electric)
- Interior features: Open floor plan with 9'+ ceilings; Combination kitchen/dining and kitchen/living areas; Family room off the kitchen; Kitchen island; Eat-in kitchen; Master bath; Walk-in shower and tub/shower combination; Walk-in closet(s); Ceiling fans; Upgraded countertops; Carpet in some areas
- Laundry & utility: Upper floor laundry with hookups
Neighborhood map
What this means for you Summary
Snapshot
- This is a 4-bed/3.5-bath townhouse listed at $336k.
Deal economics
- At list price, monthly cash flow is $-476 ($-6k/yr) — negative.
- To cash-flow at today's rent, offer at most $267k (20.5% below list).
- To meet the 1% rule (rent ≥ 1% of price), the offer needs to be $242k (28.1% below list).
- Recommended offer: $242k (28.1% below list) — sets the bar for 1% rule.
- Cap rate 4.6% vs local median 3.8% in Ranson — meaningfully above typical; check what's discounted (condition, days-on-market, listing class) to confirm the premium yield is real.
Location & tenants
- Location reads 66/100 on livability (#100 in WV) — a middle-class / working-renter tenant base. Strengths: crime A+, housing A+, cost of living A-; Watch: amenities F, commute F, health & safety F.
- Jefferson County Schools (rural): math 29% / reading 46% proficiency, ranked #6 of 55 in WV (top 11%) — families likely to look elsewhere, expect single-tenant / working-renter base with shorter leases.
- Zoned schools: T A Lowery Elementary School (math 27% / reading 37%, grade F, #191 of 377 statewide, top 56%, 522 students, 0% FRL); Wildwood Middle School (math 15% / reading 40%, grade F, #70 of 109 statewide, top 65%, 425 students, 0% FRL); Jefferson High School (math 30% / reading 62%, grade D-, #9 of 110 statewide, top 7%, 1,444 students, 0% FRL) — zoned schools average 0% FRL vs 33% district-wide (33 pts lower); this property's tenant base skews higher-income than the district average.
- Market conditions: 323 active listings in the ZIP; 10 comparable units currently listed for rent nearby; rentals at typical pace (median 15d on market — plan ~3-4 weeks tenant-placement turnaround); solid renter incomes; 1,162 units permitted in Jefferson County in 2024 (360 in 5+ unit buildings).
- This rent runs 35% of the median local income ($82k/yr) — at the standard rent-burdened threshold; future hikes will face affordability resistance.
Forward outlook
- In year one you build about $36k of equity ($2k loan paydown + $34k appreciation (10.0% local appreciation)).
- Jefferson County population projected at +13% by 2050 — modest demand growth; plan on rents tracking national, not racing it.
- By year 2, paydown + projected appreciation supports a ~$58k cash-out refi (75% LTV) — recoverable capital for the next deal without selling this one.
Negotiation context
- It's been on market 32 days — a 3% lower offer ($326k) is reasonable based on typical stale-listing flexibility.
- 2 sale attempts; this cycle's ask is 7% above the opening price — seller raised mid-cycle; expect resistance to lowballs.
Questions for the listing agent
- What do current leases actually rent for vs. the listed asking? Can we see a recent rent roll and the last 12 months of T-12 income?
- It's been on market 32 days. Have you received any prior offers? Is the seller open to a 28% concession, seller financing, or rate buy-down credit?
- What does the HOA fee cover, when was the last increase, and are there any pending special assessments or reserve-fund shortfalls?
- Is there a deadline driving the sale (1031 exchange, divorce, estate, relocation)? That informs how much negotiation room exists.
- Schools are F-rated, which usually means shorter tenancies and higher turnover. Who's the typical renter profile here, and what's been the actual vacancy rate?
- The area grade is low — what's the realistic commute time and amenity access for the typical tenant pool here? Any planned neighborhood developments (good or bad) we should know about?
- What's the average days-on-market for RENTAL listings here right now (not sales)? A rising rental-DOM trend means longer vacancies and softer asking-rent achievability than the comps imply.
- What's the recent tenant-quality profile in this submarket — average credit score on applications, eviction rate, late-payment / NSF rate, and stable-employment percentage? A property-management company in the area should have these aggregated.
- How much new for-sale + rental construction is in the pipeline within 1–3 miles? Heavy new supply typically softens prices + rents 12–24 months out; constrained supply supports both.
Investment metrics
- 1% rule
- 0.72% ✗
- Cap rate
- 4.59%
- Cash-on-cash
- -6.08%
- DSCR
- 0.73
- GRM
- 11.6
CMA / ARV
- ARV (on-the-fly)
- $394,632
- Comps found
- 2
Show comp detail 2 sales within ~0.75 mi
| Address | Dist | Beds/Ba | Sqft | Sold | Price | $/sf | Match |
|---|---|---|---|---|---|---|---|
| 144 Monroe Ave | 0.04mi | 4/3.5 | 2,000 (-15%) | 6mo | $335,704 | $168 | 68 |
| 128 Monroe Ave | 0.06mi | 4/3.5 | 2,000 (-15%) | 6mo | $324,990 | $162 | 68 |
Match score weights: distance 35% · size 25% · config 20% · recency 20%. Top-matched comps best support the ARV.
Projected returns pro-forma
10.0% appreciation · 3.0% rent growth · sell at horizon
- IRR
- 20.0%
- Equity multiple
- 2.62×
- Total profit
- $152,725
- Equity at exit
- $302,695
- IRR
- 18.3%
- Equity multiple
- 6.04×
- Total profit
- $473,765
- Equity at exit
- $652,772
Cash invested: $94,080 (down + closing). Projections, not guarantees.
Landlord ↔ Tenant lean methodology
- Overall (STATE)
- 83 Strongly Landlord-Friendly
- State West Virginia
- 83 Strongly Landlord-Friendly · R+22
- County
- — inherits STATE
- City
- — inherits STATE
ZIP-level market 25438
- Home prices YoY
- 10.3%
- Active inventory
- 323
- Price-to-rent
- 11.6×
Monthly cashflow live
- Estimated rent
- $2,417 high interval (Pro) →
- Mortgage (P&I)
- −$1,762
- Tax est. 1.5%
- −$420 /mo · $5,040/yr
- Insurance
- −$140
- HOA
- −$64
- Vacancy / Maint / Mgmt
- −$508
- Net cashflow
- $-476
Break-even live
Sensitivity live
| Price | -10% $-244 | -5% $-360 | +0% $-476 | +5% $-593 | +10% $-709 |
|---|---|---|---|---|---|
| Rent | -10% $-667 | -5% $-572 | +0% $-476 | +5% $-381 | +10% $-285 |
| Rate | -1.0pp $-307 | -0.5pp $-391 | base $-476 | +0.5pp $-563 | +1.0pp $-652 |
UW: 25.0% down · 7.5% · 30yr · 1.5% tax · 5.0% vac · 8.0% maint · 8.0% mgmt
Financing live
Cash to close
- Down payment
- $84,000
- Closing costs
- $10,080
- Reserves months
- —
- Total cash needed
- —
Loan-product check · same deal, 3 products live
Conventional
25% down · 7.5% · 30yr
- Down + closing
- —
- Monthly P&I
- —
- Monthly cashflow
- —
- DSCR
- —
- Eligible?
- —
Personal DTI + credit; lowest rate.
DSCR
20% down · 8.5% · 30yr
- Down + closing
- —
- Monthly P&I
- —
- Monthly cashflow
- —
- DSCR
- —
- Eligible?
- —
No personal income docs; deal must DSCR.
Hard money
10% down · 12.0% · 12mo
- Down + closing
- —
- Monthly P&I
- —
- Monthly cashflow
- —
- DSCR
- —
- Eligible?
- —
Short-term bridge; refi at stabilization.
Rent comps 10 comps
| Address | Beds | Baths | Sqft | Rent | $/sqft | DOM | Units | Dist |
|---|---|---|---|---|---|---|---|---|
| 406 Freeman St Ranson, WV | 3.0 | 2.5 | 1906 | $2,600 | $1.36 | 4d | 1 | 0.21mi |
| 405 17th Ave Ranson, WV | 3.0 | 2.5 | 1725 | $2,150 | $1.25 | 7d | 1 | 0.63mi |
| 1344 Red Clover Ln Ranson, WV | 3.0 | 2.5 | 1723 | $2,099 | $1.22 | 14d | 1 | 0.66mi |
| 452 18th Ave Ranson, WV | 3.0 | 2.5 | 1726 | $1,895 | $1.10 | 0d | 1 | 0.68mi |
| 1130 Stallion St Ranson, WV | 3.0 | 2.5 | 1648 | $1,900 | $1.15 | 7d | 1 | 0.83mi |
| 1247 Mare St Ranson, WV | 3.0 | 2.5 | 1985 | $2,080 | $1.05 | 26d | 1 | 0.95mi |
| 112 Cecily Way Unit 112 Ranson, WV | 3.0 | 4.0 | 1905 | $2,100 | $1.10 | 7d | 1 | 1.36mi |
| 300 Presidents Pointe Ave Ranson, WV | 3.0 | 2.5 | 1731 | $2,200 | $1.27 | 20d | 1 | 1.37mi |
| 51 Cecily Way Ranson, WV | 3.0 | 2.5 | 1998 | $2,000 | $1.00 | 14d | 1 | 1.42mi |
| 37 Cecily Way Ranson, WV | 3.0 | 2.5 | 2540 | $2,100 | $0.83 | 26d | 1 | 1.43mi |
HOA detail
- Monthly dues
- $64 · $768/yr
Listing history 3 events
-
2026-04-23$314,990 Active
-
2026-04-04status Pending
-
2026-03-03$335,999 Active
ⓘ Source: listings_history table (triggers on properties + properties_extension) + one-shot
backfill from property_details.listing_events for pre-trigger history.
Nearby sold comps map
Loading sold comps map…
Walkable amenities ~0.75 mi
Loading nearby amenities…
Taxation est. · year 1
- Rental income
- $29,006
- − Mortgage interest
- −$18,821
- − Property taxes
- −$5,040
- − Insurance
- −$1,680
- − Repairs & maintenance
- −$2,321
- − Management
- −$2,321
- − HOA
- −$768
- − Depreciation
- −$9,775
- Taxable loss
- −$11,718
- Est. tax savings @ 24.0%
- +$2,812
- After-tax cash flow
- $-2,905/yr
For passive investors: Depreciation is non-cash, so a rental often shows a tax loss while cash-flowing — sheltering income. Rental losses are passive: they offset passive income freely, and up to $25,000/yr can offset ordinary (W-2) income if you actively participate and your MAGI is under $100k (phasing out to $0 by $150k); unused losses carry forward. On sale, claimed depreciation is recaptured at up to 25%, and gains may owe capital-gains tax (a 1031 exchange can defer both). Figures are a year-1 estimate at your 24.0% rate — not tax advice; consult a CPA.
Schools (NCES district)
- District
- Jefferson County Schools
- NCES district ID
- 5400570
- Math proficiency
- 29% ▼ -13.00%
- Reading proficiency
- 46% ▼ -7.00%
- Median HH income
- $67,038
- Composite
- 33.98/100
- National rank
- #5322
- State rank
- #6 of 55 in WV
Livability — Ranson
- Score
- 66/100
- State rank
- #100
- US rank
- #11255
Category grades
Schools grade is shown separately in the Schools card above.
Census & demographics
- Census place
- Ranson, WV
- County
- Jefferson County · 28,403 people
- City population
- 7,330
- Metro
- Washington-Arlington-Alexandria, DC-VA-MD-WV
- Population (ZIP)
- 7,330
- Household income
- $81,875
- Rent vs Own
- Severe rent burden
- 90.0
Population outlook (Jefferson County) Hauer SSP2
- Today (2025)
- 61,715 people
- By 2030
- 64,052 · +3.8%
- By 2040
- 67,713 · +9.7%
- By 2050
- 69,843 · +13.2%
- By 2075
- 72,679 · +17.8%
- By 2100
- 71,872 · +16.5%
Race, ethnicity, and origin ACS 2023
- Neighborhood character
- Predominantly White (72%)
- Race & ethnicity
- White 72% Hispanic / Latino 14% Two or more races 7% Black 7% Asian 3%
- Hispanic origin (detail)
- Mexican 3% Puerto Rican 4%
- Common ancestry
- Serbian 4% Italian 2% Romanian 2%
- Foreign-born
- 7% · Canada, Philippines
- Languages at home
- 87% English-only · Spanish 9% Other Asian/Pacific 3%
Political lean MEDSL · Jefferson
- 2024 margin
- R (+15.8) · D 41.0% · R 56.8% · Other 2.1%
- 2008→2024 swing
- -20.6pp toward R · 2008: 4.8pp · 2024: -15.8pp
- All cycles
- 2024: R+15.8 2020: R+10.5 2016: R+15.3 2012: R+4.0 2008: D+4.8
Not yet ingested
- Civics
- —
Market trends
- HPI YoY
- ▲ 32.87%
- Current HPI
- 352.707
- Rent YoY
- —
- Metro
- Washington-Arlington-Alexandria, DC-VA-MD-WV
- State GDP YoY
- —
- F500 in state
- 0
Price history
-6.3% since first listed3 events — show timeline
- 2026-04-23 Listed $314,990 BRIGHT MLS
- 2026-04-04 Pending — BRIGHT MLS
- 2026-03-03 Listed $335,999 BRIGHT MLS
Cash-flow waterfall
monthlySold comps — $/sqft
last 12 mo · ≤1 miLoading sold comps…