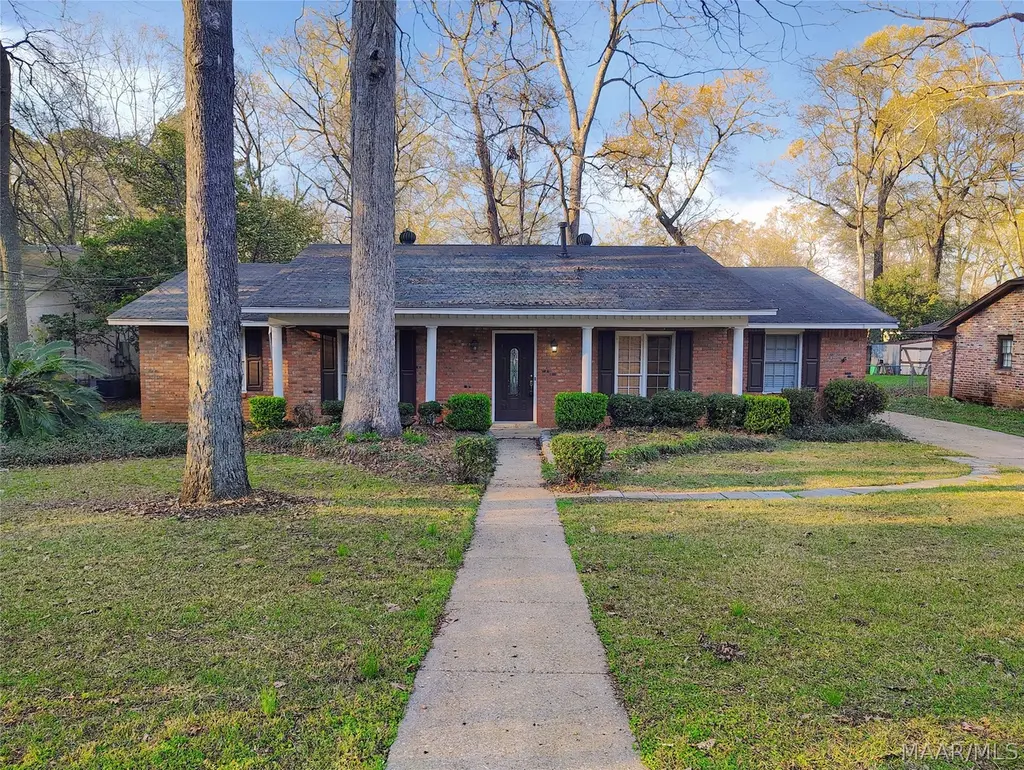
458 Bowling Green Dr · Montgomery, AL
Flood risk 4/10 · Minor
- FEMA flood zone
- X (unshaded)
- Chance of flooding over 30 yrs
- 0.22%
- Est. flood insurance / yr
- $507 – $1,088
Fire risk 1/10 · Minimal
- Est. fire insurance / yr
- $916 – $1,700
Heat risk 7/10 · Major
- Hot days now (above 107°F)
- 7 days/yr
- Hot days in 30 yrs
- 19 days/yr
Wind risk 8/10 · Major
- Chance of severe wind over 30 yrs
- 80.0%
Air-quality risk 4/10 · Minor
- Unhealthy air days now
- 4 days/yr
- Unhealthy air days in 30 yrs
- 5 days/yr
Risk factors via First Street. Map © Google.
Why this score? — see what drove the C- grade
The composite is a weighted blend of 9 inputs, each scored 0–100. Each bar is that input's sub-score; the figure is the points it added to the 100-point composite (weight × sub-score).
- Cash flow +21.7/30.0
- ARV discount +9.9/15.0
- DSCR +6.9/10.0
- 1% rule +4.5/10.0
- Rent growth +3.2/5.0
- Livability +3.2/5.0
- Condition / age +2.5/5.0
- Schools +1.7/10.0
- Appreciation +0.0/10.0
$164,900
🖨 Deal sheet 📄 Offer letter ✓ Due diligence
Listing remarks MLS
Welcome home to this charming 4-bedroom, 2-bath brick residence featuring an inviting eat-in kitchen, perfect for family meals and casual gatherings. Enjoy a nice-sized great room ideal for relaxing or entertaining, along with a separate dining room for more formal occasions. This home offers a comfortable layout, great features, and desirable amenities designed for everyday living. A wonderful opportunity to enjoy space, style, and convenience all in one place! Hurry, Hurry This Property Won't Last Long! Property is sold in as is condition no warranty express or implied.
Key facts
- Separate dining room
- Eat-in kitchen
- Great room
Tags
Neighborhood map
What this means for you Summary
Snapshot
- This is a 4-bed/2.0-bath single-family listed at $165k.
Deal economics
- At list price, monthly cash flow is $252 ($3k/yr) — positive.
- The deal already cash-flows at list — no discount required.
- To meet the 1% rule (rent ≥ 1% of price), the offer needs to be $157k (4.7% below list).
- Recommended offer: $150k (9.0% below list) — sets the bar for market timing.
- Cap rate 8.1% vs local median 6.0% in Montgomery — top-decile yield for the area; either an underpriced asset or a hidden risk that comps aren't pricing in. Stress-test before assuming the spread holds.
Location & tenants
- Location reads 65/100 on livability (#138 in AL) — a middle-class / working-renter tenant base. Strengths: cost of living A+, housing A+; Watch: schools C-, employment D, crime F.
- Montgomery County (urban): math 9% / reading 31% proficiency, ranked #106 of 129 in AL (top 82%) — low school quality limits family demand, transient renter base, plan for 1-2y turnover; 70% free/reduced lunch — lower-income household profile, screen leases tightly.
- Market conditions: Rents rising (+2.6%/yr); 207 active listings in the ZIP; 25 comparable units currently listed for rent nearby; rentals at typical pace (median 21d on market — plan ~3-4 weeks tenant-placement turnaround); 48% of comp listings sitting > 30 days — soft ceiling on asking rent; 460 units permitted in Montgomery County in 2024 (37 in 5+ unit buildings).
- This rent runs 32% of the median local income ($59k/yr) — at the standard rent-burdened threshold; future hikes will face affordability resistance.
Forward outlook
- Local home prices are declining (-3.0%/yr); year-one equity from $1k of loan paydown is wiped out by about $5k of value loss. Plan a longer hold.
- Montgomery County population projected to shrink 8% by 2050 — rents likely to lag national; underwrite the cash flow, not the appreciation.
Negotiation context
- It's been on market 95 days — a 9% lower offer ($150k) is reasonable based on typical stale-listing flexibility.
- 3 sale attempts since 21y ago; this cycle's ask has dropped $15k (8%) from the opening price — seller is motivated, your offer sets the floor, not the list.
- Current owner paid $116k; 42% above their basis — modest negotiation headroom, anchor on the comps not their cost.
Risks & watch-outs
- Climate carrying-cost: severe wind risk, 80% chance of damaging wind over 30y; extreme-heat days projected 7→19/yr by 2055 (HVAC capex compounding) — expect insurance premiums to compound above CPI over the hold.
Questions for the listing agent
- It's been on market 95 days. Have you received any prior offers? Is the seller open to a 9% concession, seller financing, or rate buy-down credit?
- Built in 1975 — when were the roof, HVAC, electrical panel, plumbing, and water heater last replaced?
- Why hasn't it sold? Are there any deal-killer items the seller is aware of (foundation, flood, title, zoning, code violations)?
- Is there a deadline driving the sale (1031 exchange, divorce, estate, relocation)? That informs how much negotiation room exists.
- Crime grade is F in this area — have there been break-ins, vandalism, or insurance claims at this property in the last 3 years? What carrier currently insures it and at what premium?
- What's the average days-on-market for RENTAL listings here right now (not sales)? A rising rental-DOM trend means longer vacancies and softer asking-rent achievability than the comps imply.
- What's the recent tenant-quality profile in this submarket — average credit score on applications, eviction rate, late-payment / NSF rate, and stable-employment percentage? A property-management company in the area should have these aggregated.
- How much new for-sale + rental construction is in the pipeline within 1–3 miles? Heavy new supply typically softens prices + rents 12–24 months out; constrained supply supports both.
Investment metrics
- 1% rule
- 0.95% ✗
- Cap rate
- 8.13%
- Cash-on-cash
- 6.55%
- DSCR
- 1.29
- GRM
- 8.7
CMA / ARV
- ARV (median comp)
- $174,088
- List price
- $164,900
- Delta
- -5.28%
- Verdict
- FAIR
- Comps
- 20 within 1.0 mi
Show comp detail 12 sales within ~0.75 mi
| Address | Dist | Beds/Ba | Sqft | Sold | Price | $/sf | Match |
|---|---|---|---|---|---|---|---|
| 701 Ledyard Pl | 0.25mi | 4/2.0 | 1,782 (+2%) | 3mo | $239,000 | $134 | 83 |
| 4121 Johnstown Dr | 0.29mi | 4/2.0 | 1,835 (+5%) | 2mo | $260,000 | $142 | 77 |
| 737 Ledyard Pl | 0.36mi | 3/2.0 (-1) | 1,752 (+0%) | 2mo | $217,000 | $124 | 76 |
| 4208 Johnstown Dr | 0.11mi | 3/2.0 (-1) | 1,604 (-8%) | 3mo | $204,900 | $128 | 74 |
| 233 Vanderbilt Loop W | 0.46mi | 3/2.0 (-1) | 1,775 (+2%) | 0mo | $190,000 | $107 | 71 |
| 4309 Salinas Ct | 0.37mi | 4/2.0 | 1,610 (-8%) | 2mo | $179,900 | $112 | 68 |
| 725 Mary Ann Dr | 0.65mi | 3/2.0 (-1) | 1,760 (+1%) | 0mo | $225,000 | $128 | 63 |
| 708 Maryethel Dr | 0.54mi | 4/2.0 | 1,616 (-8%) | 1mo | $178,000 | $110 | 61 |
| 4041 Meredith Dr | 0.35mi | 3/2.0 (-1) | 1,969 (+13%) | 1mo | $237,000 | $120 | 57 |
| 3974 Johnstown Dr | 0.54mi | 3/2.0 (-1) | 1,605 (-8%) | 2mo | $160,000 | $100 | 55 |
| 706 Mary Ann Dr | 0.62mi | 3/2.0 (-1) | 1,877 (+7%) | 0mo | $242,000 | $129 | 54 |
| 718 Mary Ann Dr | 0.64mi | 3/2.0 (-1) | 1,890 (+8%) | 2mo | $240,000 | $127 | 50 |
Match score weights: distance 35% · size 25% · config 20% · recency 20%. Top-matched comps best support the ARV.
Projected returns pro-forma
-3.0% appreciation · 2.65% rent growth · sell at horizon
- IRR
- -6.6%
- Equity multiple
- 0.76×
- Total profit
- $-11,288
- Equity at exit
- $24,587
- IRR
- 2.6%
- Equity multiple
- 1.18×
- Total profit
- $8,315
- Equity at exit
- $14,258
Cash invested: $46,172 (down + closing). Projections, not guarantees.
Landlord ↔ Tenant lean methodology
- Overall (STATE)
- 90 Strongly Landlord-Friendly
- State Alabama
- 90 Strongly Landlord-Friendly · R+15
- County
- — inherits STATE
- City
- — inherits STATE
ZIP-level market 36109
- Home prices YoY
- -20.1%
- Rents YoY
- 2.6%
- Active inventory
- 207
- Price-to-rent
- 8.7×
Monthly cashflow live
- Estimated rent
- $1,572 high interval (Pro) →
- Mortgage (P&I)
- −$865
- Tax from tax record
- −$56 /mo · $673/yr
- Insurance
- −$69
- HOA
- −$0
- Vacancy / Maint / Mgmt
- −$330
- Net cashflow
- $252
Break-even live
UW: 25.0% down · 7.5% · 30yr · 1.5% tax · 5.0% vac · 8.0% maint · 8.0% mgmt
Financing live
Cash to close
- Down payment
- $41,225
- Closing costs
- $4,947
- Reserves months
- —
- Total cash needed
- —
Loan-product check · same deal, 3 products live
Conventional
25% down · 7.5% · 30yr
- Down + closing
- —
- Monthly P&I
- —
- Monthly cashflow
- —
- DSCR
- —
- Eligible?
- —
Personal DTI + credit; lowest rate.
DSCR
20% down · 8.5% · 30yr
- Down + closing
- —
- Monthly P&I
- —
- Monthly cashflow
- —
- DSCR
- —
- Eligible?
- —
No personal income docs; deal must DSCR.
Hard money
10% down · 12.0% · 12mo
- Down + closing
- —
- Monthly P&I
- —
- Monthly cashflow
- —
- DSCR
- —
- Eligible?
- —
Short-term bridge; refi at stabilization.
Rent comps 25 comps
| Address | Beds | Baths | Sqft | Rent | $/sqft | DOM | Units | Dist |
|---|---|---|---|---|---|---|---|---|
| 4536 Wake Forest Dr Montgomery, AL | 3.0 | 2.0 | 1244 | $1,250 | $1.00 | 43d | 1 | 0.34mi |
| 3944 Johnstown Dr Montgomery, AL | 3.0 | 2.0 | 1912 | $1,275 | $0.67 | 43d | 1 | 0.60mi |
| 4056 Wares Ferry Rd Montgomery, AL | 3.0 | 2.0 | 1800 | $1,500 | $0.83 | 13d | 1 | 0.67mi |
| 4046 Camellia Dr Unit 1 Montgomery, AL | 3.0 | 2.0 | 1500 | $1,200 | $0.80 | 43d | 1 | 0.73mi |
| 564 Glade Park Loop Unit 1043856P Montgomery, AL | 4.0 | 2.0 | 1496 | $2,736 | $1.83 | 13d | 1 | 0.83mi |
| 3760 Dalraida Pkwy Montgomery, AL | 4.0 | 2.5 | 1900 | $1,850 | $0.97 | 43d | 1 | 0.99mi |
| 3806 Marie Cook Dr Montgomery, AL | 3.0 | 2.0 | 1791 | $1,675 | $0.94 | 13d | 1 | 0.99mi |
| 605 Plantation Way Montgomery, AL | 4.0 | 2.0 | 1519 | $1,200 | $0.79 | 20d | 1 | 1.00mi |
| 107 Dalraida Rd Unit A Montgomery, AL | 3.0 | 2.0 | 1237 | $1,200 | $0.97 | 43d | 1 | 1.01mi |
| 633 Groveland Dr Montgomery, AL | 3.0 | 2.0 | 1424 | $1,200 | $0.84 | 43d | 1 | 1.03mi |
| 3737 Dalraida Pkwy Montgomery, AL | 3.0 | 1.0 | 1618 | $1,150 | $0.71 | 43d | 1 | 1.08mi |
| 3801 Cedar Ave Montgomery, AL | 3.0 | 2.0 | 1818 | $1,681 | $0.92 | 20d | 1 | 1.09mi |
| 516 Lawndale Ln Montgomery, AL | 3.0 | 1.0 | 1125 | $1,150 | $1.02 | 43d | 1 | 1.12mi |
| 535 Lawndale Ln Montgomery, AL | 4.0 | 1.5 | 1260 | $1,100 | $0.87 | 13d | 1 | 1.14mi |
| 610 S Georgetown Dr Unit 1386555P Montgomery, AL | 3.0 | 1.0 | 1474 | $3,635 | $2.47 | 13d | 1 | 1.16mi |
| 1201 Dalraida Rd Montgomery, AL | 3.0 | 2.0 | 1673 | $1,625 | $0.97 | 43d | 1 | 1.23mi |
| 3692 Fairfield Dr Montgomery, AL | 3.0 | 2.0 | 1524 | $1,400 | $0.92 | 20d | 1 | 1.24mi |
| 560 Farmington Rd Montgomery, AL | 4.0 | 2.0 | 2161 | $1,695 | $0.78 | 13d | 1 | 1.28mi |
| 572 Farmington Rd Montgomery, AL | 3.0 | 2.0 | 2106 | $1,495 | $0.71 | 43d | 1 | 1.31mi |
| 3614 Princess Ann St Montgomery, AL | 4.0 | 2.0 | 1928 | $1,581 | $0.82 | 13d | 1 | 1.32mi |
| 804 Hillman St Montgomery, AL | 3.0 | 2.0 | 1370 | $1,295 | $0.95 | 13d | 1 | 1.33mi |
| 804 Hillman St Montgomery, AL | 3.0 | 2.0 | 1356 | $1,295 | $0.96 | 20d | 1 | 1.33mi |
| 336 Davors Dr Montgomery, AL | 3.0 | 2.0 | 1569 | $2,200 | $1.40 | 43d | 1 | 1.40mi |
| 3462 Biltmore Ave Montgomery, AL | 3.0 | 2.0 | 1685 | $1,225 | $0.73 | 20d | 1 | 1.41mi |
| 118 Nottingham Ct Montgomery, AL | 3.0 | 2.0 | 1344 | $1,275 | $0.95 | 43d | 1 | 1.41mi |
Listing history 13 events
-
2026-06-09days on market $164,900 Active 95 DOM
-
2026-06-08days on market $164,900 Active 94 DOM
-
2026-06-07days on market $164,900 Active 93 DOM
-
2026-06-03days on market $164,900 Active 90 DOM
-
2026-06-02days on market $164,900 Active 89 DOM
-
2026-06-01days on market $164,900 Active 88 DOM
-
2026-05-31days on market $164,900 Active 87 DOM
-
2026-05-30days on market $164,900 Active 86 DOM
-
2026-04-21price $169,900 578-char remark
Show marketing remark (578 chars)
Welcome home to this charming 4-bedroom, 2-bath brick residence featuring an inviting eat-in kitchen, perfect for family meals and casual gatherings. Enjoy a nice-sized great room ideal for relaxing or entertaining, along with a separate dining room for more formal occasions. This home offers a comfortable layout, great features, and desirable amenities designed for everyday living. A wonderful opportunity to enjoy space, style, and convenience all in one place! Hurry, Hurry This Property Won't Last Long! Property is sold in as is condition no warranty express or implied.
-
2026-03-05$179,900 Active 578-char remark
Show marketing remark (578 chars)
Welcome home to this charming 4-bedroom, 2-bath brick residence featuring an inviting eat-in kitchen, perfect for family meals and casual gatherings. Enjoy a nice-sized great room ideal for relaxing or entertaining, along with a separate dining room for more formal occasions. This home offers a comfortable layout, great features, and desirable amenities designed for everyday living. A wonderful opportunity to enjoy space, style, and convenience all in one place! Hurry, Hurry This Property Won't Last Long! Property is sold in as is condition no warranty express or implied.
-
2012-11-06$119,900
-
2006-04-11soldstatus $116,050
-
2005-08-15$122,000
ⓘ Source: listings_history table (triggers on properties + properties_extension) + one-shot
backfill from property_details.listing_events for pre-trigger history.
Tax reassessment forecast AL · Resets to sale price
- Current annual tax
- $673 · $56/mo
- Projected year-2 tax
- $676 · $56/mo
- Expected delta
- +$3/yr ($0/mo · 0.5%)
ⓘ Screening estimate from a state-policy table — verify with the county assessor before closing.
Climate risk First Street
- Flood 4/10 Moderate FEMA zone X (unshaded) · 22% chance over 30 yrs
- Wildfire 1/10 Low
- Heat 7/10 Severe 7 d/yr ≥107°F today · 19 d/yr by 30 yrs out
- Wind 8/10 Severe 80% chance of damaging wind over 30 yrs
- Air quality 4/10 Moderate 4 unhealthy d/yr today · 5 by 30 yrs out
Nearby sold comps map
Loading sold comps map…
Walkable amenities ~0.75 mi
Loading nearby amenities…
Taxation est. · year 1
- Rental income
- $18,859
- − Mortgage interest
- −$9,237
- − Property taxes
- −$673
- − Insurance
- −$824
- − Repairs & maintenance
- −$1,509
- − Management
- −$1,509
- − Depreciation
- −$4,797
- Taxable income
- $310
- Est. tax owed @ 24.0%
- −$75
- After-tax cash flow
- $2,950/yr
For passive investors: Depreciation is non-cash, so a rental often shows a tax loss while cash-flowing — sheltering income. Rental losses are passive: they offset passive income freely, and up to $25,000/yr can offset ordinary (W-2) income if you actively participate and your MAGI is under $100k (phasing out to $0 by $150k); unused losses carry forward. On sale, claimed depreciation is recaptured at up to 25%, and gains may owe capital-gains tax (a 1031 exchange can defer both). Figures are a year-1 estimate at your 24.0% rate — not tax advice; consult a CPA.
Schools (NCES district)
- District
- Montgomery County
- NCES district ID
- 0102430
- Math proficiency
- 9% ▼ -21.00%
- Reading proficiency
- 31% ▼ -1.00%
- Median HH income
- $43,902
- Composite
- 17.24/100
- National rank
- #9093
- State rank
- #106 of 129 in AL
Livability — Montgomery
- Score
- 65/100
- State rank
- #138
- US rank
- #13416
Category grades
Schools grade is shown separately in the Schools card above.
Census & demographics
- Census place
- Montgomery, AL
- County
- Montgomery County · 190,016 people
- City population
- 175,913
- Metro
- Montgomery, AL
- Population (ZIP)
- 23,581
- Household income
- $59,193
- Rent vs Own
- Severe rent burden
- 1039.0
Population outlook (Montgomery County) Hauer SSP2
- Today (2025)
- 224,008 people
- By 2030
- 221,460 · -1.1%
- By 2040
- 214,179 · -4.4%
- By 2050
- 204,912 · -8.5%
- By 2075
- 177,821 · -20.6%
- By 2100
- 145,134 · -35.2%
Race, ethnicity, and origin ACS 2023
- Neighborhood character
- Diverse neighborhood (Simpson 0.60)
- Race & ethnicity
- White 49% Black 39% Hispanic / Latino 8% Two or more races 4%
- Hispanic origin (detail)
- Mexican 4%
- Common ancestry
- Slovak 2% Lithuanian 1% Serbian 1%
- Foreign-born
- 4% · Canada, South Korea
- Languages at home
- 94% English-only · Spanish 5%
Political lean MEDSL · Montgomery
- 2024 margin
- Solid D (+30.7) · D 64.8% · R 34.1% · Other 1.1%
- 2008→2024 swing
- +11.5pp toward D · 2008: 19.2pp · 2024: 30.7pp
- All cycles
- 2024: D+30.7 2020: D+31.5 2016: D+26.2 2012: D+24.3 2008: D+19.2
Not yet ingested
- Civics
- —
Market trends
- HPI YoY
- ▼ -37.64%
- Current HPI
- 149.3867
- Rent YoY
- ▲ 2.65%
- Metro
- Montgomery, AL
- State GDP YoY
- ▲ 2.94%
- F500 in state
- 4
Industry mix (Fortune 500 HQ in AL)
| Industry | F500 HQs | Revenue |
|---|---|---|
| Financial Services | 1 | $8B |
|
||
| Healthcare | 1 | $5B |
|
||
Price history
+39.3% since first listed5 events — show timeline
- 2026-04-21 Price Changed $169,900 MAAR
- 2026-03-05 Listed $179,900 MAAR
- 2012-11-06 Listed $119,900 MAAR
- 2006-04-11 Sold (Public Records) $116,050 Public Records
- 2005-08-15 Listed $122,000 MAAR
Property tax history
+5.2%/yrLatest (2025): $673 · +3.0% YoY. Source: county tax records.
Cash-flow waterfall
monthlySold comps — $/sqft
last 12 mo · ≤1 miLoading sold comps…