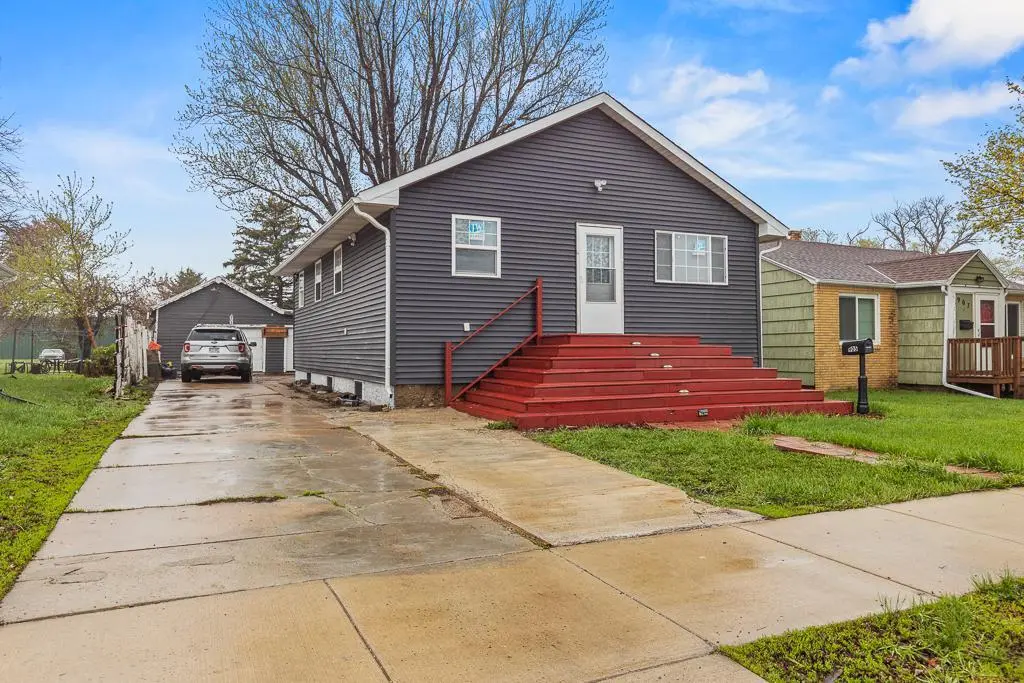
905 W Main St · Marshall, MN
Flood risk 1/10 · Minimal
- FEMA flood zone
- X (unshaded)
- Chance of flooding over 30 yrs
- 0.0%
- Est. flood insurance / yr
- $473 – $860
Fire risk 1/10 · Minimal
- Est. fire insurance / yr
- $888 – $1,650
Heat risk 2/10 · Minimal
- Hot days now (above 98°F)
- 7 days/yr
- Hot days in 30 yrs
- 14 days/yr
Wind risk 2/10 · Minimal
- Chance of severe wind over 30 yrs
- —
Air-quality risk 1/10 · Minimal
- Unhealthy air days now
- 0 days/yr
- Unhealthy air days in 30 yrs
- 0 days/yr
Risk factors via First Street. Map © Google.
Why this score? — see what drove the D+ grade
The composite is a weighted blend of 9 inputs, each scored 0–100. Each bar is that input's sub-score; the figure is the points it added to the 100-point composite (weight × sub-score).
- Cash flow +18.0/30.0
- ARV discount +7.5/15.0
- DSCR +5.6/10.0
- 1% rule +4.1/10.0
- Livability +4.1/5.0
- Schools +4.0/10.0
- Rent growth +2.5/5.0
- Condition / age +2.5/5.0
- Appreciation +0.0/10.0
$165,000
🖨 Deal sheet 📄 Offer letter ✓ Due diligence
Listing remarks
Welcome to easy, modern living on West Main Street—where convenience meets comfort at the edge of town. Built in 2022, this thoughtfully designed single-story home offers 4 bedrooms and 2 bathrooms, with a layout that just makes sense for everyday life. Step inside to find functional living spaces that flow effortlessly, creating the perfect balance of openness and coziness. Three bedrooms are ideally situated on the main floor, including a private primary suite complete with its own ¾ bathroom—your own quiet retreat at the end of the day. Whether you're hosting friends, spending a quiet night in, or simply enjoying the ease of newer construction, this home is designed to
Key facts
- 0.31 acre lot
- 2 garage spots
- Built 2022
Property features AI
Exterior
- Parking: 2-car detached garage (24 x 28, concrete floor)
- Utilities: City water connected; City sewer connected; Natural gas service; Electric with circuit breakers and 200+ amp service
- Home design: Residential property; One story; Main entry level is the main floor
- Construction: Frame construction; Asphalt roof (age 8 years or less); Full concrete basement, partially finished
- Exterior features: Vinyl exterior; Partial chain link fencing; Public maintained city street with curbs, paved streets and sidewalks
Interior
- Kitchen: Kitchen with center island; Eat-in kitchen / kitchen-dining combination; Kitchen window
- Bedrooms: 4 bedrooms total (three on the main level; one on the lower level)
- Bathrooms: 1 full bathroom on the main floor; 1 three-quarter bathroom
- Heating & cooling: Forced air heating; No central air
- Interior features: Main floor primary bedroom; 3 bedrooms on one level; Has electric fireplace
- Laundry & utility: Washer/dryer hookup on main level; Main level laundry
Neighborhood map
What this means for you Summary
Snapshot
- This is a 4-bed/2.0-bath single-family listed at $165k.
Deal economics
- At list price, monthly cash flow is $142 ($2k/yr) — positive.
- The deal already cash-flows at list — no discount required.
- To meet the 1% rule (rent ≥ 1% of price), the offer needs to be $151k (8.7% below list).
- Recommended offer: $151k (8.7% below list) — sets the bar for 1% rule.
- Cap rate 7.3% vs local median 4.2% in Marshall — top-decile yield for the area; either an underpriced asset or a hidden risk that comps aren't pricing in. Stress-test before assuming the spread holds.
Location & tenants
- Location reads 82/100 on livability (#47 in MN, #1,265 nationally) — a professional / high-income tenant draw. Strengths: cost of living A+, housing A+, health & safety A+; Watch: amenities C-, employment C-, commute F.
- Marshall Public School District (town): math 46% / reading 48% proficiency, ranked #163 of 301 in MN (top 54%) — families likely to look elsewhere, expect single-tenant / working-renter base with shorter leases.
- Market conditions: 212 active listings in the ZIP; 91 units permitted in Lyon County in 2024 (72 in 5+ unit buildings).
Forward outlook
- Local home prices are declining (-3.0%/yr); year-one equity from $1k of loan paydown is wiped out by about $5k of value loss. Plan a longer hold.
- Lyon County population projected at -12% by 2050 — secular population decline; favor cash flow + early exit over multi-decade hold.
Negotiation context
- It's been on market 49 days — a 3% lower offer ($160k) is reasonable based on typical stale-listing flexibility.
- 8 sale attempts since 14y ago with the ask held roughly flat each time — persistent listings suggest the price (not the market) is what's stuck; bring a comps-based counter.
Questions for the listing agent
- It's been on market 49 days. Have you received any prior offers? Is the seller open to a 9% concession, seller financing, or rate buy-down credit?
- Is there a deadline driving the sale (1031 exchange, divorce, estate, relocation)? That informs how much negotiation room exists.
- Schools are A-rated — typically a magnet for longer-tenancy family renters. What's the average tenant stay here, and is there a school-zone premium baked into asking?
- The area grade is low — what's the realistic commute time and amenity access for the typical tenant pool here? Any planned neighborhood developments (good or bad) we should know about?
- What's the average days-on-market for RENTAL listings here right now (not sales)? A rising rental-DOM trend means longer vacancies and softer asking-rent achievability than the comps imply.
- What's the recent tenant-quality profile in this submarket — average credit score on applications, eviction rate, late-payment / NSF rate, and stable-employment percentage? A property-management company in the area should have these aggregated.
- How much new for-sale + rental construction is in the pipeline within 1–3 miles? Heavy new supply typically softens prices + rents 12–24 months out; constrained supply supports both.
Investment metrics
- 1% rule
- 0.91% ✗
- Cap rate
- 7.32%
- Cash-on-cash
- 3.69%
- DSCR
- 1.16
- GRM
- 9.1
CMA / ARV
- ARV (median comp)
- $108,000
- List price
- $165,000
- Delta
- 52.78%
- Verdict
- OVERPRICED
- Comps
- 1 within 2.0 mi
Projected returns pro-forma
-3.0% appreciation · 3.0% rent growth · sell at horizon
- IRR
- -10.5%
- Equity multiple
- 0.62×
- Total profit
- $-17,735
- Equity at exit
- $24,602
- IRR
- -1.2%
- Equity multiple
- 0.91×
- Total profit
- $-3,945
- Equity at exit
- $14,266
Cash invested: $46,200 (down + closing). Projections, not guarantees.
Landlord ↔ Tenant lean methodology
- Overall (STATE)
- 46 Balanced
- State Minnesota
- 46 Balanced · D+2
- County
- — inherits STATE
- City
- — inherits STATE
ZIP-level market 56258
- Home prices YoY
- -33.1%
- Active inventory
- 212
- Price-to-rent
- 9.1×
Monthly cashflow live
- Estimated rent
- $1,507 medium interval (Pro) →
- Mortgage (P&I)
- −$865
- Tax from tax record
- −$114 /mo · $1,372/yr
- Insurance
- −$69
- HOA
- −$0
- Vacancy / Maint / Mgmt
- −$316
- Net cashflow
- $142
Break-even live
UW: 25.0% down · 7.5% · 30yr · 1.5% tax · 5.0% vac · 8.0% maint · 8.0% mgmt
Financing live
Cash to close
- Down payment
- $41,250
- Closing costs
- $4,950
- Reserves months
- —
- Total cash needed
- —
Loan-product check · same deal, 3 products live
Conventional
25% down · 7.5% · 30yr
- Down + closing
- —
- Monthly P&I
- —
- Monthly cashflow
- —
- DSCR
- —
- Eligible?
- —
Personal DTI + credit; lowest rate.
DSCR
20% down · 8.5% · 30yr
- Down + closing
- —
- Monthly P&I
- —
- Monthly cashflow
- —
- DSCR
- —
- Eligible?
- —
No personal income docs; deal must DSCR.
Hard money
10% down · 12.0% · 12mo
- Down + closing
- —
- Monthly P&I
- —
- Monthly cashflow
- —
- DSCR
- —
- Eligible?
- —
Short-term bridge; refi at stabilization.
Listing history 30 events
-
2026-06-17days on market $165,000 Active 49 DOM
-
2026-06-16days on market $165,000 Active 48 DOM
-
2026-06-15days on market $165,000 Active 47 DOM
-
2026-06-14days on market $165,000 Active 45 DOM
-
2026-06-12days on market $165,000 Active 44 DOM
-
2026-06-09days on market $165,000 Active 41 DOM
-
2026-06-08days on market $165,000 Active 40 DOM
-
2026-06-07days on market $165,000 Active 39 DOM
-
2026-06-07days on market $165,000 Active 38 DOM
-
2026-06-04days on market $165,000 Active 35 DOM
-
2026-06-02days on market $165,000 Active 34 DOM
-
2026-06-01days on market $165,000 Active 33 DOM
-
2026-05-31days on market $165,000 Active 32 DOM
-
2026-05-31days on market $165,000 Active 31 DOM
-
2026-04-29$165,000 Active 1023-char remark
-
2025-10-04historical
-
2025-08-18price $169,900
-
2025-06-17$174,900 Active
-
2019-04-23historical
-
2019-04-15historical Contingent - Inspection
-
2019-03-20price $84,000
-
2019-03-13status Active
-
2019-02-04$87,000
-
2019-02-02historical
-
2019-02-02historical
-
2019-02-02historical
-
2013-03-08$49,900
-
2013-03-08$49,900
-
2012-01-09$49,900
-
2012-01-09$49,900
ⓘ Source: listings_history table (triggers on properties + properties_extension) + one-shot
backfill from property_details.listing_events for pre-trigger history.
Tax reassessment forecast MN · Partial reset (capped growth)
- Current annual tax
- $1,372 · $114/mo
- Projected year-2 tax
- $1,610 · $134/mo
- Expected delta
- +$238/yr (+$20/mo · 17.3%)
ⓘ Screening estimate from a state-policy table — verify with the county assessor before closing.
Climate risk First Street
- Flood 1/10 Low FEMA zone X (unshaded) · 0% chance over 30 yrs
- Wildfire 1/10 Low
- Heat 2/10 Low 7 d/yr ≥98°F today · 14 d/yr by 30 yrs out
- Wind 2/10 Low
- Air quality 1/10 Low 0 unhealthy d/yr today · 0 by 30 yrs out
Nearby sold comps map
Loading sold comps map…
Walkable amenities ~0.75 mi
Loading nearby amenities…
Taxation est. · year 1
- Rental income
- $18,080
- − Mortgage interest
- −$9,243
- − Property taxes
- −$1,372
- − Insurance
- −$825
- − Repairs & maintenance
- −$1,446
- − Management
- −$1,446
- − Depreciation
- −$4,800
- Taxable loss
- −$1,053
- Est. tax savings @ 24.0%
- +$253
- After-tax cash flow
- $1,955/yr
For passive investors: Depreciation is non-cash, so a rental often shows a tax loss while cash-flowing — sheltering income. Rental losses are passive: they offset passive income freely, and up to $25,000/yr can offset ordinary (W-2) income if you actively participate and your MAGI is under $100k (phasing out to $0 by $150k); unused losses carry forward. On sale, claimed depreciation is recaptured at up to 25%, and gains may owe capital-gains tax (a 1031 exchange can defer both). Figures are a year-1 estimate at your 24.0% rate — not tax advice; consult a CPA.
Schools (NCES district)
- District
- Marshall Public School District
- NCES district ID
- 2718940
- Math proficiency
- 46% ▼ -13.00%
- Reading proficiency
- 48% ▼ -11.00%
- Median HH income
- $47,798
- Composite
- 40.09/100
- National rank
- #3807
- State rank
- #163 of 301 in MN
Livability — Marshall
- Score
- 82/100
- State rank
- #47
- US rank
- #1265
Category grades
Schools grade is shown separately in the Schools card above.
Census & demographics
- Census place
- Marshall, MN
- County
- Lyon County · 15,888 people
- City population
- 15,888
- Metro
- Marshall, MN
- Population (ZIP)
- 15,888
- Household income
- $72,731
- Rent vs Own
- Severe rent burden
- 483.0
Population outlook (Lyon County) Hauer SSP2
- Today (2025)
- 25,369 people
- By 2030
- 24,890 · -1.9%
- By 2040
- 23,599 · -7.0%
- By 2050
- 22,383 · -11.8%
- By 2075
- 20,076 · -20.9%
- By 2100
- 18,901 · -25.5%
Race, ethnicity, and origin ACS 2023
- Neighborhood character
- Predominantly White (79%)
- Race & ethnicity
- White 79% Hispanic / Latino 7% Asian 6% Black 4% Two or more races 4%
- Hispanic origin (detail)
- Mexican 5%
- Common ancestry
- Portuguese 14% English 6% Lithuanian 6%
- Foreign-born
- 8% · Canada, Philippines
- Languages at home
- 88% English-only · Spanish 6% Other Asian/Pacific 4% Other Indo-European 1%
Political lean MEDSL · Lyon
- 2024 margin
- Solid R (+31.8) · D 33.1% · R 64.9% · Other 2.0%
- 2008→2024 swing
- -30.2pp toward R · 2008: -1.6pp · 2024: -31.8pp
- All cycles
- 2024: R+31.8 2020: R+25.9 2016: R+28.3 2012: R+9.2 2008: R+1.6
Not yet ingested
- Civics
- —
Market trends
- HPI YoY
- ▼ -87.90%
- Current HPI
- 177.471
- Rent YoY
- —
- Metro
- Marshall, MN
- State GDP YoY
- ▲ 2.41%
- F500 in state
- 34
Industry mix (Fortune 500 HQ in MN)
| Industry | F500 HQs | Revenue |
|---|---|---|
| Healthcare | 2 | $407B |
|
||
| Retail | 2 | $150B |
|
||
| Consumer Goods | 2 | $32B |
|
||
| Industrial Machinery | 2 | $6B |
|
||
| Agriculture | 1 | $40B |
|
||
| Healthcare / Medical Devices | 1 | $32B |
|
||
Price history
+230.7% since first listed17 events — show timeline
- 2026-06-17 Listing Removed — NORTHSTARMLS as Distributed by MLS Grid
- 2026-04-29 Listed $165,000 NORTHSTARMLS as Distributed by MLS Grid
- 2025-10-04 Listing Removed — NORTHSTARMLS as Distributed by MLS Grid
- 2025-08-18 Price Changed $169,900 NORTHSTARMLS as Distributed by MLS Grid
- 2025-06-17 Listed $174,900 NORTHSTARMLS as Distributed by MLS Grid
- 2019-04-23 Listing Removed — NORTHSTARMLS as Distributed by MLS Grid
- 2019-04-15 Contingent — NORTHSTARMLS as Distributed by MLS Grid
- 2019-03-20 Price Changed $84,000 NORTHSTARMLS as Distributed by MLS Grid
- 2019-03-13 Relisted — NORTHSTARMLS as Distributed by MLS Grid
- 2019-02-04 Listed $87,000 NORTHSTARMLS as Distributed by MLS Grid
- 2019-02-02 Listing Removed — NORTHSTARMLS as Distributed by MLS Grid
- 2019-02-02 Listing Removed — NORTHSTARMLS as Distributed by MLS Grid
- 2019-02-02 Listing Removed — NORTHSTARMLS as Distributed by MLS Grid
- 2013-03-08 Listed $49,900 NORTHSTARMLS as Distributed by MLS Grid
- 2013-03-08 Listed $49,900 NORTHSTARMLS as Distributed by MLS Grid
- 2012-01-09 Listed $49,900 NORTHSTARMLS as Distributed by MLS Grid
- 2012-01-09 Listed $49,900 NORTHSTARMLS as Distributed by MLS Grid
Property tax history
-3.3%/yrLatest (2026): $1,372 · +5.5% YoY. Source: county tax records.
Cash-flow waterfall
monthlySold comps — $/sqft
last 12 mo · ≤1 miLoading sold comps…