168 Bonner St · Hartford, CT
Flood risk 4/10 · Minor
- FEMA flood zone
- X (unshaded)
- Chance of flooding over 30 yrs
- 0.24%
- Est. flood insurance / yr
- $473 – $860
Fire risk 1/10 · Minimal
- Est. fire insurance / yr
- $829 – $1,539
Heat risk 5/10 · Moderate
- Hot days now (above 97°F)
- 7 days/yr
- Hot days in 30 yrs
- 16 days/yr
Wind risk 6/10 · Moderate
- Chance of severe wind over 30 yrs
- 27.0%
Air-quality risk 3/10 · Minor
- Unhealthy air days now
- 3 days/yr
- Unhealthy air days in 30 yrs
- 4 days/yr
Risk factors via First Street. Map © Google.
Why this score? — see what drove the B grade
The composite is a weighted blend of 9 inputs, each scored 0–100. Each bar is that input's sub-score; the figure is the points it added to the 100-point composite (weight × sub-score).
- Cash flow +26.4/30.0
- ARV discount +15.0/15.0
- DSCR +9.0/10.0
- 1% rule +6.4/10.0
- Appreciation +5.7/10.0
- Livability +3.8/5.0
- Rent growth +3.1/5.0
- Condition / age +2.5/5.0
- Schools +1.4/10.0
$174,999
🖨 Deal sheet 📄 Offer letter ✓ Due diligence
Listing remarks MLS
Great investment property, rowhouse. Good sized rooms with basement area. Wood floor, lots of potential.
Key facts
- Brand new boiler
- Full attic
- 1,306 sq ft lot
Tags
Property features AI
Finance
- Financial info: Assessed value reported (public record)
Exterior
- Parking: Paved off-street parking; 1 parking space
- Utilities: Public water connected; Public sewer connected; Electric hot water
- Home design: Single-family home
- Construction: Brick construction; Block foundation; Asphalt shingle roof; Built living area reported as 850
- Exterior features: Interior lot
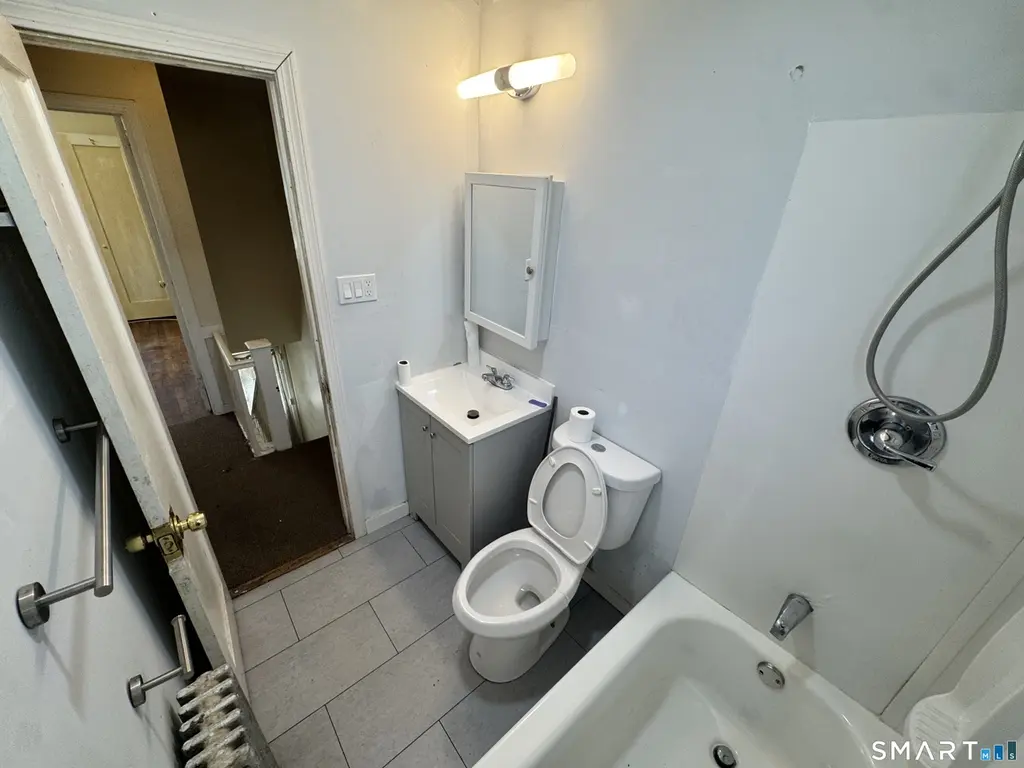
Interior
- Kitchen: Oven/Range; Refrigerator
- Bedrooms: 2 bedrooms
- Bathrooms: 1 full bathroom
- Heating & cooling: Hot water/steam heating; Natural gas fuel
- Interior features: 5 total rooms; Full basement; Attic with access via hatch
- Laundry & utility: 40-gallon electric hot water tank
Neighborhood map
What this means for you Summary
Snapshot
- This is a 2-bed/1.0-bath single-family listed at $175k.
Deal economics
- At list price, monthly cash flow is $456 ($5k/yr) — positive.
- The deal already cash-flows at list — no discount required.
- Meets the 1% rule at list price ($2k rent vs $175k).
- Recommended offer: $170k (3.0% below list) — sets the bar for market timing.
Location & tenants
- Location reads 76/100 on livability (#58 in CT, #3,553 nationally) — a middle-class / working-renter tenant base. Strengths: amenities A+, commute A+, health & safety A+; Watch: schools D-, crime F, employment F.
- Hartford School District (urban): math 13% / reading 21% proficiency, ranked #150 of 153 in CT (top 98%) — low school quality limits family demand, transient renter base, plan for 1-2y turnover; 84% free/reduced lunch — lower-income household profile, screen leases tightly.
- Market conditions: Rents rising (+2.4%/yr); 62 active listings in the ZIP; 14 comparable units currently listed for rent nearby; rentals at typical pace (median 24d on market — plan ~3-4 weeks tenant-placement turnaround); 1,867 units permitted in Capitol Planning Region in 2024 (1,399 in 5+ unit buildings).
- At $1,996/mo this rent would consume 52% of the median local household income ($46k/yr) (locally 3400% of renters already pay >50% of income on rent) — very limited rent-growth headroom before tenants either downsize or default.
Forward outlook
- In year one you build about $4k of equity ($1k loan paydown + $2k appreciation (1.4% local appreciation)).
- At projected returns (1.4% appreciation + 2.4% rent growth), your $49k cash investment doubles in ~5 years — after that, you're playing with house money.
- By year 9, paydown + projected appreciation supports a ~$32k cash-out refi (75% LTV) — recoverable capital for the next deal without selling this one.
Negotiation context
- It's been on market 34 days — a 3% lower offer ($170k) is reasonable based on typical stale-listing flexibility.
- 5 sale attempts since 22y ago with the ask held roughly flat each time — persistent listings suggest the price (not the market) is what's stuck; bring a comps-based counter.
- Current owner paid $63k; list at $175k implies a 178% gain — meaningful room to come down on a strong offer.
Risks & watch-outs
- Watch-outs: built in 1944 — expect roof / HVAC / electrical / plumbing capex.
- Climate carrying-cost: major wind risk, 27% chance of damaging wind over 30y; extreme-heat days projected 7→16/yr by 2055 (HVAC capex compounding) — expect insurance premiums to compound above CPI over the hold.
Questions for the listing agent
- It's been on market 34 days. Have you received any prior offers? Is the seller open to a 3% concession, seller financing, or rate buy-down credit?
- Built in 1944 — when were the roof, HVAC, electrical panel, plumbing, and water heater last replaced?
- Is there a deadline driving the sale (1031 exchange, divorce, estate, relocation)? That informs how much negotiation room exists.
- Schools are D-rated, which usually means shorter tenancies and higher turnover. Who's the typical renter profile here, and what's been the actual vacancy rate?
- Crime grade is F in this area — have there been break-ins, vandalism, or insurance claims at this property in the last 3 years? What carrier currently insures it and at what premium?
- What's the average days-on-market for RENTAL listings here right now (not sales)? A rising rental-DOM trend means longer vacancies and softer asking-rent achievability than the comps imply.
- What's the recent tenant-quality profile in this submarket — average credit score on applications, eviction rate, late-payment / NSF rate, and stable-employment percentage? A property-management company in the area should have these aggregated.
- How much new for-sale + rental construction is in the pipeline within 1–3 miles? Heavy new supply typically softens prices + rents 12–24 months out; constrained supply supports both.
Investment metrics
- 1% rule
- 1.14% ✓
- Cap rate
- 9.42%
- Cash-on-cash
- 11.16%
- DSCR
- 1.50
- GRM
- 7.3
CMA / ARV
- ARV (median comp)
- $321,195
- List price
- $174,999
- Delta
- -45.52%
- Verdict
- UNDERPRICED
- Comps
- 20 within 2.0 mi
Projected returns pro-forma
1.38% appreciation · 2.37% rent growth · sell at horizon
- IRR
- 13.5%
- Equity multiple
- 1.70×
- Total profit
- $34,249
- Equity at exit
- $63,185
- IRR
- 16.3%
- Equity multiple
- 3.02×
- Total profit
- $98,912
- Equity at exit
- $86,696
Cash invested: $49,000 (down + closing). Projections, not guarantees.
Landlord ↔ Tenant lean methodology
- Overall (STATE)
- 27 Tenant-Leaning
- State Connecticut
- 27 Tenant-Leaning · D+7
- County
- — inherits STATE
- City
- — inherits STATE
ZIP-level market 06106
- Home prices YoY
- 0.4%
- Rents YoY
- 2.4%
- Active inventory
- 62
- Price-to-rent
- 7.3×
Monthly cashflow live
- Estimated rent
- $1,996 high interval (Pro) →
- Mortgage (P&I)
- −$918
- Tax from tax record
- −$130 /mo · $1,563/yr
- Insurance
- −$73
- HOA
- −$0
- Vacancy / Maint / Mgmt
- −$419
- Net cashflow
- $456
Break-even live
UW: 25.0% down · 7.5% · 30yr · 1.5% tax · 5.0% vac · 8.0% maint · 8.0% mgmt
Financing live
Cash to close
- Down payment
- $43,750
- Closing costs
- $5,250
- Reserves months
- —
- Total cash needed
- —
Loan-product check · same deal, 3 products live
Conventional
25% down · 7.5% · 30yr
- Down + closing
- —
- Monthly P&I
- —
- Monthly cashflow
- —
- DSCR
- —
- Eligible?
- —
Personal DTI + credit; lowest rate.
DSCR
20% down · 8.5% · 30yr
- Down + closing
- —
- Monthly P&I
- —
- Monthly cashflow
- —
- DSCR
- —
- Eligible?
- —
No personal income docs; deal must DSCR.
Hard money
10% down · 12.0% · 12mo
- Down + closing
- —
- Monthly P&I
- —
- Monthly cashflow
- —
- DSCR
- —
- Eligible?
- —
Short-term bridge; refi at stabilization.
Rent comps 14 comps
| Address | Beds | Baths | Sqft | Rent | $/sqft | DOM | Units | Dist |
|---|---|---|---|---|---|---|---|---|
| 43 Caya Ave West Hartford, CT | 1.0–2.0 | 1.0 | 775 | $1,859 | $2.40 | 11d | 6 | 0.81mi |
| 1 Park Rd West Hartford, CT | 2.0 | 1.0–2.0 | 913 | $3,647 | $3.99 | 3d | 18 | 0.90mi |
| 90 Kane St Unit A4 West Hartford, CT | 1.0 | 1.0 | 750 | $1,600 | $2.13 | 43d | 1 | 0.91mi |
| 109 Caya Ave West Hartford, CT | 2.0 | 1.5 | 1078 | $2,600 | $2.41 | 3d | 1 | 0.94mi |
| 106 Kane St West Hartford, CT | 1.0–2.0 | 1.0–2.0 | 966 | $2,300 | $2.38 | 3d | 18 | 0.96mi |
| 140 Kane St Unit C1 West Hartford, CT | 2.0 | 2.0 | 1062 | $1,900 | $1.79 | 3d | 1 | 0.99mi |
| 136 Kane St Unit C5 West Hartford, CT | 1.0 | 1.0 | 750 | $1,700 | $2.27 | 16d | 1 | 1.03mi |
| 102 Oakwood Ave West Hartford, CT | 1.0 | 1.0 | 772 | $1,500 | $1.94 | 43d | 1 | 1.06mi |
| 29 Crosby St West Hartford, CT | 2.0 | 1.0 | 1100 | $1,950 | $1.77 | 43d | 1 | 1.09mi |
| 167 Seymour St Hartford, CT | 3.0–4.0 | 1.0 | 1000 | $2,025 | $2.02 | 23d | 3 | 1.22mi |
| 158 Seymour St Hartford, CT | 3.0 | 1.0 | 1114 | $2,025 | $1.82 | 23d | 2 | 1.23mi |
| 57 Park St Hartford, CT | 3.0 | 1.0 | 915 | $1,900 | $2.08 | 1d | 2 | 1.41mi |
| 387 Quaker Ln S West Hartford, CT | 2.0 | 1.0 | 1050 | $2,400 | $2.29 | 43d | 1 | 1.43mi |
| 711 Farmington Ave West Hartford, CT | 1.0–2.0 | 1.0–1.5 | 975 | $1,950 | $2.00 | 23d | 4 | 1.47mi |
Listing history 28 events
-
2026-06-18days on market $174,999 Active 34 DOM
-
2026-06-17days on market $174,999 Active 33 DOM
-
2026-06-16days on market $174,999 Active 32 DOM
-
2026-06-15days on market $174,999 Active 31 DOM
-
2026-06-13days on market $174,999 Active 29 DOM
-
2026-06-13days on market $174,999 Active 28 DOM
-
2026-06-10days on market $174,999 Active 26 DOM
-
2026-06-09days on market $174,999 Active 25 DOM
-
2026-06-08days on market $174,999 Active 24 DOM
-
2026-06-07days on market $174,999 Active 23 DOM
-
2026-06-05days on market $174,999 Active 20 DOM
-
2026-06-03days on market $174,999 Active 19 DOM
-
2026-06-02days on market $174,999 Active 18 DOM
-
2026-06-01days on market $174,999 Active 17 DOM
-
2026-05-31days on market $174,999 Active 16 DOM
-
2026-05-14$174,999 Active 1474-char remark
-
2022-06-01price $75,000
-
2022-05-31historical
-
2022-03-21$100,000 Active
-
2020-08-28soldstatus $63,000
-
2019-11-27soldstatus $35,000
-
2008-04-21soldstatus $51,000
Show marketing remark (104 chars)
Great investment property, rowhouse. Good sized rooms with basement area. Wood floor, lots of potential.
-
2008-03-16$55,900
Show marketing remark (104 chars)
Great investment property, rowhouse. Good sized rooms with basement area. Wood floor, lots of potential.
-
2007-09-10historical
-
2007-03-10$80,000
-
2005-01-18soldstatus $68,000
-
2005-01-13soldstatus $63,000
-
2004-06-16$68,900
ⓘ Source: listings_history table (triggers on properties + properties_extension) + one-shot
backfill from property_details.listing_events for pre-trigger history.
Tax reassessment forecast CT · Partial reset (capped growth)
- Current annual tax
- $1,563 · $130/mo
- Projected year-2 tax
- $2,654 · $221/mo
- Expected delta
- +$1,091/yr (+$91/mo · 69.8%)
ⓘ Screening estimate from a state-policy table — verify with the county assessor before closing.
Climate risk First Street
- Flood 4/10 Moderate FEMA zone X (unshaded) · 24% chance over 30 yrs
- Wildfire 1/10 Low
- Heat 5/10 Major 7 d/yr ≥97°F today · 16 d/yr by 30 yrs out
- Wind 6/10 Major 27% chance of damaging wind over 30 yrs
- Air quality 3/10 Moderate 3 unhealthy d/yr today · 4 by 30 yrs out
Nearby sold comps map
Loading sold comps map…
Walkable amenities ~0.75 mi
Loading nearby amenities…
Taxation est. · year 1
- Rental income
- $23,948
- − Mortgage interest
- −$9,803
- − Property taxes
- −$1,563
- − Insurance
- −$875
- − Repairs & maintenance
- −$1,916
- − Management
- −$1,916
- − Depreciation
- −$5,091
- Taxable income
- $2,784
- Est. tax owed @ 24.0%
- −$668
- After-tax cash flow
- $4,800/yr
For passive investors: Depreciation is non-cash, so a rental often shows a tax loss while cash-flowing — sheltering income. Rental losses are passive: they offset passive income freely, and up to $25,000/yr can offset ordinary (W-2) income if you actively participate and your MAGI is under $100k (phasing out to $0 by $150k); unused losses carry forward. On sale, claimed depreciation is recaptured at up to 25%, and gains may owe capital-gains tax (a 1031 exchange can defer both). Figures are a year-1 estimate at your 24.0% rate — not tax advice; consult a CPA.
Schools (NCES district)
- District
- Hartford School District
- NCES district ID
- 0901920
- Math proficiency
- 13% ▼ -5.00%
- Reading proficiency
- 21% ▼ -6.00%
- Median HH income
- $30,521
- Composite
- 13.54/100
- National rank
- #9514
- State rank
- #150 of 153 in CT
Livability — Hartford
- Score
- 76/100
- State rank
- #58
- US rank
- #3553
Category grades
Schools grade is shown separately in the Schools card above.
Census & demographics
- Census place
- Hartford, CT
- County
- Hartford County · 754,208 people
- City population
- 121,162
- Metro
- Hartford-East Hartford-Middletown, CT
- Population (ZIP)
- 36,322
- Household income
- $46,304
- Rent vs Own
- Severe rent burden
- 3400.0
Population outlook (Capitol County) Hauer SSP2
- By 2040
- 1,063,519
Race, ethnicity, and origin ACS 2023
- Neighborhood character
- Diverse neighborhood (Simpson 0.58)
- Race & ethnicity
- Hispanic / Latino 60% Two or more races 25% Black 18% White 15% Asian 3%
- Hispanic origin (detail)
- Mexican 2% Puerto Rican 42% Dominican 6%
- Common ancestry
- Lithuanian 2% Russian 1% Romanian 1%
- Foreign-born
- 20% · Canada, Jamaica, China
- Languages at home
- 46% English-only · Spanish 47% Other Indo-European 3% Other Asian/Pacific 1%
Political lean MEDSL · Capitol
- 2024 margin
- Strong D (+21.9) · D 60.1% · R 38.2% · Other 1.7%
- All cycles
- 2024: D+21.9
Not yet ingested
- Civics
- —
Market trends
- HPI YoY
- ▲ 1.38%
- Current HPI
- 314.0899
- Rent YoY
- ▲ 2.37%
- Metro
- Hartford-East Hartford-Middletown, CT
- State GDP YoY
- ▲ 1.06%
- F500 in state
- 38
Industry mix (Fortune 500 HQ in CT)
| Industry | F500 HQs | Revenue |
|---|---|---|
| Industrial Machinery | 4 | $38B |
|
||
| Insurance | 3 | $71B |
|
||
| Financial Services | 2 | $25B |
|
||
| Transportation / Logistics | 2 | $18B |
|
||
| Healthcare | 1 | $247B |
|
||
| Telecommunications | 1 | $55B |
|
||
Price history
+154.0% since first listed13 events — show timeline
- 2026-05-14 Listed $174,999 Smart MLS
- 2022-06-01 Price Changed $75,000 Smart MLS
- 2022-05-31 Listing Removed — Smart MLS
- 2022-03-21 Listed $100,000 Smart MLS
- 2020-08-28 Sold (Public Records) $63,000 Public Records
- 2019-11-27 Sold (Public Records) $35,000 Public Records
- 2008-04-21 Sold (MLS) $51,000 Smart MLS
- 2008-03-16 Listed $55,900 Smart MLS
- 2007-09-10 Listing Removed — Smart MLS
- 2007-03-10 Listed $80,000 Smart MLS
- 2005-01-18 Sold (Public Records) $68,000 Public Records
- 2005-01-13 Sold (MLS) $63,000 Smart MLS
- 2004-06-16 Listed $68,900 Smart MLS
Property tax history
+0.9%/yrLatest (2025): $1,563 · +0.0% YoY. Source: county tax records.
Cash-flow waterfall
monthlySold comps — $/sqft
last 12 mo · ≤1 miLoading sold comps…