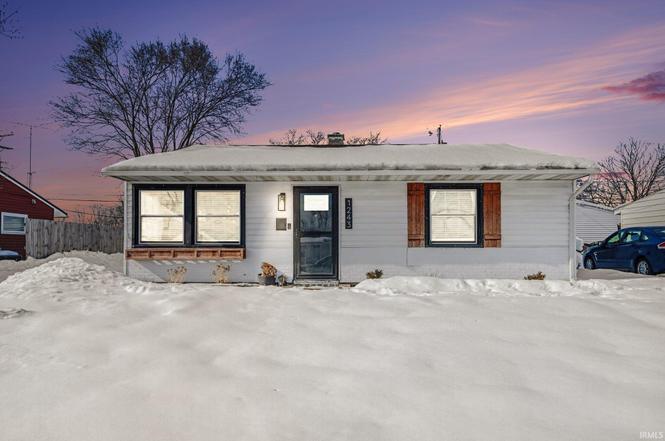
1243 Browne Ln · South Bend, IN
Flood risk 1/10 · Minimal
- FEMA flood zone
- X (unshaded)
- Chance of flooding over 30 yrs
- 0.0%
- Est. flood insurance / yr
- $507 – $1,088
Fire risk 1/10 · Minimal
- Est. fire insurance / yr
- $717 – $1,331
Heat risk 2/10 · Minimal
- Hot days now (above 99°F)
- 7 days/yr
- Hot days in 30 yrs
- 16 days/yr
Wind risk 2/10 · Minimal
- Chance of severe wind over 30 yrs
- —
Air-quality risk 3/10 · Minor
- Unhealthy air days now
- 2 days/yr
- Unhealthy air days in 30 yrs
- 3 days/yr
Risk factors via First Street. Map © Google.
Why this score? — see what drove the D- grade
The composite is a weighted blend of 9 inputs, each scored 0–100. Each bar is that input's sub-score; the figure is the points it added to the 100-point composite (weight × sub-score).
- Cash flow +15.7/30.0
- DSCR +4.8/10.0
- Rent growth +4.1/5.0
- 1% rule +3.6/10.0
- Livability +3.2/5.0
- Condition / age +2.5/5.0
- ARV discount +2.0/15.0
- Schools +1.4/10.0
- Appreciation +0.0/10.0
$185,000
🖨 Deal sheet (PDF) 📄 Offer letter ✓ Due diligence
Listing remarks MLS
Don't drag your feet if you want to be the new owner of this beautiful three bedroom ranch filled with incredible updates and finishes! The spacious living room with great natural light and stylish plank flooring flows into the updated kitchen featuring white shaker cabinetry with modern hardware and fixtures plus a full stainless appliance package. The gorgeous bath boasts an incredible custom tile shower surround plus contemporary vanity and fixtures. All bedrooms feature new carpet and the home is completely outfitted with newer vinyl replacement windows and has a new furnace and central air conditioner! 2 car garage, main floor laundry, and more. This home features incredible finishes throughout and completely move-in ready. You won't find anything like this at this price! So don't wait - schedule your showing today! Broker Owned
Key facts
- Bright living space
- Fenced yard
- Updated flooring
Tags
Neighborhood map
What this means for you Summary
Snapshot
- This is a 3-bed/1.0-bath single-family listed at $185k.
Deal economics
- At list price, monthly cash flow is $81 ($967/yr) — positive.
- The deal already cash-flows at list — no discount required.
- To meet the 1% rule (rent ≥ 1% of price), the offer needs to be $160k (13.6% below list).
- Recommended offer: $160k (13.6% below list) — sets the bar for 1% rule.
- Cap rate 6.8% vs local median 4.3% in South Bend — top-decile yield for the area; either an underpriced asset or a hidden risk that comps aren't pricing in. Stress-test before assuming the spread holds.
Location & tenants
- Location reads 64/100 on livability (#365 in IN) — a middle-class / working-renter tenant base. Strengths: cost of living A+, housing A+, health & safety A+; Watch: amenities D, employment D, crime F.
- South Bend Community School Corporation (urban): math 12% / reading 21% proficiency, ranked #284 of 301 in IN (top 94%) — low school quality limits family demand, transient renter base, plan for 1-2y turnover; 66% free/reduced lunch — lower-income household profile, screen leases tightly.
- Zoned schools: Kennedy Academy (math 45% / reading 52%, grade D, #304 of 994 statewide, top 31%, 520 students, 61% FRL); Edison Middle School (math 7% / reading 13%, grade F, #314 of 330 statewide, top 95%, 381 students, 84% FRL); Adams High School (math 28% / reading 57%, grade F, #195 of 369 statewide, top 53%, 1,976 students, 56% FRL) — zoned schools at 67% FRL track the district average.
- Zoned-school proficiency averages 34% at this address vs 16% district-wide (+17 pts) — the actual schools serving this property are materially stronger than the South Bend Community School Corporation average implies; a family-tenant draw the district grade alone would hide.
- Market conditions: Rents rising fast (+6.3%/yr); 76 active listings in the ZIP; 8 comparable units currently listed for rent nearby; rentals at typical pace (median 16d on market — plan ~3-4 weeks tenant-placement turnaround); 754 units permitted in St. Joseph County in 2024 (460 in 5+ unit buildings).
- This rent runs 30% of the median local income ($63k/yr) — at the standard rent-burdened threshold; future hikes will face affordability resistance.
Forward outlook
- Local home prices are declining (-3.0%/yr); year-one equity from $1k of loan paydown is wiped out by about $6k of value loss. Plan a longer hold.
Negotiation context
- It's been on market 47 days — a 3% lower offer ($179k) is reasonable based on typical stale-listing flexibility.
- 2 sale attempts since 7y ago; this cycle's ask has dropped $15k (8%) from the opening price — seller is motivated, your offer sets the floor, not the list.
- Current owner paid $112k; list at $185k implies a 65% gain — meaningful room to come down on a strong offer.
Risks & watch-outs
- Watch-outs: built in 1954 — expect roof / HVAC / electrical / plumbing capex.
Questions for the listing agent
- It's been on market 47 days. Have you received any prior offers? Is the seller open to a 14% concession, seller financing, or rate buy-down credit?
- Built in 1954 — when were the roof, HVAC, electrical panel, plumbing, and water heater last replaced?
- Is there a deadline driving the sale (1031 exchange, divorce, estate, relocation)? That informs how much negotiation room exists.
- Schools are F-rated, which usually means shorter tenancies and higher turnover. Who's the typical renter profile here, and what's been the actual vacancy rate?
- Crime grade is F in this area — have there been break-ins, vandalism, or insurance claims at this property in the last 3 years? What carrier currently insures it and at what premium?
- The area grade is low — what's the realistic commute time and amenity access for the typical tenant pool here? Any planned neighborhood developments (good or bad) we should know about?
- What's the average days-on-market for RENTAL listings here right now (not sales)? A rising rental-DOM trend means longer vacancies and softer asking-rent achievability than the comps imply.
- What's the recent tenant-quality profile in this submarket — average credit score on applications, eviction rate, late-payment / NSF rate, and stable-employment percentage? A property-management company in the area should have these aggregated.
- How much new for-sale + rental construction is in the pipeline within 1–3 miles? Heavy new supply typically softens prices + rents 12–24 months out; constrained supply supports both.
Investment metrics
- 1% rule
- 0.86% ✗
- Cap rate
- 6.82%
- Cash-on-cash
- 1.87%
- DSCR
- 1.08
- GRM
- 9.7
CMA / ARV
- ARV (on-the-fly)
- $164,864
- Comps found
- 12
Show comp detail 12 sales within ~0.75 mi
| Address | Dist | Beds/Ba | Sqft | Sold | Price | $/sf | Match |
|---|---|---|---|---|---|---|---|
| 1243 Browne Ln | 0.00mi | 3/1.0 | 896 (0%) | 1mo | $180,000 | $201 | 99 |
| 1312 Brummit Ln | 0.08mi | 3/1.0 | 896 (0%) | 5mo | $151,000 | $169 | 92 |
| 1132 Manchester Dr | 0.16mi | 3/1.0 | 896 (0%) | 2mo | $190,000 | $212 | 91 |
| 1316 Helmen Dr | 0.14mi | 3/1.0 | 896 (0%) | 10mo | $153,450 | $171 | 86 |
| 1301 Ebeling Dr | 0.15mi | 3/1.0 | 896 (0%) | 9mo | $162,500 | $181 | 85 |
| 1307 Brummit Ln | 0.10mi | 3/1.0 | 888 (-1%) | 11mo | $169,900 | $191 | 84 |
| 2609 Anzio Ave | 0.47mi | 3/1.0 | 912 (+2%) | 0mo | $190,000 | $208 | 75 |
| 3113 Salem Dr | 0.43mi | 3/1.5 | 952 (+6%) | 8mo | $154,500 | $162 | 61 |
| 54648 27th St | 0.59mi | 3/1.0 | 864 (-4%) | 14mo | $140,000 | $162 | 55 |
| 827 Woodcliff Dr | 0.45mi | 3/1.5 | 952 (+6%) | 14mo | $180,000 | $189 | 55 |
| 449 Chamberlin Dr | 0.72mi | 3/1.0 | 952 (+6%) | 13mo | $175,000 | $184 | 45 |
| 3003 Wilder Dr | 0.60mi | 3/1.5 | 1,008 (+12%) | 9mo | $175,000 | $174 | 42 |
Match score weights: distance 35% · size 25% · config 20% · recency 20%. Top-matched comps best support the ARV.
Projected returns pro-forma
-3.0% appreciation · 6.27% rent growth · sell at horizon
- IRR
- -10.0%
- Equity multiple
- 0.62×
- Total profit
- $-19,451
- Equity at exit
- $27,584
- IRR
- 3.1%
- Equity multiple
- 1.26×
- Total profit
- $13,355
- Equity at exit
- $15,995
Cash invested: $51,800 (down + closing). Projections, not guarantees.
Landlord ↔ Tenant lean methodology
- Overall (STATE)
- 90 Strongly Landlord-Friendly
- State Indiana
- 90 Strongly Landlord-Friendly · R+11
- County
- — inherits STATE
- City
- — inherits STATE
ZIP-level market 46615
- Home prices YoY
- -34.0%
- Rents YoY
- 6.3%
- Active inventory
- 76
- Price-to-rent
- 9.7×
Monthly cashflow live
- Estimated rent
- $1,598 high interval (Pro) →
- Mortgage (P&I)
- −$970
- Tax from tax record
- −$134 /mo · $1,611/yr
- Insurance
- −$77
- HOA
- −$0
- Vacancy / Maint / Mgmt
- −$335
- Net cashflow
- $81
Break-even live
Sensitivity live
| Price | -10% $185 | -5% $133 | +0% $81 | +5% $28 | +10% $-24 |
|---|---|---|---|---|---|
| Rent | -10% $-46 | -5% $18 | +0% $81 | +5% $144 | +10% $207 |
| Rate | -1.0pp $174 | -0.5pp $128 | base $81 | +0.5pp $33 | +1.0pp $-16 |
UW: 25.0% down · 7.5% · 30yr · 1.5% tax · 5.0% vac · 8.0% maint · 8.0% mgmt
Financing live
Cash to close
- Down payment
- $46,250
- Closing costs
- $5,550
- Reserves months
- —
- Total cash needed
- —
Loan-product check · same deal, 3 products live
Conventional
25% down · 7.5% · 30yr
- Down + closing
- —
- Monthly P&I
- —
- Monthly cashflow
- —
- DSCR
- —
- Eligible?
- —
Personal DTI + credit; lowest rate.
DSCR
20% down · 8.5% · 30yr
- Down + closing
- —
- Monthly P&I
- —
- Monthly cashflow
- —
- DSCR
- —
- Eligible?
- —
No personal income docs; deal must DSCR.
Hard money
10% down · 12.0% · 12mo
- Down + closing
- —
- Monthly P&I
- —
- Monthly cashflow
- —
- DSCR
- —
- Eligible?
- —
Short-term bridge; refi at stabilization.
Rent comps 8 comps
| Address | Beds | Baths | Sqft | Rent | $/sqft | DOM | Units | Dist |
|---|---|---|---|---|---|---|---|---|
| 4312 Hickory Rd Mishawaka, IN | 2.0 | 1.0 | 591 | $1,171 | $1.98 | 15d | 44 | 0.58mi |
| 300 Pin Oak Cir Mishawaka, IN | 1.0–3.0 | 1.0–1.5 | 835 | $1,225 | $1.47 | 15d | 1 | 0.81mi |
| 1512 Rosemary Ln South Bend, IN | 2.0 | 1.0 | 910 | $1,138 | $1.25 | 23d | 1 | 0.84mi |
| 303 Village Dr Mishawaka, IN | 1.0–3.0 | 1.0–1.5 | 918 | $1,975 | $2.15 | 15d | 25 | 1.18mi |
| 117 Palau Ave Mishawaka, IN | 3.0 | 1.0 | 1100 | $1,650 | $1.50 | 15d | 1 | 1.20mi |
| 3001 E Jefferson Blvd South Bend, IN | 1.0–2.0 | 1.0–2.0 | 848 | $1,329 | $1.57 | 15d | 21 | 1.25mi |
| 302 Village Dr Mishawaka, IN | 1.0–3.0 | 1.0–1.5 | 950 | $2,043 | $2.15 | 15d | 33 | 1.26mi |
| 5630 University Park Dr Mishawaka, IN | 1.0–3.0 | 1.0–1.5 | 950 | $2,003 | $2.11 | 15d | 17 | 1.36mi |
Listing history 6 events
-
2026-04-01status Pending
-
2026-03-06price $185,000
-
2026-02-21price $195,000
-
2026-02-10$200,000 Active
-
2019-06-21soldstatus $112,000 846-char remark
Show marketing remark (846 chars)
Don't drag your feet if you want to be the new owner of this beautiful three bedroom ranch filled with incredible updates and finishes! The spacious living room with great natural light and stylish plank flooring flows into the updated kitchen featuring white shaker cabinetry with modern hardware and fixtures plus a full stainless appliance package. The gorgeous bath boasts an incredible custom tile shower surround plus contemporary vanity and fixtures. All bedrooms feature new carpet and the home is completely outfitted with newer vinyl replacement windows and has a new furnace and central air conditioner! 2 car garage, main floor laundry, and more. This home features incredible finishes throughout and completely move-in ready. You won't find anything like this at this price! So don't wait - schedule your showing today! Broker Owned
-
2019-04-26$117,900 846-char remark
Show marketing remark (846 chars)
Don't drag your feet if you want to be the new owner of this beautiful three bedroom ranch filled with incredible updates and finishes! The spacious living room with great natural light and stylish plank flooring flows into the updated kitchen featuring white shaker cabinetry with modern hardware and fixtures plus a full stainless appliance package. The gorgeous bath boasts an incredible custom tile shower surround plus contemporary vanity and fixtures. All bedrooms feature new carpet and the home is completely outfitted with newer vinyl replacement windows and has a new furnace and central air conditioner! 2 car garage, main floor laundry, and more. This home features incredible finishes throughout and completely move-in ready. You won't find anything like this at this price! So don't wait - schedule your showing today! Broker Owned
ⓘ Source: listings_history table (triggers on properties + properties_extension) + one-shot
backfill from property_details.listing_events for pre-trigger history.
Tax reassessment forecast IN · Partial reset (capped growth)
- Current annual tax
- $1,611 · $134/mo
- Projected year-2 tax
- $1,611 · $134/mo
- Expected delta
- $0/yr ($0/mo · 0.0%)
ⓘ Screening estimate from a state-policy table — verify with the county assessor before closing.
Climate risk First Street
- Flood 1/10 Low FEMA zone X (unshaded) · 0% chance over 30 yrs
- Wildfire 1/10 Low
- Heat 2/10 Low 7 d/yr ≥99°F today · 16 d/yr by 30 yrs out
- Wind 2/10 Low
- Air quality 3/10 Moderate 2 unhealthy d/yr today · 3 by 30 yrs out
Nearby sold comps map
Loading sold comps map…
Walkable amenities ~0.75 mi
Loading nearby amenities…
Taxation est. · year 1
- Rental income
- $19,171
- − Mortgage interest
- −$10,363
- − Property taxes
- −$1,611
- − Insurance
- −$925
- − Repairs & maintenance
- −$1,534
- − Management
- −$1,534
- − Depreciation
- −$5,382
- Taxable loss
- −$2,177
- Est. tax savings @ 24.0%
- +$522
- After-tax cash flow
- $1,490/yr
For passive investors: Depreciation is non-cash, so a rental often shows a tax loss while cash-flowing — sheltering income. Rental losses are passive: they offset passive income freely, and up to $25,000/yr can offset ordinary (W-2) income if you actively participate and your MAGI is under $100k (phasing out to $0 by $150k); unused losses carry forward. On sale, claimed depreciation is recaptured at up to 25%, and gains may owe capital-gains tax (a 1031 exchange can defer both). Figures are a year-1 estimate at your 24.0% rate — not tax advice; consult a CPA.
Schools (NCES district)
- District
- South Bend Community School Corporation
- NCES district ID
- 1810290
- Math proficiency
- 12% ▼ -10.00%
- Reading proficiency
- 21% ▼ -6.00%
- Median HH income
- $41,935
- Composite
- 14.21/100
- National rank
- #9452
- State rank
- #284 of 301 in IN
Livability — South Bend
- Score
- 64/100
- State rank
- #365
- US rank
- #13730
Category grades
Schools grade is shown separately in the Schools card above.
Census & demographics
- Census place
- South Bend, IN
- County
- Saint Joseph County · 189,048 people
- City population
- 99,767
- Metro
- South Bend-Mishawaka, IN-MI
- Population (ZIP)
- 14,190
- Household income
- $62,964
- Rent vs Own
- Severe rent burden
- 420.0
Population outlook (St. Joseph County) Hauer SSP2
- Today (2025)
- 273,186 people
- By 2030
- 273,594 · +0.1%
- By 2040
- 271,641 · -0.6%
- By 2050
- 269,187 · -1.5%
- By 2075
- 263,136 · -3.7%
- By 2100
- 245,659 · -10.1%
Race, ethnicity, and origin ACS 2023
- Neighborhood character
- Predominantly White (65%)
- Race & ethnicity
- White 65% Black 14% Two or more races 11% Hispanic / Latino 10% Asian 3%
- Hispanic origin (detail)
- Mexican 8%
- Common ancestry
- Romanian 6% Italian 2% Serbian 2%
- Foreign-born
- 8% · Canada, Vietnam
- Languages at home
- 87% English-only · Spanish 7% Tagalog/Filipino 1% Other Indo-European 1%
Political lean MEDSL · St. Joseph
- 2024 margin
- Toss-up / Even · D 50.0% · R 48.5% · Other 1.5%
- 2008→2024 swing
- -15.6pp toward R · 2008: 17.1pp · 2024: 1.5pp
- All cycles
- 2024: D+1.5 2020: D+5.8 2016: D+0.2 2012: D+3.5 2008: D+17.1
Not yet ingested
- Civics
- —
Market trends
- HPI YoY
- ▼ -124.82%
- Current HPI
- 242.1938
- Rent YoY
- ▲ 6.27%
- Metro
- South Bend-Mishawaka, IN-MI
- State GDP YoY
- ▲ 2.90%
- F500 in state
- 18
Industry mix (Fortune 500 HQ in IN)
| Industry | F500 HQs | Revenue |
|---|---|---|
| Industrial Machinery | 2 | $37B |
|
||
| Healthcare | 1 | $177B |
|
||
| Pharmaceuticals | 1 | $45B |
|
||
| Metals / Steel | 1 | $18B |
|
||
| Agriculture | 1 | $17B |
|
||
| Packaging | 1 | $12B |
|
||
Price history
+56.9% since first listed6 events — show timeline
- 2026-04-01 Pending — IRMLS
- 2026-03-06 Price Changed $185,000 IRMLS
- 2026-02-21 Price Changed $195,000 IRMLS
- 2026-02-10 Listed $200,000 IRMLS
- 2019-06-21 Sold (MLS) $112,000 IRMLS
- 2019-04-26 Listed $117,900 IRMLS
Property tax history
+10.7%/yrLatest (2023): $1,611 · +1.3% YoY. Source: county tax records.
Cash-flow waterfall
monthlySold comps — $/sqft
last 12 mo · ≤1 miLoading sold comps…