 🏗️ New Construction
Galaxy Plan · Colorado Springs, CO
Flood risk 4/10 · Minor
- FEMA flood zone
- X (shaded)
- Chance of flooding over 30 yrs
- 0.22%
- Est. flood insurance / yr
- $507 – $1,088
Fire risk 1/10 · Minimal
- Est. fire insurance / yr
- $939 – $1,743
Heat risk 3/10 · Minor
- Hot days now (above 90°F)
- 7 days/yr
- Hot days in 30 yrs
- 20 days/yr
Wind risk 2/10 · Minimal
- Chance of severe wind over 30 yrs
- —
Air-quality risk 1/10 · Minimal
- Unhealthy air days now
- 0 days/yr
- Unhealthy air days in 30 yrs
- 0 days/yr
Risk factors via First Street. Map © Google.
Why this score? — see what drove the B- grade
The composite is a weighted blend of 9 inputs, each scored 0–100. Each bar is that input's sub-score; the figure is the points it added to the 100-point composite (weight × sub-score).
- Cash flow +30.0/30.0
- 1% rule +10.0/10.0
- DSCR +10.0/10.0
- ARV discount +7.5/15.0
- Livability +3.9/5.0
- Rent growth +2.4/5.0
- Condition / age +2.2/5.0
- Schools +2.1/10.0
- Appreciation +0.0/10.0
$52,900
🖨 Deal sheet 📄 Offer letter ✓ Due diligence
Listing remarks
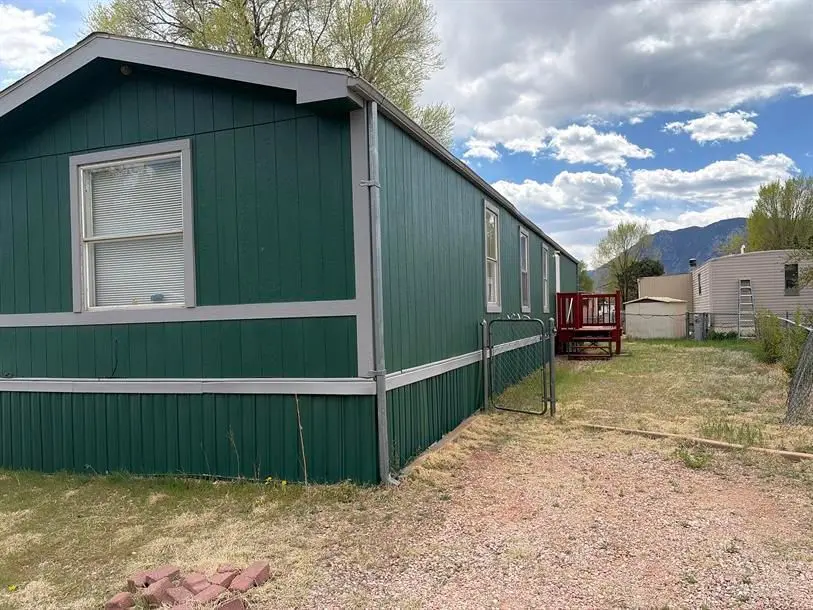
This 2000 GALAXY home at Circle Drive in Colorado Springs, CO is ready for a new life. With 960 square feet, 3 bedrooms, and 2 bathrooms, this single-wide home offers a practical layout and a great opportunity for a buyer ready to take on a fixer-upper project.
Key facts
- Listed 42 days
Property features AI
Finance
- Financial info: List price provided
Exterior
- Utilities: Has heating
- Home design: Single-story plan
- Construction: Living area approximately 960 (interior space)
- Exterior features: Metal roof
Interior
- Bedrooms: 3 bedrooms
- Bathrooms: 2 bathrooms
- Heating & cooling: Forced air heating; Other heating
- Interior features: Plan: Galaxy
Neighborhood map
What this means for you Summary
Snapshot
- This is a 3-bed/2.0-bath manufactured listed at $53k. Condition is rated fair.
Deal economics
- At list price, monthly cash flow is $1k ($12k/yr) — positive.
- The deal already cash-flows at list — no discount required.
- Meets the 1% rule at list price ($2k rent vs $53k).
- Recommended offer: $51k (3.0% below list) — sets the bar for market timing.
- Cap rate 29.6% vs local median 3.3% in Colorado Springs — top-decile yield for the area; either an underpriced asset or a hidden risk that comps aren't pricing in. Stress-test before assuming the spread holds.
Location & tenants
- Location reads 78/100 on livability (#23 in CO, #2,639 nationally) — a middle-class / working-renter tenant base. Strengths: amenities A+, housing A+, health & safety A+; Watch: cost of living C-, crime F.
- Harrison School District No. 2 In The County Of El Paso An (urban): math 16% / reading 35% proficiency, ranked #67 of 86 in CO (top 78%) — low school quality limits family demand, transient renter base, plan for 1-2y turnover; 62% free/reduced lunch — lower-income household profile, screen leases tightly.
- Market conditions: Rents soft (-0.4%/yr); 300 active listings in the ZIP; 29 comparable units currently listed for rent nearby; rentals leasing fast (median 10d on market — plan ~1-2 weeks tenant-placement turnaround); solid renter incomes; 3,906 units permitted in El Paso County in 2024 (872 in 5+ unit buildings).
Forward outlook
- Local home prices are declining (-3.0%/yr); year-one equity from $366 of loan paydown is wiped out by about $2k of value loss. Plan a longer hold.
- El Paso County population projected at +28% by 2050 — long-run rental-demand tailwind backs the buy-and-hold thesis.
- At projected returns (-3.0% appreciation + 0.0% rent growth), your $15k cash investment doubles in ~2 years — after that, you're playing with house money.
Negotiation context
- It's been on market 42 days — a 3% lower offer ($51k) is reasonable based on typical stale-listing flexibility.
Questions for the listing agent
- It's been on market 42 days. Have you received any prior offers? Is the seller open to a 3% concession, seller financing, or rate buy-down credit?
- Have any recent inspections been done? Can we get a copy of the seller's disclosures and any deferred-maintenance estimates?
- Is there a deadline driving the sale (1031 exchange, divorce, estate, relocation)? That informs how much negotiation room exists.
- Schools are B-rated — typically a magnet for longer-tenancy family renters. What's the average tenant stay here, and is there a school-zone premium baked into asking?
- Crime grade is F in this area — have there been break-ins, vandalism, or insurance claims at this property in the last 3 years? What carrier currently insures it and at what premium?
- What's the average days-on-market for RENTAL listings here right now (not sales)? A rising rental-DOM trend means longer vacancies and softer asking-rent achievability than the comps imply.
- What's the recent tenant-quality profile in this submarket — average credit score on applications, eviction rate, late-payment / NSF rate, and stable-employment percentage? A property-management company in the area should have these aggregated.
- How much new for-sale + rental construction is in the pipeline within 1–3 miles? Heavy new supply typically softens prices + rents 12–24 months out; constrained supply supports both.
Investment metrics
- 1% rule
- 3.33% ✓
- Cap rate
- 29.55%
- Cash-on-cash
- 83.06%
- DSCR
- 4.70
- GRM
- 2.5
CMA / ARV
No comps found within radius.
Projected returns pro-forma
-3.0% appreciation · 0.0% rent growth · sell at horizon
- IRR
- 80.0%
- Equity multiple
- 4.48×
- Total profit
- $51,594
- Equity at exit
- $7,888
- IRR
- 82.7%
- Equity multiple
- 8.37×
- Total profit
- $109,180
- Equity at exit
- $4,574
Cash invested: $14,812 (down + closing). Projections, not guarantees.
Landlord ↔ Tenant lean methodology
- Overall (STATE)
- 38 Tenant-Leaning
- State Colorado
- 38 Tenant-Leaning · D+4
- County
- — inherits STATE
- City
- — inherits STATE
ZIP-level market 80906
- Rents YoY
- -0.4%
- Active inventory
- 300
- Price-to-rent
- 2.5×
Monthly cashflow live
- Estimated rent
- $1,761 high interval (Pro) →
- Mortgage (P&I)
- −$277
- Tax est. 1.5%
- −$66 /mo · $794/yr
- Insurance
- −$22
- HOA
- −$0
- Vacancy / Maint / Mgmt
- −$370
- Net cashflow
- $1,025
Break-even live
UW: 25.0% down · 7.5% · 30yr · 1.5% tax · 5.0% vac · 8.0% maint · 8.0% mgmt
Financing live
Cash to close
- Down payment
- $13,225
- Closing costs
- $1,587
- Reserves months
- —
- Total cash needed
- —
Loan-product check · same deal, 3 products live
Conventional
25% down · 7.5% · 30yr
- Down + closing
- —
- Monthly P&I
- —
- Monthly cashflow
- —
- DSCR
- —
- Eligible?
- —
Personal DTI + credit; lowest rate.
DSCR
20% down · 8.5% · 30yr
- Down + closing
- —
- Monthly P&I
- —
- Monthly cashflow
- —
- DSCR
- —
- Eligible?
- —
No personal income docs; deal must DSCR.
Hard money
10% down · 12.0% · 12mo
- Down + closing
- —
- Monthly P&I
- —
- Monthly cashflow
- —
- DSCR
- —
- Eligible?
- —
Short-term bridge; refi at stabilization.
Rent comps 29 comps
| Address | Beds | Baths | Sqft | Rent | $/sqft | DOM | Units | Dist |
|---|---|---|---|---|---|---|---|---|
| 2115 Birmingham Loop Colorado Springs, CO | 1.0–3.0 | 1.0–2.0 | 923 | $2,382 | $2.58 | 2d | 24 | 0.48mi |
| 1836 Ralphs Rdg Colorado Springs, CO | 1.0–2.0 | 1.0–2.0 | 702 | $1,566 | $2.23 | 2d | 10 | 0.61mi |
| 1316 Harrison Rd Colorado Springs, CO | 3.0 | 1.0 | 894 | $1,595 | $1.78 | 21d | 1 | 0.63mi |
| 1535 Monterey Rd #230 Colorado Springs, CO | 2.0 | 1.0 | 1008 | $1,550 | $1.54 | 23d | 1 | 0.79mi |
| 2218 Carmel Dr Colorado Springs, CO | 3.0 | 1.0 | 1000 | $1,950 | $1.95 | 23d | 1 | 0.79mi |
| 2049 Legacy Ridge Vw Colorado Springs, CO | 2.0 | 1.0 | 944 | $1,335 | $1.41 | 14d | 1 | 0.82mi |
| 1810 Eldorado Springs Hts Colorado Springs, CO | 1.0–3.0 | 1.0–2.0 | 1081 | $3,145 | $2.91 | 2d | 14 | 0.85mi |
| 2010 Carmel Dr Colorado Springs, CO | 1.0–2.0 | 1.0 | 701 | $850 | $1.21 | 10d | 4 | 0.88mi |
| 2050 Del Mar Dr Colorado Springs, CO | 3.0 | 1.0 | 912 | $2,095 | $2.30 | 23d | 1 | 0.89mi |
| 2874 Carmel Cir Colorado Springs, CO | 4.0 | 1.0 | 1117 | $1,995 | $1.79 | 2d | 1 | 0.97mi |
| 1806 Monterey Rd Ste Off Colorado Springs, CO | 2.0 | 1.0 | 661 | $1,169 | $1.77 | 2d | 20 | 0.98mi |
| 1751 Shenandoah Dr Colorado Springs, CO | 2.0 | 1.5 | 960 | $1,015 | $1.06 | 23d | 1 | 1.05mi |
| 916 Tenderfoot Hill Rd Colorado Springs, CO | 2.0 | 2.0 | 908 | $1,822 | $2.01 | 14d | 1 | 1.08mi |
| 848 Tenderfoot Hill Rd Colorado Springs, CO | 2.0 | 2.0 | 908 | $1,395 | $1.54 | 23d | 1 | 1.16mi |
| 814 Tenderfoot Hill Rd #201 Colorado Springs, CO | 2.0 | 2.0 | 908 | $1,295 | $1.43 | 2d | 1 | 1.17mi |
| 2005 S El Paso Ave Colorado Springs, CO | 2.0 | 1.0 | 570 | $1,260 | $2.21 | 2d | 9 | 1.18mi |
| 2335 CoralBell Grv Colorado Springs, CO | 1.0–3.0 | 1.0–2.0 | 997 | $2,498 | $2.50 | 23d | 34 | 1.28mi |
| 2335 CoralBell Grv Colorado Springs, CO | 2.0–3.0 | 1.0–2.0 | 1004 | $2,195 | $2.19 | 2d | 7 | 1.28mi |
| 945 Moorings Dr Colorado Springs, CO | 2.0 | 2.0 | 984 | $1,712 | $1.74 | 23d | 1 | 1.29mi |
| 2605 Verde Dr Colorado Springs, CO | 1.0–2.0 | 1.0 | 722 | $1,190 | $1.65 | 2d | 15 | 1.30mi |
| 3308 Quail Lake Rd Colorado Springs, CO | 1.0–2.0 | 1.0–2.0 | 943 | $1,909 | $2.02 | 2d | 1 | 1.32mi |
| 1698 Lenmar Dr Colorado Springs, CO | 1.0–3.0 | 1.0 | 700 | $1,702 | $2.43 | 2d | 26 | 1.33mi |
| 750 E Cheyenne Rd Colorado Springs, CO | 1.0–2.0 | 1.0 | 610 | $1,175 | $1.93 | 23d | 5 | 1.38mi |
| 1117 Verde Dr Colorado Springs, CO | 2.0 | 1.0 | 714 | $1,065 | $1.49 | 2d | 18 | 1.39mi |
| 2730 Bentley Pt Colorado Springs, CO | 1.0–2.0 | 1.0–2.0 | 715 | $1,111 | $1.55 | 23d | 8 | 1.40mi |
| 1026 Rice Dr Colorado Springs, CO | 3.0 | 1.0 | 640 | $1,581 | $2.47 | 10d | 27 | 1.41mi |
| 2610 E Fountain Blvd Colorado Springs, CO | 1.0–2.0 | 1.0 | 767 | $1,099 | $1.43 | 3d | 5 | 1.47mi |
| 890 Quail Lake Cir Colorado Springs, CO | 1.0–3.0 | 1.0–2.0 | 1147 | $2,070 | $1.80 | 2d | 21 | 1.48mi |
| 2614 E Fountain Blvd Colorado Springs, CO | 2.0 | 1.0 | 875 | $1,062 | $1.21 | 23d | 1 | 1.48mi |
Listing history 15 events
-
2026-06-18days on market $52,900 Active 42 DOM
-
2026-06-17days on market $52,900 Active 41 DOM
-
2026-06-16days on market $52,900 Active 40 DOM
-
2026-06-15days on market $52,900 Active 39 DOM
-
2026-06-14days on market $52,900 Active 37 DOM
-
2026-06-13days on market $52,900 Active 36 DOM
-
2026-06-10days on market $52,900 Active 34 DOM
-
2026-06-09days on market $52,900 Active 33 DOM
-
2026-06-08days on market $52,900 Active 32 DOM
-
2026-06-07days on market $52,900 Active 31 DOM
-
2026-06-05days on market $52,900 Active 28 DOM
-
2026-06-03days on market $52,900 Active 27 DOM
-
2026-06-03days on market $52,900 Active 26 DOM
-
2026-06-01days on market $52,900 Active 25 DOM
-
2026-05-31days on market $52,900 Active 24 DOM
ⓘ Source: listings_history table (triggers on properties + properties_extension) + one-shot
backfill from property_details.listing_events for pre-trigger history.
Climate risk First Street
- Flood 4/10 Moderate FEMA zone X (shaded) · 22% chance over 30 yrs
- Wildfire 1/10 Low
- Heat 3/10 Moderate 7 d/yr ≥90°F today · 20 d/yr by 30 yrs out
- Wind 2/10 Low
- Air quality 1/10 Low 0 unhealthy d/yr today · 0 by 30 yrs out
Nearby sold comps map
Loading sold comps map…
Walkable amenities ~0.75 mi
Loading nearby amenities…
Taxation est. · year 1
- Rental income
- $21,127
- − Mortgage interest
- −$2,963
- − Property taxes
- −$794
- − Insurance
- −$264
- − Repairs & maintenance
- −$1,690
- − Management
- −$1,690
- − Depreciation
- −$1,539
- Taxable income
- $12,186
- Est. tax owed @ 24.0%
- −$2,925
- After-tax cash flow
- $9,378/yr
For passive investors: Depreciation is non-cash, so a rental often shows a tax loss while cash-flowing — sheltering income. Rental losses are passive: they offset passive income freely, and up to $25,000/yr can offset ordinary (W-2) income if you actively participate and your MAGI is under $100k (phasing out to $0 by $150k); unused losses carry forward. On sale, claimed depreciation is recaptured at up to 25%, and gains may owe capital-gains tax (a 1031 exchange can defer both). Figures are a year-1 estimate at your 24.0% rate — not tax advice; consult a CPA.
Condition & rehab AI · 9 photos
This 2000 GALAXY home in Colorado Springs, CO is a fixer-upper project with moderate rehabilitation needs. The kitchen and bathrooms require significant updates, while the exterior and landscaping could benefit from improvements. With proper renovations, this home has the potential to increase both its resale and rental value.
Repairs flagged
- Major Kitchen cabinets — Significant wear and tear, likely requiring replacement.
- Major Kitchen countertops — Stained and worn, likely requiring replacement.
- Major Bathroom fixtures — Worn and outdated, likely requiring replacement.
- Moderate Exterior siding — Weathered and could benefit from repainting.
- Major Flooring — Stained and worn, likely requiring replacement.
- Major Paint — Chipped and worn in some areas, likely requiring repainting.
- Moderate Windows — Could benefit from new caulking and weatherstripping.
- Minor HVAC system — No visible damage, but could benefit from cleaning and maintenance.
- Major Landscaping — Overgrown and could benefit from trimming and planting new shrubs or flowers.
Value-add opportunities
- Both Replace worn kitchen cabinets and countertops — Modernizing the kitchen will improve both resale and rental value.
- Both Replace worn bathroom fixtures — Updating the bathrooms will improve both resale and rental value.
- Both Repaint exterior siding — Repainting the exterior will improve curb appeal and increase both resale and rental value.
- Both Replace worn flooring — Replacing the worn flooring will improve both resale and rental value.
- Both Repaint interior walls — Repainting the interior walls will improve curb appeal and increase both resale and rental value.
- Both Replace worn windows with new caulking and weatherstripping — Updating the windows will improve curb appeal and increase both resale and rental value.
- Both Trim and plant new shrubs or flowers in landscaping — Improving the landscaping will increase curb appeal and increase both resale and rental value.
Renovation cost estimate screening
| Repair item | Severity | Est. cost |
|---|---|---|
| Kitchen cabinets · Significant wear and tear, likely requiring replacement. | Major | $15,000–50,000 |
| Kitchen countertops · Stained and worn, likely requiring replacement. | Major | $15,000–50,000 |
| Bathroom fixtures · Worn and outdated, likely requiring replacement. | Major | $15,000–50,000 |
| Exterior siding · Weathered and could benefit from repainting. | Moderate | $3,000–15,000 |
| Flooring · Stained and worn, likely requiring replacement. | Major | $15,000–50,000 |
| Paint · Chipped and worn in some areas, likely requiring repainting. | Major | $15,000–50,000 |
| Windows · Could benefit from new caulking and weatherstripping. | Moderate | $3,000–15,000 |
| HVAC system · No visible damage, but could benefit from cleaning and maintenance. | Minor | $500–3,000 |
| Landscaping · Overgrown and could benefit from trimming and planting new shrubs or flowers. | Major | $15,000–50,000 |
| Total estimated repair cost · 9 items | $96,500–333,000 |
Value-add ROI direction
- Both Replace worn kitchen cabinets and countertops — Modernizing the kitchen will improve both resale and rental value. ↑
- Both Replace worn bathroom fixtures — Updating the bathrooms will improve both resale and rental value. ↑
- Both Repaint exterior siding — Repainting the exterior will improve curb appeal and increase both resale and rental value. ↑
- Both Replace worn flooring — Replacing the worn flooring will improve both resale and rental value. ↑
- Both Repaint interior walls — Repainting the interior walls will improve curb appeal and increase both resale and rental value. ↑
- Both Replace worn windows with new caulking and weatherstripping — Updating the windows will improve curb appeal and increase both resale and rental value. ↑
- Both Trim and plant new shrubs or flowers in landscaping — Improving the landscaping will increase curb appeal and increase both resale and rental value. ↑
ⓘ Cost ranges are severity-bucket heuristics (US national rule-of-thumb). Get contractor quotes + a written scope before underwriting a rehab budget.
Schools (NCES district)
- District
- Harrison School District No. 2 In The County Of El Paso An
- NCES district ID
- 0804530
- Math proficiency
- 16% ▼ -13.00%
- Reading proficiency
- 35% ▼ -7.00%
- Median HH income
- $40,242
- Composite
- 21.47/100
- National rank
- #8333
- State rank
- #67 of 86 in CO
Livability — Colorado Springs
- Score
- 78/100
- State rank
- #23
- US rank
- #2639
Category grades
Schools grade is shown separately in the Schools card above.
Census & demographics
- County
- El Paso County · 689,348 people
- City population
- 555,783
- Metro
- Colorado Springs, CO
- Population (ZIP)
- 37,502
- Household income
- $89,984
- Rent vs Own
- Severe rent burden
- 1572.0
Population outlook (El Paso County) Hauer SSP2
- Today (2025)
- 768,926 people
- By 2030
- 815,739 · +6.1%
- By 2040
- 903,489 · +17.5%
- By 2050
- 981,204 · +27.6%
- By 2075
- 1,155,542 · +50.3%
- By 2100
- 1,202,070 · +56.3%
Race, ethnicity, and origin ACS 2023
- Neighborhood character
- Predominantly White (70%)
- Race & ethnicity
- White 70% Hispanic / Latino 18% Two or more races 11% Black 4% Asian 3% Native American 1%
- Hispanic origin (detail)
- Mexican 8% Puerto Rican 2%
- Common ancestry
- Italian 3% Romanian 3% Slovak 3%
- Foreign-born
- 7% · Canada, South Korea, Vietnam
- Languages at home
- 89% English-only · Spanish 6% Russian/Polish/Slavic 1% German/W. Germanic 1%
Political lean MEDSL · El Paso
- 2024 margin
- Lean R (+9.8) · D 43.8% · R 53.5% · Other 2.7%
- 2008→2024 swing
- +9.0pp toward D · 2008: -18.8pp · 2024: -9.8pp
- All cycles
- 2024: R+9.8 2020: R+10.8 2016: R+22.6 2012: R+21.4 2008: R+18.8
Not yet ingested
- Civics
- —
Market trends
- HPI YoY
- ▼ -272.61%
- Current HPI
- 248.2125
- Rent YoY
- ▼ -0.43%
- Metro
- Colorado Springs, CO
- State GDP YoY
- ▲ 1.95%
- F500 in state
- 14
Industry mix (Fortune 500 HQ in CO)
| Industry | F500 HQs | Revenue |
|---|---|---|
| Technology Distribution | 1 | $31B |
|
||
| Food / Agriculture | 1 | $18B |
|
||
| Packaging | 1 | $14B |
|
||
| Healthcare | 1 | $13B |
|
||
| Energy | 1 | $10B |
|
||
| Technology | 1 | $4B |
|
||
Cash-flow waterfall
monthlySold comps — $/sqft
last 12 mo · ≤1 miLoading sold comps…