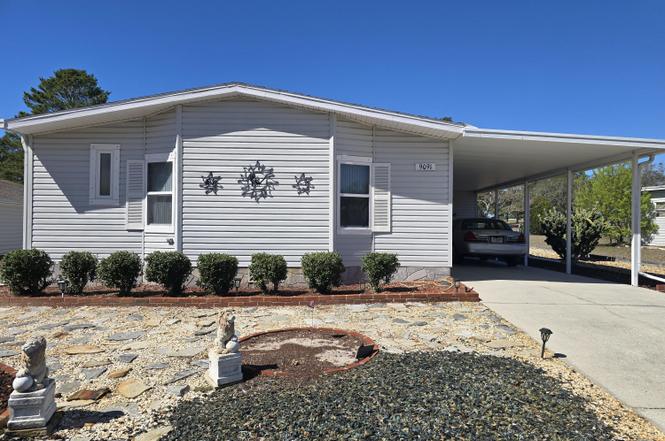
9091 Dickens Ave · Brookridge, FL
Flood risk 1/10 · Minimal
- FEMA flood zone
- X (unshaded)
- Chance of flooding over 30 yrs
- 0.0%
- Est. flood insurance / yr
- $507 – $1,088
Fire risk 5/10 · Moderate
- Est. fire insurance / yr
- $947 – $1,759
Heat risk 10/10 · Severe
- Hot days now (above 109°F)
- 7 days/yr
- Hot days in 30 yrs
- 25 days/yr
Wind risk 9/10 · Severe
- Chance of severe wind over 30 yrs
- 99.0%
Air-quality risk 2/10 · Minimal
- Unhealthy air days now
- 1 days/yr
- Unhealthy air days in 30 yrs
- 1 days/yr
Risk factors via First Street. Map © Google.
Why this score? — see what drove the F grade
The composite is a weighted blend of 9 inputs, each scored 0–100. Each bar is that input's sub-score; the figure is the points it added to the 100-point composite (weight × sub-score).
- Cash flow +12.8/30.0
- Schools +4.2/10.0
- DSCR +3.8/10.0
- Livability +3.5/5.0
- 1% rule +2.8/10.0
- Rent growth +2.5/5.0
- Condition / age +2.5/5.0
- ARV discount +0.0/15.0
- Appreciation +0.0/10.0
$209,900
🖨 Deal sheet 📄 Offer letter ✓ Due diligence
Listing remarks
GOLF COURSE HOME LOCATED ON THE 4th HOLE in the highly desirable Brookridge Community! This home sits on an outstanding part of the golf course! Are you looking for a sense of community with activities with folks your own age? If so, Look no Further! This Beautiful home is has so much NATURAL LIGHT-something you just can't buy! This Spacious & Clean RARE 2 Bedroom 2 Bathroom SPLIT PLAN boasts Vaulted Ceilings and 2 Huge Sliding Glass doors in your kitchen leading you to your porches. Bedrooms are both fabulous sizes. This home a great layout with ample closets and extra space, in addition to the main home, you will find relaxation sitting in the Enclosed Florida Room (310 sq ft) or
Key facts
- Brookridge community
- 4th hole
- Golf cart garage
Tags
Property features AI
Finance
- HOA & community: Homeowners association with $55 monthly fee; Senior community
Exterior
- Parking: Attached carport; Has attached garage; Gated access
- Security: Gated with guard; Smoke detector(s)
- Utilities: Public water; Public sewer; Electricity connected; Water connected; Sewer connected; Cable connected
- Home design: Manufactured home (double wide); One level; Faces east; Residential single-family use
- Construction: Vinyl siding; Shingle roof
- Exterior features: Covered, screened and glass-enclosed rear porch; Porch; Patio; Shed(s); Workshop; On golf course; Private road frontage; Private maintained road; Street lights; Gated community; Has view
Interior
- Kitchen: Oven; Refrigerator
- Bedrooms: 3 total rooms (includes bedrooms and living areas)
- Flooring: Carpet; Laminate
- Bathrooms: 2 full bathrooms
- Heating & cooling: Central heating; Central air; Ceiling fans
- Interior features: Ceiling fans; Eat-in kitchen; Vaulted ceilings; Walk-in closet(s)
- Laundry & utility: Washer hookup; Electric dryer hookup; Laundry area in carport
Neighborhood map
What this means for you Summary
Snapshot
- This is a 2-bed/2.0-bath manufactured listed at $210k.
Deal economics
- At list price, monthly cash flow is $-19 ($-229/yr) — negative.
- To cash-flow at today's rent, offer at most $207k (1.6% below list).
- To meet the 1% rule (rent ≥ 1% of price), the offer needs to be $163k (22.3% below list).
- Recommended offer: $163k (22.3% below list) — sets the bar for 1% rule.
Location & tenants
- Location reads 70/100 on livability (#421 in FL) — a middle-class / working-renter tenant base. Strengths: cost of living A+, housing A+, crime B+; Watch: employment C-, health & safety C-, amenities F.
- Hernando (suburban): math 50% / reading 50% proficiency, ranked #38 of 73 in FL (top 52%) — acceptable for families but not a draw, mixed tenant base, ~2y average lease.
- Zoned schools: Pine Grove Elementary School (math 60% / reading 45%, grade C-, #976 of 2,144 statewide, top 46%, 991 students, 60% FRL); West Hernando Middle School (math 36% / reading 37%, grade F, #405 of 571 statewide, top 72%, 695 students, 58% FRL); Central High School (math 34% / reading 44%, grade F, #312 of 667 statewide, top 48%, 1,426 students, 53% FRL) — zoned schools at 57% FRL track the district average.
- Market conditions: 691 active listings in the ZIP; 10 comparable units currently listed for rent nearby; rentals at typical pace (median 22d on market — plan ~3-4 weeks tenant-placement turnaround); 2,505 units permitted in Hernando County in 2024 (318 in 5+ unit buildings).
- This rent runs 33% of the median local income ($59k/yr) — at the standard rent-burdened threshold; future hikes will face affordability resistance.
Forward outlook
- Local home prices are declining (-3.0%/yr); year-one equity from $1k of loan paydown is wiped out by about $6k of value loss. Plan a longer hold.
- Hernando County population projected at +11% by 2050 — modest demand growth; plan on rents tracking national, not racing it.
Negotiation context
- It's been on market 111 days — a 9% lower offer ($191k) is reasonable based on typical stale-listing flexibility.
- Current owner paid $61k; list at $210k implies a 244% gain — meaningful room to come down on a strong offer.
Risks & watch-outs
- Climate carrying-cost: severe wind risk, 99% chance of damaging wind over 30y; moderate wildfire risk; extreme-heat days projected 7→25/yr by 2055 (HVAC capex compounding) — expect insurance premiums to compound above CPI over the hold.
Questions for the listing agent
- What do current leases actually rent for vs. the listed asking? Can we see a recent rent roll and the last 12 months of T-12 income?
- It's been on market 111 days. Have you received any prior offers? Is the seller open to a 22% concession, seller financing, or rate buy-down credit?
- What does the HOA fee cover, when was the last increase, and are there any pending special assessments or reserve-fund shortfalls?
- Why hasn't it sold? Are there any deal-killer items the seller is aware of (foundation, flood, title, zoning, code violations)?
- Is there a deadline driving the sale (1031 exchange, divorce, estate, relocation)? That informs how much negotiation room exists.
- Schools are F-rated, which usually means shorter tenancies and higher turnover. Who's the typical renter profile here, and what's been the actual vacancy rate?
- The area grade is low — what's the realistic commute time and amenity access for the typical tenant pool here? Any planned neighborhood developments (good or bad) we should know about?
- What's the average days-on-market for RENTAL listings here right now (not sales)? A rising rental-DOM trend means longer vacancies and softer asking-rent achievability than the comps imply.
- What's the recent tenant-quality profile in this submarket — average credit score on applications, eviction rate, late-payment / NSF rate, and stable-employment percentage? A property-management company in the area should have these aggregated.
- How much new for-sale + rental construction is in the pipeline within 1–3 miles? Heavy new supply typically softens prices + rents 12–24 months out; constrained supply supports both.
Investment metrics
- 1% rule
- 0.78% ✗
- Cap rate
- 6.18%
- Cash-on-cash
- -0.39%
- DSCR
- 0.98
- GRM
- 10.7
CMA / ARV
- ARV (on-the-fly)
- $172,368
- Comps found
- 12
Show comp detail 12 sales within ~0.75 mi
| Address | Dist | Beds/Ba | Sqft | Sold | Price | $/sf | Match |
|---|---|---|---|---|---|---|---|
| 9847 Scepter Ave | 0.15mi | 2/2.0 | 1,248 (-4%) | 0mo | $154,000 | $123 | 86 |
| 9847 Scepter Ave | 0.15mi | 2/2.0 | 1,248 (-4%) | 0mo | $154,000 | $123 | 86 |
| 9155 Fontaine Dr | 0.48mi | 2/2.0 | 1,296 (0%) | 2mo | $172,200 | $133 | 76 |
| 14311 Action St | 0.26mi | 3/2.0 (+1) | 1,369 (+6%) | 1mo | $230,000 | $168 | 72 |
| 9259 Salvini Dr | 0.19mi | 2/2.0 | 1,152 (-11%) | 1mo | $165,000 | $143 | 72 |
| 15682 Brookridge Blvd | 0.10mi | 2/2.0 | 1,104 (-15%) | 0mo | $144,000 | $130 | 70 |
| 14298 Action St | 0.28mi | 2/2.0 | 1,448 (+12%) | 2mo | $210,000 | $145 | 66 |
| 8271 Modena Ave | 0.71mi | 2/2.0 | 1,265 (-2%) | 0mo | $107,000 | $85 | 63 |
| 9128 Scepter Ave | 0.74mi | 3/2.0 (+1) | 1,280 (-1%) | 0mo | $183,000 | $143 | 58 |
| 14883 Rialto Ave | 0.55mi | 2/2.0 | 1,144 (-12%) | 0mo | $148,000 | $129 | 54 |
| 8223 Fortune Hunter Dr | 0.64mi | 2/2.0 | 1,176 (-9%) | 1mo | $100,000 | $85 | 54 |
| 16229 Brookridge Blvd | 0.67mi | 3/2.0 (+1) | 1,380 (+6%) | 0mo | $215,000 | $156 | 52 |
Match score weights: distance 35% · size 25% · config 20% · recency 20%. Top-matched comps best support the ARV.
Projected returns pro-forma
-3.0% appreciation · 3.0% rent growth · sell at horizon
- IRR
- -17.0%
- Equity multiple
- 0.40×
- Total profit
- $-35,293
- Equity at exit
- $31,297
- IRR
- -8.9%
- Equity multiple
- 0.45×
- Total profit
- $-32,556
- Equity at exit
- $18,148
Cash invested: $58,772 (down + closing). Projections, not guarantees.
Landlord ↔ Tenant lean methodology
- Overall (STATE)
- 87 Strongly Landlord-Friendly
- State Florida
- 87 Strongly Landlord-Friendly · R+3
- County
- — inherits STATE
- City
- — inherits STATE
ZIP-level market 34613
- Home prices YoY
- -17.2%
- Active inventory
- 691
- Price-to-rent
- 10.7×
Monthly cashflow live
- Estimated rent
- $1,631 high interval (Pro) →
- Mortgage (P&I)
- −$1,101
- Tax from tax record
- −$64 /mo · $770/yr
- Insurance
- −$87
- HOA
- −$55
- Vacancy / Maint / Mgmt
- −$342
- Net cashflow
- $-19
Break-even live
UW: 25.0% down · 7.5% · 30yr · 1.5% tax · 5.0% vac · 8.0% maint · 8.0% mgmt
Financing live
Cash to close
- Down payment
- $52,475
- Closing costs
- $6,297
- Reserves months
- —
- Total cash needed
- —
Loan-product check · same deal, 3 products live
Conventional
25% down · 7.5% · 30yr
- Down + closing
- —
- Monthly P&I
- —
- Monthly cashflow
- —
- DSCR
- —
- Eligible?
- —
Personal DTI + credit; lowest rate.
DSCR
20% down · 8.5% · 30yr
- Down + closing
- —
- Monthly P&I
- —
- Monthly cashflow
- —
- DSCR
- —
- Eligible?
- —
No personal income docs; deal must DSCR.
Hard money
10% down · 12.0% · 12mo
- Down + closing
- —
- Monthly P&I
- —
- Monthly cashflow
- —
- DSCR
- —
- Eligible?
- —
Short-term bridge; refi at stabilization.
Rent comps 10 comps
| Address | Beds | Baths | Sqft | Rent | $/sqft | DOM | Units | Dist |
|---|---|---|---|---|---|---|---|---|
| 9919 Scepter Ave Brooksville, FL | 3.0 | 2.0 | 1188 | $1,250 | $1.05 | 4d | 1 | 0.21mi |
| 8871 Southern Charm Cir Brooksville, FL | 3.0 | 2.0 | 1482 | $2,050 | $1.38 | 24d | 1 | 0.53mi |
| 8761 Fetterbush Ct Brooksville, FL | 3.0 | 2.0 | 1730 | $1,850 | $1.07 | 24d | 1 | 0.54mi |
| 8917 Southern Charm Cir Brooksville, FL | 3.0 | 2.0 | 1437 | $1,695 | $1.18 | 3d | 1 | 0.54mi |
| 8407 Weatherford Ave Brooksville, FL | 2.0 | 2.0 | 1104 | $1,500 | $1.36 | 17d | 1 | 0.68mi |
| 9289 Scepter Ave Brooksville, FL | 3.0 | 2.0 | 1512 | $1,400 | $0.93 | 4d | 1 | 0.71mi |
| 9356 Southern Charm Cir Brooksville, FL | 3.0 | 2.0 | 1621 | $1,800 | $1.11 | 24d | 1 | 0.86mi |
| 14131 Lemon Yellow Tree Ln Brooksville, FL | 3.0 | 2.0 | 1840 | $1,979 | $1.08 | 4d | 1 | 0.87mi |
| 14342 Starcross St Brooksville, FL | 2.0 | 1.0 | 900 | $1,025 | $1.14 | 21d | 1 | 1.10mi |
| 14697 Brookridge Blvd Brooksville, FL | 2.0 | 2.0 | 1056 | $1,350 | $1.28 | 24d | 1 | 1.39mi |
HOA detail
- Monthly dues
- $55 · $660/yr
Listing history 19 events
-
2026-06-18days on market $209,900 Active 111 DOM
-
2026-06-17days on market $209,900 Active 110 DOM
-
2026-06-16days on market $209,900 Active 109 DOM
-
2026-06-15days on market $209,900 Active 108 DOM
-
2026-06-13days on market $209,900 Active 106 DOM
-
2026-06-13days on market $209,900 Active 105 DOM
-
2026-06-09days on market $209,900 Active 102 DOM
-
2026-06-08days on market $209,900 Active 101 DOM
-
2026-06-07pricedays on market $209,900 Active 100 DOM
-
2026-06-04days on market $224,900 Active 97 DOM
-
2026-06-03days on market $224,900 Active 96 DOM
-
2026-06-02days on market $224,900 Active 95 DOM
-
2026-06-01days on market $224,900 Active 94 DOM
-
2026-05-31days on market $224,900 Active 93 DOM
-
2026-05-20price $224,900
-
2026-04-07price $234,907
-
2026-02-25$239,900 Active
-
1993-07-13soldstatus $61,100
-
1993-06-09soldstatus $10,000
ⓘ Source: listings_history table (triggers on properties + properties_extension) + one-shot
backfill from property_details.listing_events for pre-trigger history.
Tax reassessment forecast FL · Resets to sale price
- Current annual tax
- $770 · $64/mo
- Projected year-2 tax
- $1,742 · $145/mo
- Expected delta
- +$972/yr (+$81/mo · 126.1%)
ⓘ Screening estimate from a state-policy table — verify with the county assessor before closing.
Climate risk First Street
- Flood 1/10 Low FEMA zone X (unshaded) · 0% chance over 30 yrs
- Wildfire 5/10 Major
- Heat 10/10 Extreme 7 d/yr ≥109°F today · 25 d/yr by 30 yrs out
- Wind 9/10 Extreme 99% chance of damaging wind over 30 yrs
- Air quality 2/10 Low 1 unhealthy d/yr today · 1 by 30 yrs out
Nearby sold comps map
Loading sold comps map…
Walkable amenities ~0.75 mi
Loading nearby amenities…
Taxation est. · year 1
- Rental income
- $19,569
- − Mortgage interest
- −$11,758
- − Property taxes
- −$770
- − Insurance
- −$1,050
- − Repairs & maintenance
- −$1,566
- − Management
- −$1,566
- − HOA
- −$660
- − Depreciation
- −$6,106
- Taxable loss
- −$3,906
- Est. tax savings @ 24.0%
- +$937
- After-tax cash flow
- $708/yr
For passive investors: Depreciation is non-cash, so a rental often shows a tax loss while cash-flowing — sheltering income. Rental losses are passive: they offset passive income freely, and up to $25,000/yr can offset ordinary (W-2) income if you actively participate and your MAGI is under $100k (phasing out to $0 by $150k); unused losses carry forward. On sale, claimed depreciation is recaptured at up to 25%, and gains may owe capital-gains tax (a 1031 exchange can defer both). Figures are a year-1 estimate at your 24.0% rate — not tax advice; consult a CPA.
Schools (NCES district)
- District
- Hernando
- NCES district ID
- 1200810
- Math proficiency
- 50% ▼ -8.00%
- Reading proficiency
- 50% ▼ -4.00%
- Median HH income
- $41,985
- Composite
- 42.03/100
- National rank
- #3329
- State rank
- #38 of 73 in FL
Livability — Brookridge
- Score
- 70/100
- State rank
- #421
- US rank
- #7529
Category grades
Schools grade is shown separately in the Schools card above.
Census & demographics
- Census place
- Brookridge, FL
- County
- Hernando County · 169,677 people
- Metro
- Tampa-St. Petersburg-Clearwater, FL
- Population (ZIP)
- 19,337
- Household income
- $58,596
- Rent vs Own
- Severe rent burden
- 307.0
Population outlook (Hernando County) Hauer SSP2
- Today (2025)
- 189,218 people
- By 2030
- 194,367 · +2.7%
- By 2040
- 203,398 · +7.5%
- By 2050
- 209,589 · +10.8%
- By 2075
- 218,452 · +15.4%
- By 2100
- 205,923 · +8.8%
Race, ethnicity, and origin ACS 2023
- Neighborhood character
- Predominantly White (88%)
- Race & ethnicity
- White 88% Hispanic / Latino 6% Two or more races 4% Black 2% Asian 1%
- Hispanic origin (detail)
- Mexican 1% Puerto Rican 2% Cuban 1%
- Common ancestry
- Romanian 4% Lithuanian 3% Slovak 2%
- Foreign-born
- 8% · Canada, Vietnam
- Languages at home
- 92% English-only · Spanish 3% French/Haitian/Cajun 1% Russian/Polish/Slavic 1%
Political lean MEDSL · Hernando
- 2024 margin
- Solid R (+37.0) · D 31.1% · R 68.2%
- 2008→2024 swing
- -33.5pp toward R · 2008: -3.6pp · 2024: -37.0pp
- All cycles
- 2024: R+37.0 2020: R+30.2 2016: R+29.0 2012: R+8.5 2008: R+3.6
Not yet ingested
- Civics
- —
Market trends
- HPI YoY
- ▼ -57.51%
- Current HPI
- 276.2229
- Rent YoY
- —
- Metro
- Tampa-St. Petersburg-Clearwater, FL
- State GDP YoY
- ▲ 3.28%
- F500 in state
- 36
Industry mix (Fortune 500 HQ in FL)
| Industry | F500 HQs | Revenue |
|---|---|---|
| Industrial Technology | 2 | $29B |
|
||
| Insurance | 2 | $17B |
|
||
| Retail | 1 | $60B |
|
||
| Technology Distribution | 1 | $58B |
|
||
| Homebuilding | 1 | $35B |
|
||
| Technology Manufacturing | 1 | $35B |
|
||
Price history
+2149.0% since first listed5 events — show timeline
- 2026-05-20 Price Changed $224,900 HCAR
- 2026-04-07 Price Changed $234,907 HCAR
- 2026-02-25 Listed $239,900 HCAR
- 1993-07-13 Sold (Public Records) $61,100 Public Records
- 1993-06-09 Sold (Public Records) $10,000 Public Records
Property tax history
+3.8%/yrLatest (2025): $770 · +1.4% YoY. Source: county tax records.
Cash-flow waterfall
monthlySold comps — $/sqft
last 12 mo · ≤1 miLoading sold comps…