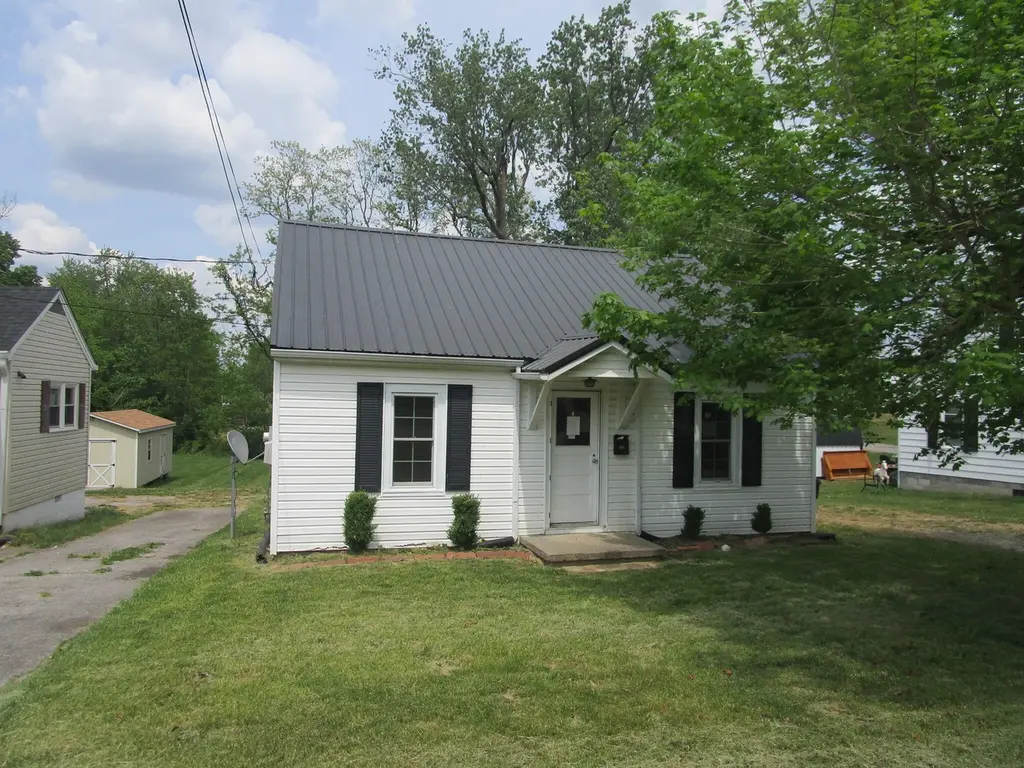
107 Cowden Ct · Lancaster, KY
Flood risk 7/10 · Major
- FEMA flood zone
- X (unshaded)
- Chance of flooding over 30 yrs
- 0.99%
- Est. flood insurance / yr
- $507 – $1,088
Fire risk 4/10 · Minor
- Est. fire insurance / yr
- $839 – $1,559
Heat risk 4/10 · Minor
- Hot days now (above 102°F)
- 7 days/yr
- Hot days in 30 yrs
- 20 days/yr
Wind risk 2/10 · Minimal
- Chance of severe wind over 30 yrs
- 4.0%
Air-quality risk 1/10 · Minimal
- Unhealthy air days now
- 0 days/yr
- Unhealthy air days in 30 yrs
- 0 days/yr
Risk factors via First Street. Map © Google.
Why this score? — see what drove the B- grade
The composite is a weighted blend of 9 inputs, each scored 0–100. Each bar is that input's sub-score; the figure is the points it added to the 100-point composite (weight × sub-score).
- Cash flow +30.0/30.0
- 1% rule +10.0/10.0
- DSCR +10.0/10.0
- ARV discount +7.5/15.0
- Livability +3.2/5.0
- Schools +3.0/10.0
- Rent growth +2.5/5.0
- Condition / age +2.5/5.0
- Appreciation +1.0/10.0
$95,500
🖨 Deal sheet (PDF) 📄 Offer letter ✓ Due diligence
Listing remarks MLS
Professional Photos Coming Wednesday! Charming three bedroom one bath home conveniently located near downtown Lancaster! You'll love this move in ready home, with two bedrooms on first the floor and a spacious second floor bedroom. The large lot has plenty of room for you to entertain, add a garage, or fence it in for added privacy. Great location, quiet street, and cute as a button. Call today for your personal tour!
Key facts
- Convenient location
- Spacious living room
- 0.28 acre lot
Tags
Property features AI
Exterior
- Parking: Driveway
- Utilities: Public water; Public sewer; Electricity connected; Sewer connected
- Home design: House; One and one-half stories
- Construction: Vinyl siding; Block foundation; Metal roof; Built with 968 total building area
- Exterior features: Tree and neighborhood views; Not waterfront
Interior
- Kitchen: Eat-in layout
- Flooring: Vinyl flooring
- Bathrooms: 1 full bathroom
- Heating & cooling: Electric heating; Heat pump; Electric cooling; Heat pump cooling
- Interior features: Eat-in kitchen; Concrete partial unfinished basement with exterior entry; No fireplace
- Laundry & utility: Washer hookup; Electric dryer hookup
Neighborhood map
What this means for you Summary
Snapshot
- This is a 2-bed/1.0-bath other listed at $96k.
Deal economics
- At list price, monthly cash flow is $695 ($8k/yr) — positive.
- The deal already cash-flows at list — no discount required.
- Meets the 1% rule at list price ($2k rent vs $96k).
- Recommended offer: $94k (1.5% below list) — sets the bar for market timing.
Location & tenants
- Location reads 63/100 on livability (#314 in KY) — a middle-class / working-renter tenant base. Strengths: crime A+, cost of living A+, housing A-; Watch: health & safety D+, amenities F, commute F.
- Garrard County (rural): math 28% / reading 42% proficiency, ranked #63 of 165 in KY (top 38%) — families likely to look elsewhere, expect single-tenant / working-renter base with shorter leases.
- Zoned schools: Lancaster Elementary School (math 37% / reading 37%, grade F, #255 of 676 statewide, top 42%, 469 students, 80% FRL); Garrard County High School (math 27% / reading 37%, grade F, #97 of 254 statewide, top 46%, 801 students, 59% FRL) — zoned schools average 70% FRL vs 50% district-wide (20 pts higher); higher-poverty schools than district average — tighter screening recommended.
- Market conditions: 168 active listings in the ZIP.
Forward outlook
- Local home prices are declining (-3.0%/yr); year-one equity from $660 of loan paydown is wiped out by about $3k of value loss. Plan a longer hold.
- At projected returns (-3.0% appreciation + 3.0% rent growth), your $27k cash investment doubles in ~4 years — after that, you're playing with house money.
Negotiation context
- It's been on market 18 days — a 2% lower offer ($94k) is reasonable based on typical stale-listing flexibility.
- 5 sale attempts since 6y ago with the ask held roughly flat each time — persistent listings suggest the price (not the market) is what's stuck; bring a comps-based counter.
Risks & watch-outs
- Watch-outs: flood insurance adds $66/mo; built in 1947 — expect roof / HVAC / electrical / plumbing capex.
- Climate carrying-cost: major flood risk — expect insurance premiums to compound above CPI over the hold.
Questions for the listing agent
- Built in 1947 — when were the roof, HVAC, electrical panel, plumbing, and water heater last replaced?
- What's the actual annual flood-insurance premium (NFIP or private), and is the property in a SFHA with mandatory coverage?
- Is there a deadline driving the sale (1031 exchange, divorce, estate, relocation)? That informs how much negotiation room exists.
- Schools are D-rated, which usually means shorter tenancies and higher turnover. Who's the typical renter profile here, and what's been the actual vacancy rate?
- What's the average days-on-market for RENTAL listings here right now (not sales)? A rising rental-DOM trend means longer vacancies and softer asking-rent achievability than the comps imply.
- What's the recent tenant-quality profile in this submarket — average credit score on applications, eviction rate, late-payment / NSF rate, and stable-employment percentage? A property-management company in the area should have these aggregated.
- How much new for-sale + rental construction is in the pipeline within 1–3 miles? Heavy new supply typically softens prices + rents 12–24 months out; constrained supply supports both.
Investment metrics
- 1% rule
- 1.88% ✓
- Cap rate
- 15.86%
- Cash-on-cash
- 34.17%
- DSCR
- 2.52
- GRM
- 4.4
CMA / ARV
No comps found within radius.
Projected returns pro-forma
-3.0% appreciation · 3.0% rent growth · sell at horizon
- IRR
- 26.1%
- Equity multiple
- 2.08×
- Total profit
- $28,859
- Equity at exit
- $14,239
- IRR
- 33.7%
- Equity multiple
- 4.08×
- Total profit
- $82,407
- Equity at exit
- $8,257
Cash invested: $26,740 (down + closing). Projections, not guarantees.
Landlord ↔ Tenant lean methodology
- Overall (STATE)
- 83 Strongly Landlord-Friendly
- State Kentucky
- 83 Strongly Landlord-Friendly · R+16
- County
- — inherits STATE
- City
- — inherits STATE
ZIP-level market 40444
- Home prices YoY
- -2.6%
- Active inventory
- 168
- Price-to-rent
- 4.4×
Monthly cashflow live
- Estimated rent
- $1,799 medium interval (Pro) →
- Mortgage (P&I)
- −$501
- Tax from tax record
- −$119 /mo · $1,433/yr
- Insurance
- −$40
- Flood insurance flood zone
- −$66 /mo · $798/yr
- HOA
- −$0
- Vacancy / Maint / Mgmt
- −$378
- Net cashflow
- $695
Break-even live
Sensitivity live
| Price | -10% $749 | -5% $722 | +0% $695 | +5% $668 | +10% $641 |
|---|---|---|---|---|---|
| Rent | -10% $553 | -5% $624 | +0% $695 | +5% $766 | +10% $837 |
| Rate | -1.0pp $743 | -0.5pp $719 | base $695 | +0.5pp $670 | +1.0pp $645 |
UW: 25.0% down · 7.5% · 30yr · 1.5% tax · 5.0% vac · 8.0% maint · 8.0% mgmt
Financing live
Cash to close
- Down payment
- $23,875
- Closing costs
- $2,865
- Reserves months
- —
- Total cash needed
- —
Loan-product check · same deal, 3 products live
Conventional
25% down · 7.5% · 30yr
- Down + closing
- —
- Monthly P&I
- —
- Monthly cashflow
- —
- DSCR
- —
- Eligible?
- —
Personal DTI + credit; lowest rate.
DSCR
20% down · 8.5% · 30yr
- Down + closing
- —
- Monthly P&I
- —
- Monthly cashflow
- —
- DSCR
- —
- Eligible?
- —
No personal income docs; deal must DSCR.
Hard money
10% down · 12.0% · 12mo
- Down + closing
- —
- Monthly P&I
- —
- Monthly cashflow
- —
- DSCR
- —
- Eligible?
- —
Short-term bridge; refi at stabilization.
Listing history 15 events
-
2026-06-19days on market $95,500 Active 18 DOM
-
2026-06-18days on market $95,500 Active 17 DOM
-
2026-06-17days on market $95,500 Active 16 DOM
-
2026-06-16days on market $95,500 Active 15 DOM
-
2026-06-15days on market $95,500 Active 14 DOM
-
2026-06-14days on market $95,500 Active 12 DOM
-
2026-06-13days on market $95,500 Active 11 DOM
-
2026-06-10days on market $95,500 Active 9 DOM
-
2026-06-09days on market $95,500 Active 8 DOM
-
2026-06-08days on market $95,500 Active 7 DOM
-
2026-06-07days on market $95,500 Active 6 DOM
-
2026-06-05days on market $95,500 Active 3 DOM
-
2026-06-03days on market $95,500 Active 2 DOM
-
2026-06-02remarks 338-char remark
-
2026-06-02$95,500 Active 1 DOM
ⓘ Source: listings_history table (triggers on properties + properties_extension) + one-shot
backfill from property_details.listing_events for pre-trigger history.
Tax reassessment forecast KY · Resets to sale price
- Current annual tax
- $1,433 · $119/mo
- Projected year-2 tax
- $1,433 · $119/mo
- Expected delta
- $0/yr ($0/mo · 0.0%)
ⓘ Screening estimate from a state-policy table — verify with the county assessor before closing.
Climate risk First Street
- Flood 7/10 Severe FEMA zone X (unshaded) · 99% chance over 30 yrs
- Wildfire 4/10 Moderate
- Heat 4/10 Moderate 7 d/yr ≥102°F today · 20 d/yr by 30 yrs out
- Wind 2/10 Low 4% chance of damaging wind over 30 yrs
- Air quality 1/10 Low 0 unhealthy d/yr today · 0 by 30 yrs out
Nearby sold comps map
Loading sold comps map…
Walkable amenities ~0.75 mi
Loading nearby amenities…
Taxation est. · year 1
- Rental income
- $21,593
- − Mortgage interest
- −$5,349
- − Property taxes
- −$1,433
- − Insurance
- −$1,275
- − Repairs & maintenance
- −$1,727
- − Management
- −$1,727
- − Depreciation
- −$2,778
- Taxable income
- $7,302
- Est. tax owed @ 24.0%
- −$1,752
- After-tax cash flow
- $6,588/yr
For passive investors: Depreciation is non-cash, so a rental often shows a tax loss while cash-flowing — sheltering income. Rental losses are passive: they offset passive income freely, and up to $25,000/yr can offset ordinary (W-2) income if you actively participate and your MAGI is under $100k (phasing out to $0 by $150k); unused losses carry forward. On sale, claimed depreciation is recaptured at up to 25%, and gains may owe capital-gains tax (a 1031 exchange can defer both). Figures are a year-1 estimate at your 24.0% rate — not tax advice; consult a CPA.
Schools (NCES district)
- District
- Garrard County
- NCES district ID
- 2102160
- Math proficiency
- 28% ▼ -12.00%
- Reading proficiency
- 42% ▼ -11.00%
- Median HH income
- $43,411
- Composite
- 29.67/100
- National rank
- #6462
- State rank
- #63 of 165 in KY
Livability — Lancaster
- Score
- 63/100
- State rank
- #314
- US rank
- #15040
Category grades
Schools grade is shown separately in the Schools card above.
Census & demographics
- Census place
- Lancaster, KY
- Population (ZIP)
- 14,207
Population outlook (Garrard County) Hauer SSP2
- Today (2025)
- 17,852 people
- By 2030
- 18,018 · +0.9%
- By 2040
- 18,076 · +1.3%
- By 2050
- 17,592 · -1.5%
- By 2075
- 16,128 · -9.7%
- By 2100
- 13,489 · -24.4%
Race, ethnicity, and origin ACS 2023
- Neighborhood character
- Predominantly White (91%)
- Race & ethnicity
- White 91% Two or more races 4% Hispanic / Latino 3% Black 3%
- Common ancestry
- Italian 1% Subsaharan African 1% Slovak 1%
- Foreign-born
- 3% · Canada, Dominican Republic
- Languages at home
- 97% English-only · Spanish 1% Russian/Polish/Slavic 1%
Political lean MEDSL · Garrard
- 2024 margin
- Solid R (+60.2) · D 19.3% · R 79.5% · Other 1.3%
- 2008→2024 swing
- -17.1pp toward R · 2008: -43.1pp · 2024: -60.2pp
- All cycles
- 2024: R+60.2 2020: R+56.6 2016: R+58.5 2012: R+51.6 2008: R+43.1
Not yet ingested
- Civics
- —
Market trends
- HPI YoY
- ▼ -8.08%
- Current HPI
- 297.6233
- Rent YoY
- —
- Metro
- —
- State GDP YoY
- ▲ 1.81%
- F500 in state
- 4
Industry mix (Fortune 500 HQ in KY)
| Industry | F500 HQs | Revenue |
|---|---|---|
| Healthcare | 1 | $118B |
|
||
| Food / Beverage | 1 | $7B |
|
||
Price history
+228.2% since first listed20 events — show timeline
- 2026-06-01 Listed $95,500 ImagineMLS
- 2023-08-23 Sold (Public Records) $128,500 Public Records
- 2023-08-17 Sold (MLS) $128,500 ImagineMLS
- 2023-07-04 Contingent — ImagineMLS
- 2023-06-30 Listed $125,000 ImagineMLS
- 2021-03-08 Sold (Public Records) $77,000 Public Records
- 2021-02-26 Sold (MLS) $77,000 ImagineMLS
- 2020-12-31 Pending — ImagineMLS
- 2020-12-03 Relisted — ImagineMLS
- 2020-10-28 Pending — ImagineMLS
- 2020-10-28 Price Changed $74,900 ImagineMLS
- 2020-10-27 Price Changed $72,900 ImagineMLS
- 2020-10-21 Price Changed $67,900 ImagineMLS
- 2020-10-16 Price Changed $69,900 ImagineMLS
- 2020-10-01 Listed $72,500 ImagineMLS
- 2020-09-11 Sold (Public Records) $64,000 Public Records
- 2020-09-10 Sold (MLS) $64,000 ImagineMLS
- 2020-09-08 Pending — ImagineMLS
- 2020-09-03 Listed $69,900 ImagineMLS
- 2015-04-30 Sold (Public Records) $29,100 Public Records
Property tax history
+13.8%/yrLatest (2025): $1,433 · -0.4% YoY. Source: county tax records.
Cash-flow waterfall
monthlySold comps — $/sqft
last 12 mo · ≤1 miLoading sold comps…