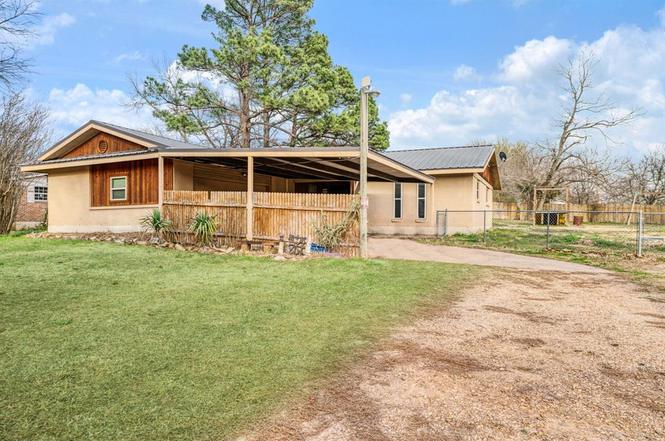
970 Mansfield Rd · Reno, TX
Flood risk 1/10 · Minimal
- FEMA flood zone
- X (unshaded)
- Chance of flooding over 30 yrs
- 0.0%
- Est. flood insurance / yr
- $507 – $1,088
Fire risk 6/10 · Moderate
- Est. fire insurance / yr
- $1,222 – $2,270
Heat risk 7/10 · Major
- Hot days now (above 110°F)
- 7 days/yr
- Hot days in 30 yrs
- 22 days/yr
Wind risk 4/10 · Minor
- Chance of severe wind over 30 yrs
- 20.0%
Air-quality risk 2/10 · Minimal
- Unhealthy air days now
- 0 days/yr
- Unhealthy air days in 30 yrs
- 1 days/yr
Risk factors via First Street. Map © Google.
Why this score? — see what drove the D+ grade
The composite is a weighted blend of 9 inputs, each scored 0–100. Each bar is that input's sub-score; the figure is the points it added to the 100-point composite (weight × sub-score).
- Cash flow +14.8/30.0
- ARV discount +11.1/15.0
- DSCR +4.5/10.0
- 1% rule +4.0/10.0
- Schools +3.8/10.0
- Livability +3.0/5.0
- Rent growth +2.5/5.0
- Condition / age +2.5/5.0
- Appreciation +0.0/10.0
$175,000
🖨 Deal sheet (PDF) 📄 Offer letter ✓ Due diligence
Listing remarks
Peaceful Country Living on . 51 Acres!Welcome to this charming 3-bedroom, 2-bath home nestled on a quiet country road in Lamar County. Situated on approximately . 51 acres, this property offers the perfect blend of comfort, functionality, and outdoor space. The home features a 2-car garage plus a spacious 2-car carport across the front, providing ample covered parking for family and guests. Inside, you’ll find a comfortable layout ideal for everyday living. Step outside to enjoy the fully fenced yard, perfect for pets, kids, or gardening. The backyard also includes a storage building for your tools and equipment, along with a private well for outdoor watering, helping keep your landsc
Key facts
- Private well
- Storage building
- Fully fenced yard
Tags
Neighborhood map
What this means for you Summary
Snapshot
- This is a 3-bed/2.0-bath single-family listed at $175k.
Deal economics
- At list price, monthly cash flow is $48 ($575/yr) — positive.
- The deal already cash-flows at list — no discount required.
- To meet the 1% rule (rent ≥ 1% of price), the offer needs to be $158k (9.7% below list).
- Recommended offer: $158k (9.7% below list) — sets the bar for 1% rule.
- Cap rate 6.6% vs local median 2.0% in Reno — top-decile yield for the area; either an underpriced asset or a hidden risk that comps aren't pricing in. Stress-test before assuming the spread holds.
Location & tenants
- Location reads 59/100 on livability (#1,131 in TX) — a working-class tenant base; expect higher turnover. Strengths: cost of living A+, housing A+, crime A; Watch: employment D+, amenities F, commute F.
- North Lamar ISD (rural): math 43% / reading 45% proficiency, ranked #275 of 826 in TX (top 33%) — families likely to look elsewhere, expect single-tenant / working-renter base with shorter leases.
- Zoned schools: Frank Stone Middle (math 45% / reading 45%, grade D, #479 of 1,662 statewide, top 29%, 528 students, 55% FRL); North Lamar H S (math 42% / reading 57%, grade D, #509 of 1,632 statewide, top 34%, 727 students, 46% FRL).
- Market conditions: 124 active listings in the ZIP; 119 units permitted in Lamar County in 2024 (71 in 5+ unit buildings).
Forward outlook
- Local home prices are declining (-3.0%/yr); year-one equity from $1k of loan paydown is wiped out by about $5k of value loss. Plan a longer hold.
- Lamar County population projected at -13% by 2050 — secular population decline; favor cash flow + early exit over multi-decade hold.
Negotiation context
- It's been on market 48 days — a 3% lower offer ($170k) is reasonable based on typical stale-listing flexibility.
Risks & watch-outs
- Climate carrying-cost: major wildfire risk; extreme-heat days projected 7→22/yr by 2055 (HVAC capex compounding) — expect insurance premiums to compound above CPI over the hold.
Questions for the listing agent
- It's been on market 48 days. Have you received any prior offers? Is the seller open to a 10% concession, seller financing, or rate buy-down credit?
- Is there a deadline driving the sale (1031 exchange, divorce, estate, relocation)? That informs how much negotiation room exists.
- Schools are D-rated, which usually means shorter tenancies and higher turnover. Who's the typical renter profile here, and what's been the actual vacancy rate?
- The area grade is low — what's the realistic commute time and amenity access for the typical tenant pool here? Any planned neighborhood developments (good or bad) we should know about?
- What's the average days-on-market for RENTAL listings here right now (not sales)? A rising rental-DOM trend means longer vacancies and softer asking-rent achievability than the comps imply.
- What's the recent tenant-quality profile in this submarket — average credit score on applications, eviction rate, late-payment / NSF rate, and stable-employment percentage? A property-management company in the area should have these aggregated.
- How much new for-sale + rental construction is in the pipeline within 1–3 miles? Heavy new supply typically softens prices + rents 12–24 months out; constrained supply supports both.
Investment metrics
- 1% rule
- 0.90% ✗
- Cap rate
- 6.62%
- Cash-on-cash
- 1.17%
- DSCR
- 1.05
- GRM
- 9.2
CMA / ARV
- ARV (on-the-fly)
- $190,280
- Comps found
- 9
Show comp detail 9 sales within ~0.75 mi
| Address | Dist | Beds/Ba | Sqft | Sold | Price | $/sf | Match |
|---|---|---|---|---|---|---|---|
| 970 Mansfield Rd | 0.00mi | 3/2.0 | 1,420 (0%) | 1mo | $175,000 | $123 | 99 |
| 850 Lee Cir | 0.11mi | 3/2.0 | 1,367 (-4%) | 13mo | $179,900 | $132 | 78 |
| 140 Laredo | 0.38mi | 3/1.5 | 1,442 (+2%) | 15mo | $190,000 | $132 | 66 |
| 605 Mansfield Rd | 0.20mi | 3/2.0 | 1,311 (-8%) | 22mo | $235,900 | $180 | 60 |
| 1135 Cope Dr | 0.73mi | 2/1.5 (-1) | 1,408 (-1%) | 3mo | $155,000 | $110 | 55 |
| 1045 Braydan Dr | 0.26mi | 3/2.0 | 1,574 (+11%) | 20mo | $280,000 | $178 | 54 |
| 4565 Pine Mill Rd | 0.68mi | 3/2.5 | 1,493 (+5%) | 12mo | $199,900 | $134 | 47 |
| 195 Comanche Cir | 0.47mi | 4/1.0 (+1) | 1,306 (-8%) | 13mo | $184,999 | $142 | 45 |
| 4845 Eastgate | 0.73mi | 3/2.0 | 1,231 (-13%) | 13mo | $217,000 | $176 | 33 |
Match score weights: distance 35% · size 25% · config 20% · recency 20%. Top-matched comps best support the ARV.
Projected returns pro-forma
-3.0% appreciation · 3.0% rent growth · sell at horizon
- IRR
- -14.4%
- Equity multiple
- 0.48×
- Total profit
- $-25,290
- Equity at exit
- $26,093
- IRR
- -5.7%
- Equity multiple
- 0.63×
- Total profit
- $-18,020
- Equity at exit
- $15,131
Cash invested: $49,000 (down + closing). Projections, not guarantees.
Landlord ↔ Tenant lean methodology
- Overall (STATE)
- 87 Strongly Landlord-Friendly
- State Texas
- 87 Strongly Landlord-Friendly · R+5
- County
- — inherits STATE
- City
- — inherits STATE
ZIP-level market 75462
- Home prices YoY
- -19.0%
- Active inventory
- 124
- Price-to-rent
- 9.2×
Monthly cashflow live
- Estimated rent
- $1,581 medium interval (Pro) →
- Mortgage (P&I)
- −$918
- Tax from tax record
- −$210 /mo · $2,522/yr
- Insurance
- −$73
- HOA
- −$0
- Lot rent
- −$0
- Vacancy / Maint / Mgmt
- −$332
- Net cashflow
- $48
Break-even live
Sensitivity live
| Price | -10% $147 | -5% $97 | +0% $48 | +5% $-2 | +10% $-51 |
|---|---|---|---|---|---|
| Rent | -10% $-77 | -5% $-15 | +0% $48 | +5% $110 | +10% $173 |
| Rate | -1.0pp $136 | -0.5pp $92 | base $48 | +0.5pp $3 | +1.0pp $-44 |
UW: 25.0% down · 7.5% · 30yr · 1.5% tax · 5.0% vac · 8.0% maint · 8.0% mgmt
Financing live
Cash to close
- Down payment
- $43,750
- Closing costs
- $5,250
- Reserves months
- —
- Total cash needed
- —
Loan-product check · same deal, 3 products live
Conventional
25% down · 7.5% · 30yr
- Down + closing
- —
- Monthly P&I
- —
- Monthly cashflow
- —
- DSCR
- —
- Eligible?
- —
Personal DTI + credit; lowest rate.
DSCR
20% down · 8.5% · 30yr
- Down + closing
- —
- Monthly P&I
- —
- Monthly cashflow
- —
- DSCR
- —
- Eligible?
- —
No personal income docs; deal must DSCR.
Hard money
10% down · 12.0% · 12mo
- Down + closing
- —
- Monthly P&I
- —
- Monthly cashflow
- —
- DSCR
- —
- Eligible?
- —
Short-term bridge; refi at stabilization.
Listing history 4 events
-
2026-04-17status Pending
-
2026-02-28$175,000 Active
-
2018-03-19soldstatus
-
2014-08-08soldstatus
ⓘ Source: listings_history table (triggers on properties + properties_extension) + one-shot
backfill from property_details.listing_events for pre-trigger history.
Tax reassessment forecast TX · Resets to sale price
- Current annual tax
- $2,522 · $210/mo
- Projected year-2 tax
- $3,202 · $267/mo
- Expected delta
- +$680/yr (+$57/mo · 27.0%)
ⓘ Screening estimate from a state-policy table — verify with the county assessor before closing.
Climate risk First Street
- Flood 1/10 Low FEMA zone X (unshaded) · 0% chance over 30 yrs
- Wildfire 6/10 Major
- Heat 7/10 Severe 7 d/yr ≥110°F today · 22 d/yr by 30 yrs out
- Wind 4/10 Moderate 20% chance of damaging wind over 30 yrs
- Air quality 2/10 Low 0 unhealthy d/yr today · 1 by 30 yrs out
Nearby sold comps map
Loading sold comps map…
Walkable amenities ~0.75 mi
Loading nearby amenities…
Taxation est. · year 1
- Rental income
- $18,967
- − Mortgage interest
- −$9,803
- − Property taxes
- −$2,522
- − Insurance
- −$875
- − Repairs & maintenance
- −$1,517
- − Management
- −$1,517
- − Depreciation
- −$5,091
- Taxable loss
- −$2,358
- Est. tax savings @ 24.0%
- +$566
- After-tax cash flow
- $1,140/yr
For passive investors: Depreciation is non-cash, so a rental often shows a tax loss while cash-flowing — sheltering income. Rental losses are passive: they offset passive income freely, and up to $25,000/yr can offset ordinary (W-2) income if you actively participate and your MAGI is under $100k (phasing out to $0 by $150k); unused losses carry forward. On sale, claimed depreciation is recaptured at up to 25%, and gains may owe capital-gains tax (a 1031 exchange can defer both). Figures are a year-1 estimate at your 24.0% rate — not tax advice; consult a CPA.
Schools (NCES district)
- District
- North Lamar ISD
- NCES district ID
- 4833010
- Math proficiency
- 43% ▼ -9.00%
- Reading proficiency
- 45% ▼ -4.00%
- Median HH income
- $53,328
- Composite
- 38.13/100
- National rank
- #4270
- State rank
- #275 of 826 in TX
Livability — Reno
- Score
- 59/100
- State rank
- #1131
- US rank
- #20008
Category grades
Schools grade is shown separately in the Schools card above.
Census & demographics
- Census place
- Reno, TX
- Population (ZIP)
- 11,651
Population outlook (Lamar County) Hauer SSP2
- Today (2025)
- 48,319 people
- By 2030
- 47,160 · -2.4%
- By 2040
- 44,621 · -7.7%
- By 2050
- 42,024 · -13.0%
- By 2075
- 36,577 · -24.3%
- By 2100
- 30,580 · -36.7%
Race, ethnicity, and origin ACS 2023
- Neighborhood character
- Predominantly White (82%)
- Race & ethnicity
- White 82% Two or more races 6% Hispanic / Latino 6% Black 5% Asian 2% Native American 1%
- Hispanic origin (detail)
- Mexican 5%
- Common ancestry
- Italian 2% Slovak 1% Lithuanian 1%
- Foreign-born
- 6% · Canada, Vietnam
- Languages at home
- 90% English-only · Spanish 5% Other Asian/Pacific 1% Russian/Polish/Slavic 1%
Political lean MEDSL · Lamar
- 2024 margin
- Solid R (+61.0) · D 19.2% · R 80.3%
- 2008→2024 swing
- -19.1pp toward R · 2008: -42.0pp · 2024: -61.0pp
- All cycles
- 2024: R+61.0 2020: R+57.4 2016: R+59.2 2012: R+50.3 2008: R+42.0
Not yet ingested
- Civics
- —
Market trends
- HPI YoY
- ▼ -47.01%
- Current HPI
- 200.7301
- Rent YoY
- —
- Metro
- —
- State GDP YoY
- ▲ 3.95%
- F500 in state
- 110
Industry mix (Fortune 500 HQ in TX)
| Industry | F500 HQs | Revenue |
|---|---|---|
| Energy | 16 | $1,198B |
|
||
| Technology | 5 | $198B |
|
||
| Engineering / Construction | 4 | $72B |
|
||
| Energy Services | 3 | $60B |
|
||
| Utilities | 3 | $41B |
|
||
| Healthcare | 2 | $330B |
|
||
Price history
4 events — show timeline
- 2026-04-17 Pending — NTREIS
- 2026-02-28 Listed $175,000 NTREIS
- 2018-03-19 Sold (Public Records) — Public Records
- 2014-08-08 Sold (Public Records) — Public Records
Property tax history
+4.2%/yrLatest (2025): $2,522 · +2.0% YoY. Source: county tax records.
Cash-flow waterfall
monthlySold comps — $/sqft
last 12 mo · ≤1 miLoading sold comps…