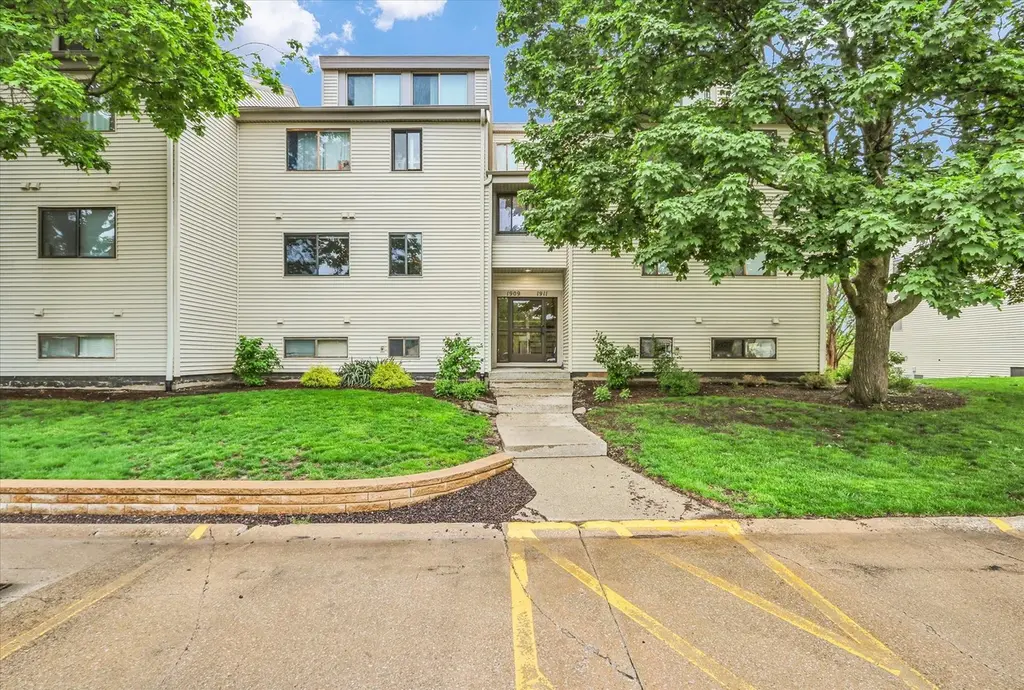
1909 Melrose Dr Unit B · Champaign, IL
Flood risk 4/10 · Minor
- FEMA flood zone
- X (unshaded)
- Chance of flooding over 30 yrs
- 0.21%
- Est. flood insurance / yr
- $507 – $1,088
Fire risk 1/10 · Minimal
- Est. fire insurance / yr
- $804 – $1,492
Heat risk 3/10 · Minor
- Hot days now (above 104°F)
- 7 days/yr
- Hot days in 30 yrs
- 19 days/yr
Wind risk 2/10 · Minimal
- Chance of severe wind over 30 yrs
- 1.0%
Air-quality risk 2/10 · Minimal
- Unhealthy air days now
- 0 days/yr
- Unhealthy air days in 30 yrs
- 1 days/yr
Risk factors via First Street. Map © Google.
Why this score? — see what drove the C grade
The composite is a weighted blend of 9 inputs, each scored 0–100. Each bar is that input's sub-score; the figure is the points it added to the 100-point composite (weight × sub-score).
- Cash flow +21.2/30.0
- ARV discount +9.4/15.0
- 1% rule +8.2/10.0
- DSCR +6.8/10.0
- Livability +4.2/5.0
- Condition / age +4.0/5.0
- Rent growth +3.7/5.0
- Schools +2.2/10.0
- Appreciation +0.0/10.0
$119,990
🖨 Deal sheet 📄 Offer letter ✓ Due diligence
Listing remarks
Step out onto your private balcony and take in everything Colony West has to offer: outdoor pool, tennis courts, clubhouse, and walking paths, all right outside your door. This second-floor two bedroom, one bath condo is the kind of place that just feels right the moment you walk in, with a great layout, natural light, and a location just minutes from the University of Illinois. Your monthly association costs covers exterior maintenance, lawn care, snow removal, and water, so you can actually enjoy where you live without the headaches. And the updates are already done - new water heater (2025), updated outlets, new microwave (2023) with cabinet work to match, a bathroom exhaust fan (2024) t
Key facts
- $251 HOA
- Built 1978
- Listed 2 days
Property features AI
Finance
- Other: Not currently leased; Possession at closing or negotiable
- HOA & community: Monthly association fee of $251 (includes other services); Pets not allowed
Exterior
- Utilities: Public water; Public sewer
- Home design: Attached single condo; Single-story entry (entry level 1); Estimated living area
- Construction: Vinyl siding; Approximately 41–50 years old
- Exterior features: Condo lot (per county records)
Interior
- Kitchen: Kitchen (8 x 10)
- Bedrooms: Master bedroom (14 x 13) — main level; Second bedroom (10 x 9) — main level
- Bathrooms: One full bathroom
- Heating & cooling: Natural gas heating with forced air; Central air conditioning
- Interior features: Five total rooms; Foyer (9 x 9); Dining room (9 x 8); Living room (12 x 17); Family room; Utility room (8 x 5)
- Laundry & utility: Laundry room; First-floor utility room
Neighborhood map
What this means for you Summary
Snapshot
- This is a 2-bed/1.0-bath condo listed at $120k. Condition is rated good.
Deal economics
- At list price, monthly cash flow is $174 ($2k/yr) — positive.
- The deal already cash-flows at list — no discount required.
- Meets the 1% rule at list price ($2k rent vs $120k).
- Cap rate 8.0% vs local median 3.8% in Champaign — top-decile yield for the area; either an underpriced asset or a hidden risk that comps aren't pricing in. Stress-test before assuming the spread holds.
Location & tenants
- Location reads 83/100 on livability (#44 in IL, #902 nationally) — a professional / high-income tenant draw. Strengths: commute A+, cost of living A+, housing A+; Watch: crime F.
- Champaign CUSD 4 (urban): math 24% / reading 26% proficiency, ranked #333 of 620 in IL (top 54%) — low school quality limits family demand, transient renter base, plan for 1-2y turnover.
- Zoned schools: Stratton Elementary School (math 12% / reading 2%, grade F, #1,673 of 2,056 statewide, top 84%, 476 students, 0% FRL); Central High School (math 32% / reading 38%, grade F, #125 of 693 statewide, top 18%, 1,597 students, 0% FRL) — zoned schools average 0% FRL vs 52% district-wide (52 pts lower); this property's tenant base skews higher-income than the district average.
- Market conditions: Rents rising fast (+4.6%/yr); 51 active listings in the ZIP; 5 comparable units currently listed for rent nearby; rentals leasing fast (median 13d on market — plan ~1-2 weeks tenant-placement turnaround); lower-income renter base — watch delinquency; 573 units permitted in Champaign County in 2024 (359 in 5+ unit buildings).
- At $1,588/mo this rent would consume 69% of the median local household income ($28k/yr) (locally 4754% of renters already pay >50% of income on rent) — very limited rent-growth headroom before tenants either downsize or default.
Forward outlook
- Local home prices are declining (-3.0%/yr); year-one equity from $830 of loan paydown is wiped out by about $4k of value loss. Plan a longer hold.
- Champaign County population projected at +15% by 2050 — modest demand growth; plan on rents tracking national, not racing it.
Negotiation context
- Only 2 days on market — expect competitive offers; lowballing is unlikely to land.
Questions for the listing agent
- Built in 1978 — when were the roof, HVAC, electrical panel, plumbing, and water heater last replaced?
- What does the HOA fee cover, when was the last increase, and are there any pending special assessments or reserve-fund shortfalls?
- Any open or pending special assessments — roof, HVAC, plumbing, elevator, façade? What's the per-unit balance and payoff schedule, and is the seller paying it off at close or rolling it to the buyer?
- Is there a deadline driving the sale (1031 exchange, divorce, estate, relocation)? That informs how much negotiation room exists.
- Crime grade is F in this area — have there been break-ins, vandalism, or insurance claims at this property in the last 3 years? What carrier currently insures it and at what premium?
- What's the average days-on-market for RENTAL listings here right now (not sales)? A rising rental-DOM trend means longer vacancies and softer asking-rent achievability than the comps imply.
- What's the recent tenant-quality profile in this submarket — average credit score on applications, eviction rate, late-payment / NSF rate, and stable-employment percentage? A property-management company in the area should have these aggregated.
- How much new apartment / multifamily construction is in the pipeline within 1–3 miles? Heavy new supply (>2% of stock underway) typically softens rents 12–24 months out; light construction supports rent growth.
Investment metrics
- 1% rule
- 1.32% ✓
- Cap rate
- 8.03%
- Cash-on-cash
- 6.22%
- DSCR
- 1.28
- GRM
- 6.3
CMA / ARV
- ARV (median comp)
- $125,264
- List price
- $119,990
- Delta
- -4.21%
- Verdict
- FAIR
- Comps
- 20 within 1.0 mi
Projected returns pro-forma
-3.0% appreciation · 4.62% rent growth · sell at horizon
- IRR
- -4.3%
- Equity multiple
- 0.83×
- Total profit
- $-5,546
- Equity at exit
- $17,891
- IRR
- 7.7%
- Equity multiple
- 1.63×
- Total profit
- $21,329
- Equity at exit
- $10,375
Cash invested: $33,597 (down + closing). Projections, not guarantees.
Landlord ↔ Tenant lean methodology
- Overall (STATE)
- 43 Moderately Tenant-Leaning
- State Illinois
- 43 Moderately Tenant-Leaning · D+7
- County
- — inherits STATE
- City
- — inherits STATE
ZIP-level market 61820
- Home prices YoY
- -31.9%
- Rents YoY
- 4.6%
- Active inventory
- 51
- Price-to-rent
- 6.3×
Monthly cashflow live
- Estimated rent
- $1,588 high interval (Pro) →
- Mortgage (P&I)
- −$629
- Tax est. 1.5%
- −$150 /mo · $1,800/yr
- Insurance
- −$50
- HOA
- −$251
- Vacancy / Maint / Mgmt
- −$333
- Net cashflow
- $174
Break-even live
UW: 25.0% down · 7.5% · 30yr · 1.5% tax · 5.0% vac · 8.0% maint · 8.0% mgmt
Financing live
Cash to close
- Down payment
- $29,998
- Closing costs
- $3,600
- Reserves months
- —
- Total cash needed
- —
Loan-product check · same deal, 3 products live
Conventional
25% down · 7.5% · 30yr
- Down + closing
- —
- Monthly P&I
- —
- Monthly cashflow
- —
- DSCR
- —
- Eligible?
- —
Personal DTI + credit; lowest rate.
DSCR
20% down · 8.5% · 30yr
- Down + closing
- —
- Monthly P&I
- —
- Monthly cashflow
- —
- DSCR
- —
- Eligible?
- —
No personal income docs; deal must DSCR.
Hard money
10% down · 12.0% · 12mo
- Down + closing
- —
- Monthly P&I
- —
- Monthly cashflow
- —
- DSCR
- —
- Eligible?
- —
Short-term bridge; refi at stabilization.
Rent comps 5 comps
| Address | Beds | Baths | Sqft | Rent | $/sqft | DOM | Units | Dist |
|---|---|---|---|---|---|---|---|---|
| 1924 Melrose Dr Unit C Champaign, IL | 3.0 | 1.0 | 1039 | $1,800 | $1.73 | 13d | 1 | 0.04mi |
| 301 Curtis Rd Unit 401-9-106 Savoy, IL | 1.0 | 1.0 | 660 | $1,240 | $1.88 | 13d | 1 | 1.20mi |
| 401 W Curtis Rd Savoy, IL | 1.0–2.0 | 1.0–2.0 | 845 | $1,475 | $1.75 | 13d | 30 | 1.24mi |
| 1915 S Mattis Ave Champaign, IL | 1.0–3.0 | 1.0–2.0 | 971 | $1,762 | $1.81 | 13d | 11 | 1.40mi |
| 2406 Leeper Dr Unit Aceves 1 Champaign, IL | 2.0 | 1.5 | 950 | $3,000 | $3.16 | 13d | 1 | 1.47mi |
HOA detail condo
- Monthly dues
- $251 · $3,012/yr
- Likely covers
- waterlandscapingsnow removalexterior maint.pool
- Assessments
- None detected in remarks — confirm with the listing agent.
Listing history 2 events
-
2026-05-08status Pending 946-char remark
-
2026-05-06$119,990 Active 946-char remark
ⓘ Source: listings_history table (triggers on properties + properties_extension) + one-shot
backfill from property_details.listing_events for pre-trigger history.
Climate risk First Street
- Flood 4/10 Moderate FEMA zone X (unshaded) · 21% chance over 30 yrs
- Wildfire 1/10 Low
- Heat 3/10 Moderate 7 d/yr ≥104°F today · 19 d/yr by 30 yrs out
- Wind 2/10 Low 100% chance of damaging wind over 30 yrs
- Air quality 2/10 Low 0 unhealthy d/yr today · 1 by 30 yrs out
Nearby sold comps map
Loading sold comps map…
Walkable amenities ~0.75 mi
Loading nearby amenities…
Taxation est. · year 1
- Rental income
- $19,053
- − Mortgage interest
- −$6,721
- − Property taxes
- −$1,800
- − Insurance
- −$600
- − Repairs & maintenance
- −$1,524
- − Management
- −$1,524
- − HOA
- −$3,012
- − Depreciation
- −$3,491
- Taxable income
- $381
- Est. tax owed @ 24.0%
- −$91
- After-tax cash flow
- $1,998/yr
For passive investors: Depreciation is non-cash, so a rental often shows a tax loss while cash-flowing — sheltering income. Rental losses are passive: they offset passive income freely, and up to $25,000/yr can offset ordinary (W-2) income if you actively participate and your MAGI is under $100k (phasing out to $0 by $150k); unused losses carry forward. On sale, claimed depreciation is recaptured at up to 25%, and gains may owe capital-gains tax (a 1031 exchange can defer both). Figures are a year-1 estimate at your 24.0% rate — not tax advice; consult a CPA.
Condition & rehab AI · 12 photos
This well-maintained, move-in-ready condo is in good condition with minimal updates needed to enhance its curb appeal and functionality.
Value-add opportunities
- Both paint exterior and interior — enhances curb appeal and interior aesthetics
- Both replace outdated cabinetry and fixtures — increases appeal and functionality
- Both install smart home devices — improves convenience and energy efficiency
Renovation cost estimate screening
Value-add ROI direction
- Both paint exterior and interior — enhances curb appeal and interior aesthetics ↑
- Both replace outdated cabinetry and fixtures — increases appeal and functionality ↑
- Both install smart home devices — improves convenience and energy efficiency ↑
ⓘ Cost ranges are severity-bucket heuristics (US national rule-of-thumb). Get contractor quotes + a written scope before underwriting a rehab budget.
Schools (NCES district)
- District
- Champaign CUSD 4
- NCES district ID
- 1709420
- Math proficiency
- 24% ▼ -7.00%
- Reading proficiency
- 26% ▼ -7.00%
- Median HH income
- $45,797
- Composite
- 21.66/100
- National rank
- #8281
- State rank
- #333 of 620 in IL
Livability — Champaign
- Score
- 83/100
- State rank
- #44
- US rank
- #902
Category grades
Schools grade is shown separately in the Schools card above.
Census & demographics
- Census place
- Champaign, IL
- County
- Champaign County · 182,148 people
- City population
- 96,852
- Metro
- Champaign-Urbana, IL
- Population (ZIP)
- 40,599
- Household income
- $27,539
- Rent vs Own
- Severe rent burden
- 4754.0
Population outlook (Champaign County) Hauer SSP2
- Today (2025)
- 223,848 people
- By 2030
- 231,416 · +3.4%
- By 2040
- 244,321 · +9.1%
- By 2050
- 256,432 · +14.6%
- By 2075
- 285,823 · +27.7%
- By 2100
- 296,406 · +32.4%
Race, ethnicity, and origin ACS 2023
- Neighborhood character
- Diverse neighborhood (Simpson 0.62)
- Race & ethnicity
- White 57% Asian 18% Black 13% Hispanic / Latino 9% Two or more races 8%
- Hispanic origin (detail)
- Mexican 6%
- Common ancestry
- Romanian 4% Italian 2% Lithuanian 1%
- Foreign-born
- 17% · China, Canada, South Korea
- Languages at home
- 74% English-only · Chinese 7% Spanish 6% Other Indo-European 5%
Political lean MEDSL · Champaign
- 2024 margin
- Strong D (+24.1) · D 61.3% · R 37.2% · Other 1.5%
- 2008→2024 swing
- +6.6pp toward D · 2008: 17.5pp · 2024: 24.1pp
- All cycles
- 2024: D+24.1 2020: D+22.8 2016: D+18.4 2012: D+6.8 2008: D+17.5
Not yet ingested
- Civics
- —
Market trends
- HPI YoY
- ▼ -112.24%
- Current HPI
- 239.5835
- Rent YoY
- ▲ 4.62%
- Metro
- Champaign-Urbana, IL
- State GDP YoY
- ▲ 1.59%
- F500 in state
- 60
Industry mix (Fortune 500 HQ in IL)
| Industry | F500 HQs | Revenue |
|---|---|---|
| Insurance | 4 | $201B |
|
||
| Consumer Goods | 4 | $87B |
|
||
| Industrial Machinery | 3 | $64B |
|
||
| Healthcare | 2 | $55B |
|
||
| Retail / Pharmacy | 1 | $148B |
|
||
| Agriculture / Food | 1 | $86B |
|
||
Price history
2 events — show timeline
- 2026-05-08 Pending — MRED as Distributed by MLS Grid
- 2026-05-06 Listed $119,990 MRED as Distributed by MLS Grid
Cash-flow waterfall
monthlySold comps — $/sqft
last 12 mo · ≤1 miLoading sold comps…