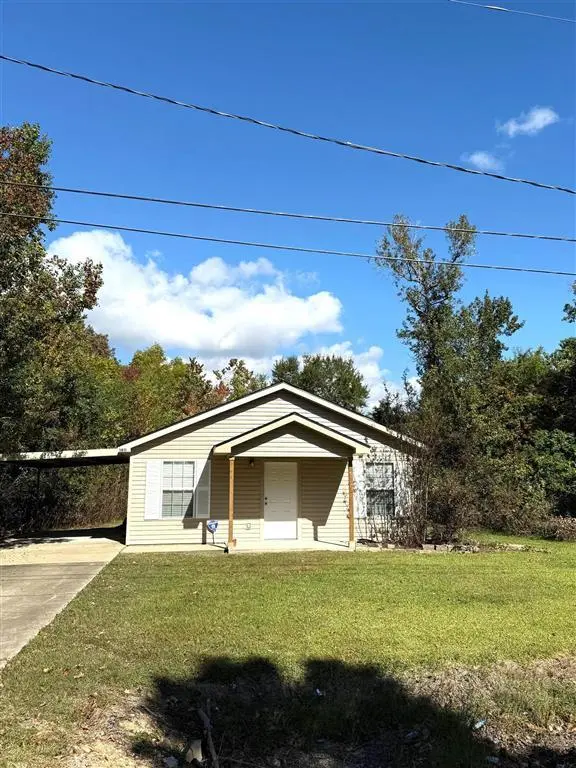
1411 Pinehurst St · Carlyss, LA
Flood risk 4/10 · Minor
- FEMA flood zone
- X (shaded)
- Chance of flooding over 30 yrs
- 0.13%
- Est. flood insurance / yr
- $507 – $1,088
Fire risk 2/10 · Minimal
- Est. fire insurance / yr
- $1,269 – $2,357
Heat risk 9/10 · Severe
- Hot days now (above 109°F)
- 7 days/yr
- Hot days in 30 yrs
- 23 days/yr
Wind risk 9/10 · Severe
- Chance of severe wind over 30 yrs
- 99.0%
Air-quality risk 2/10 · Minimal
- Unhealthy air days now
- 1 days/yr
- Unhealthy air days in 30 yrs
- 1 days/yr
Risk factors via First Street. Map © Google.
Why this score? — see what drove the B- grade
The composite is a weighted blend of 9 inputs, each scored 0–100. Each bar is that input's sub-score; the figure is the points it added to the 100-point composite (weight × sub-score).
- Cash flow +30.0/30.0
- DSCR +10.0/10.0
- 1% rule +8.0/10.0
- ARV discount +6.5/15.0
- Schools +3.1/10.0
- Livability +3.1/5.0
- Rent growth +2.5/5.0
- Condition / age +2.5/5.0
- Appreciation +0.0/10.0
$149,500
🖨 Deal sheet 📄 Offer letter ✓ Due diligence
Listing remarks MLS
Welcome to this cozy 2-bedroom, 2-bath home featuring an inviting open floor plan perfect for comfortable living. The island kitchen boasts beautiful granite countertops, ideal for meal prep and gathering with family and friends. The spacious master bedroom offers a large closet complete with custom built-ins for easy organization. Enjoy low-maintenance living and exterior upkeep, giving you more time to relax and enjoy your home. Rural Development financing available! Call today to schedule your personal showing — this gem won’t last long!
Key facts
- 0.25 acre lot
- Built 2013
- Listed 15 days
Neighborhood map
What this means for you Summary
Snapshot
- This is a 2-bed/2.0-bath single-family listed at $150k.
Deal economics
- At list price, monthly cash flow is $607 ($7k/yr) — positive.
- The deal already cash-flows at list — no discount required.
- Meets the 1% rule at list price ($2k rent vs $150k).
- Recommended offer: $147k (1.5% below list) — sets the bar for market timing.
- Cap rate 11.2% vs local median 8.3% in Carlyss — top-decile yield for the area; either an underpriced asset or a hidden risk that comps aren't pricing in. Stress-test before assuming the spread holds.
Location & tenants
- Location reads 61/100 on livability (#237 in LA) — a middle-class / working-renter tenant base. Strengths: cost of living A+, housing A+, employment B; Watch: schools F, crime D-, amenities F.
- Calcasieu Parish (other): math 30% / reading 44% proficiency, ranked #29 of 98 in LA (top 30%) — families likely to look elsewhere, expect single-tenant / working-renter base with shorter leases.
- Market conditions: 236 active listings in the ZIP; 4 comparable units currently listed for rent nearby; rentals lingering (median 44d on market — plan ~5-8 weeks vacancy on turnover, expect pricing pressure); 75% of comp listings sitting > 30 days — soft ceiling on asking rent; 1,298 units permitted in Calcasieu Parish in 2024 (526 in 5+ unit buildings).
Forward outlook
- Local home prices are declining (-3.0%/yr); year-one equity from $1k of loan paydown is wiped out by about $4k of value loss. Plan a longer hold.
- Calcasieu County population projected at +11% by 2050 — modest demand growth; plan on rents tracking national, not racing it.
- At projected returns (-3.0% appreciation + 3.0% rent growth), your $42k cash investment doubles in ~7 years — after that, you're playing with house money.
Negotiation context
- It's been on market 16 days — a 2% lower offer ($147k) is reasonable based on typical stale-listing flexibility.
Risks & watch-outs
- Climate carrying-cost: severe wind risk, 99% chance of damaging wind over 30y; extreme-heat days projected 7→23/yr by 2055 (HVAC capex compounding) — expect insurance premiums to compound above CPI over the hold.
Questions for the listing agent
- Is there a deadline driving the sale (1031 exchange, divorce, estate, relocation)? That informs how much negotiation room exists.
- Schools are F-rated, which usually means shorter tenancies and higher turnover. Who's the typical renter profile here, and what's been the actual vacancy rate?
- Crime grade is D in this area — have there been break-ins, vandalism, or insurance claims at this property in the last 3 years? What carrier currently insures it and at what premium?
- What's the average days-on-market for RENTAL listings here right now (not sales)? A rising rental-DOM trend means longer vacancies and softer asking-rent achievability than the comps imply.
- What's the recent tenant-quality profile in this submarket — average credit score on applications, eviction rate, late-payment / NSF rate, and stable-employment percentage? A property-management company in the area should have these aggregated.
- How much new for-sale + rental construction is in the pipeline within 1–3 miles? Heavy new supply typically softens prices + rents 12–24 months out; constrained supply supports both.
Investment metrics
- 1% rule
- 1.30% ✓
- Cap rate
- 11.16%
- Cash-on-cash
- 17.39%
- DSCR
- 1.77
- GRM
- 6.4
CMA / ARV
- ARV (median comp)
- $146,389
- List price
- $149,500
- Delta
- 2.13%
- Verdict
- FAIR
- Comps
- 20 within 1.0 mi
Show comp detail 4 sales within ~0.75 mi
| Address | Dist | Beds/Ba | Sqft | Sold | Price | $/sf | Match |
|---|---|---|---|---|---|---|---|
| 1410 Jan St | 0.03mi | 3/2.0 (+1) | 1,275 (+12%) | 18mo | $127,500 | $100 | 58 |
| 2506 Thomason St St | 0.59mi | 3/1.5 (+1) | 1,201 (+6%) | 2mo | $124,900 | $104 | 54 |
| 1004 Sunset St | 0.39mi | 3/2.0 (+1) | 1,211 (+7%) | 14mo | $129,500 | $107 | 54 |
| 1030 Gulf Ln | 0.33mi | 3/2.0 (+1) | 1,279 (+13%) | 15mo | $148,500 | $116 | 46 |
Match score weights: distance 35% · size 25% · config 20% · recency 20%. Top-matched comps best support the ARV.
Projected returns pro-forma
-3.0% appreciation · 3.0% rent growth · sell at horizon
- IRR
- 8.7%
- Equity multiple
- 1.34×
- Total profit
- $14,375
- Equity at exit
- $22,291
- IRR
- 17.9%
- Equity multiple
- 2.48×
- Total profit
- $62,126
- Equity at exit
- $12,926
Cash invested: $41,860 (down + closing). Projections, not guarantees.
Landlord ↔ Tenant lean methodology
- Overall (STATE)
- 90 Strongly Landlord-Friendly
- State Louisiana
- 90 Strongly Landlord-Friendly · R+12
- County
- — inherits STATE
- City
- — inherits STATE
ZIP-level market 70665
- Active inventory
- 236
- Price-to-rent
- 6.4×
Monthly cashflow live
- Estimated rent
- $1,944 medium interval (Pro) →
- Mortgage (P&I)
- −$784
- Tax from tax record
- −$83 /mo · $999/yr
- Insurance
- −$62
- HOA
- −$0
- Vacancy / Maint / Mgmt
- −$408
- Net cashflow
- $607
Break-even live
UW: 25.0% down · 7.5% · 30yr · 1.5% tax · 5.0% vac · 8.0% maint · 8.0% mgmt
Financing live
Cash to close
- Down payment
- $37,375
- Closing costs
- $4,485
- Reserves months
- —
- Total cash needed
- —
Loan-product check · same deal, 3 products live
Conventional
25% down · 7.5% · 30yr
- Down + closing
- —
- Monthly P&I
- —
- Monthly cashflow
- —
- DSCR
- —
- Eligible?
- —
Personal DTI + credit; lowest rate.
DSCR
20% down · 8.5% · 30yr
- Down + closing
- —
- Monthly P&I
- —
- Monthly cashflow
- —
- DSCR
- —
- Eligible?
- —
No personal income docs; deal must DSCR.
Hard money
10% down · 12.0% · 12mo
- Down + closing
- —
- Monthly P&I
- —
- Monthly cashflow
- —
- DSCR
- —
- Eligible?
- —
Short-term bridge; refi at stabilization.
Rent comps 4 comps
| Address | Beds | Baths | Sqft | Rent | $/sqft | DOM | Units | Dist |
|---|---|---|---|---|---|---|---|---|
| 1917 Linda Ave Sulphur, LA | 3.0 | 2.0 | 1288 | $1,890 | $1.47 | 44d | 1 | 0.58mi |
| 2310 Timberlane Dr Sulphur, LA | 2.0 | 2.0 | 1350 | $2,450 | $1.81 | 44d | 1 | 0.87mi |
| 1000 E Carlyss Blvd Sulphur, LA | 1.0–3.0 | 1.0–2.0 | 966 | $2,024 | $2.09 | 13d | 10 | 1.12mi |
| 1141 Mosswood Dr Sulphur, LA | 2.0–3.0 | 2.0–3.5 | 1332 | $1,295 | $0.97 | 44d | 1 | 1.18mi |
Listing history 14 events
-
2026-06-19days on market $149,500 Active 16 DOM
-
2026-06-18days on market $149,500 Active 15 DOM
-
2026-06-17days on market $149,500 Active 14 DOM
-
2026-06-16days on market $149,500 Active 13 DOM
-
2026-06-15days on market $149,500 Active 12 DOM
-
2026-06-14days on market $149,500 Active 10 DOM
-
2026-06-13days on market $149,500 Active 9 DOM
-
2026-06-10days on market $149,500 Active 7 DOM
-
2026-06-09days on market $149,500 Active 6 DOM
-
2026-06-08days on market $149,500 Active 5 DOM
-
2026-06-07days on market $149,500 Active 4 DOM
-
2026-06-05days on market $149,500 Active 1 DOM
-
2026-05-30days on market $149,500 Active 199 DOM
-
2025-11-12$149,500 Active 558-char remark
Show marketing remark (558 chars)
Welcome to this cozy 2-bedroom, 2-bath home featuring an inviting open floor plan perfect for comfortable living. The island kitchen boasts beautiful granite countertops, ideal for meal prep and gathering with family and friends. The spacious master bedroom offers a large closet complete with custom built-ins for easy organization. Enjoy low-maintenance living and exterior upkeep, giving you more time to relax and enjoy your home. Rural Development financing available! Call today to schedule your personal showing — this gem won’t last long!
ⓘ Source: listings_history table (triggers on properties + properties_extension) + one-shot
backfill from property_details.listing_events for pre-trigger history.
Tax reassessment forecast LA · Resets to sale price
- Current annual tax
- $999 · $83/mo
- Projected year-2 tax
- $999 · $83/mo
- Expected delta
- $0/yr ($0/mo · 0.0%)
ⓘ Screening estimate from a state-policy table — verify with the county assessor before closing.
Climate risk First Street
- Flood 4/10 Moderate FEMA zone X (shaded) · 13% chance over 30 yrs
- Wildfire 2/10 Low
- Heat 9/10 Extreme 7 d/yr ≥109°F today · 23 d/yr by 30 yrs out
- Wind 9/10 Extreme 99% chance of damaging wind over 30 yrs
- Air quality 2/10 Low 1 unhealthy d/yr today · 1 by 30 yrs out
Nearby sold comps map
Loading sold comps map…
Walkable amenities ~0.75 mi
Loading nearby amenities…
Taxation est. · year 1
- Rental income
- $23,334
- − Mortgage interest
- −$8,374
- − Property taxes
- −$999
- − Insurance
- −$748
- − Repairs & maintenance
- −$1,867
- − Management
- −$1,867
- − Depreciation
- −$4,349
- Taxable income
- $5,130
- Est. tax owed @ 24.0%
- −$1,231
- After-tax cash flow
- $6,048/yr
For passive investors: Depreciation is non-cash, so a rental often shows a tax loss while cash-flowing — sheltering income. Rental losses are passive: they offset passive income freely, and up to $25,000/yr can offset ordinary (W-2) income if you actively participate and your MAGI is under $100k (phasing out to $0 by $150k); unused losses carry forward. On sale, claimed depreciation is recaptured at up to 25%, and gains may owe capital-gains tax (a 1031 exchange can defer both). Figures are a year-1 estimate at your 24.0% rate — not tax advice; consult a CPA.
Schools (NCES district)
- District
- Calcasieu Parish
- NCES district ID
- 2200330
- Math proficiency
- 30% ▼ -39.00%
- Reading proficiency
- 44% ▼ -33.00%
- Median HH income
- $44,700
- Composite
- 31.45/100
- National rank
- #5979
- State rank
- #29 of 98 in LA
Livability — Carlyss
- Score
- 61/100
- State rank
- #237
- US rank
- #18031
Category grades
Schools grade is shown separately in the Schools card above.
Census & demographics
- Census place
- Carlyss, LA
- City population
- 27,799
- Population (ZIP)
- 12,891
Population outlook (Calcasieu County) Hauer SSP2
- Today (2025)
- 212,179 people
- By 2030
- 218,199 · +2.8%
- By 2040
- 228,486 · +7.7%
- By 2050
- 236,208 · +11.3%
- By 2075
- 251,696 · +18.6%
- By 2100
- 247,848 · +16.8%
Race, ethnicity, and origin ACS 2023
- Neighborhood character
- Predominantly White (87%)
- Race & ethnicity
- White 87% Hispanic / Latino 6% Two or more races 4% Black 3%
- Hispanic origin (detail)
- Mexican 4%
- Common ancestry
- Lithuanian 8% Italian 3% Slovak 2%
- Foreign-born
- 3% · Canada
- Languages at home
- 92% English-only · Spanish 6% French/Haitian/Cajun 1% Other Indo-European 1%
Political lean MEDSL · Calcasieu
- 2024 margin
- Solid R (+39.6) · D 29.5% · R 69.0% · Other 1.5%
- 2008→2024 swing
- -15.0pp toward R · 2008: -24.6pp · 2024: -39.6pp
- All cycles
- 2024: R+39.6 2020: R+35.2 2016: R+33.3 2012: R+28.7 2008: R+24.6
Not yet ingested
- Civics
- —
Market trends
- HPI YoY
- ▼ -91.65%
- Current HPI
- 99.2379
- Rent YoY
- —
- Metro
- —
- State GDP YoY
- ▲ 3.29%
- F500 in state
- 10
Industry mix (Fortune 500 HQ in LA)
| Industry | F500 HQs | Revenue |
|---|---|---|
| Telecommunications | 2 | $23B |
|
||
| Utilities | 1 | $12B |
|
||
| Wholesale / Distribution | 1 | $5B |
|
||
| Advertising | 1 | $2B |
|
||
Price history
1 event — show timeline
- 2025-11-12 Listed $149,500 SWLAR
Property tax history
-0.7%/yrLatest (2025): $999 · +1.2% YoY. Source: county tax records.
Cash-flow waterfall
monthlySold comps — $/sqft
last 12 mo · ≤1 miLoading sold comps…