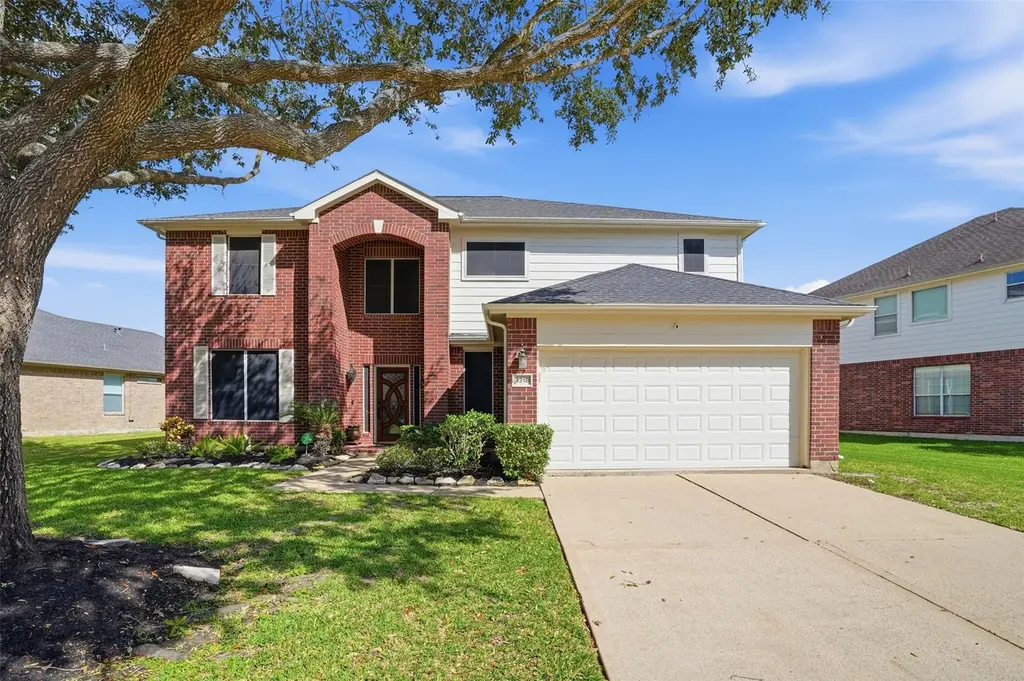
3218 Antelope Hills Dr · Missouri City, TX
Flood risk 6/10 · Moderate
- FEMA flood zone
- X (unshaded)
- Chance of flooding over 30 yrs
- 0.73%
- Est. flood insurance / yr
- $507 – $1,088
Fire risk 3/10 · Minor
- Est. fire insurance / yr
- $1,222 – $2,270
Heat risk 9/10 · Severe
- Hot days now (above 110°F)
- 7 days/yr
- Hot days in 30 yrs
- 24 days/yr
Wind risk 9/10 · Severe
- Chance of severe wind over 30 yrs
- 99.0%
Air-quality risk 2/10 · Minimal
- Unhealthy air days now
- 2 days/yr
- Unhealthy air days in 30 yrs
- 2 days/yr
Risk factors via First Street. Map © Google.
Why this score? — see what drove the D- grade
The composite is a weighted blend of 9 inputs, each scored 0–100. Each bar is that input's sub-score; the figure is the points it added to the 100-point composite (weight × sub-score).
- ARV discount +8.7/15.0
- Cash flow +7.9/30.0
- Schools +4.5/10.0
- Appreciation +4.2/10.0
- 1% rule +4.0/10.0
- Livability +3.4/5.0
- Rent growth +2.5/5.0
- Condition / age +2.5/5.0
- DSCR +2.0/10.0
$345,000
🖨 Deal sheet 📄 Offer letter ✓ Due diligence
Listing remarks
Step into space, comfort, and versatility in this impressive two-story home in Sedona Creek, offering over 3,400 square feet of living space. A grand entry with soaring ceilings and rich wood flooring creates a warm, inviting first impression. The layout features formal living and dining areas, along with a versatile first-floor room and half bath, while a secondary living area opens to the kitchen and dining space—ideal for everyday living and entertaining. The kitchen is equipped with quartz countertops, abundant cabinetry, stainless steel appliances, and a large island overlooking the main living space. Upstairs, enjoy a spacious game room, comfortably sized secondary bedrooms, and
Key facts
- Grand entry
- Formal living areas
- Rich wood flooring
Tags
Property features AI
Finance
- Other: Located in a subdivision; Disclosures: Municipal Utility District Disclosure, Seller Disclosure
- HOA & community: Community association (PMG) with an annual fee of $600
Exterior
- Parking: Attached garage with 2 parking spaces
- Security: Leased security system; Smoke detectors
- Utilities: Public water; Public sewer
- Home design: Residential property; Built in 2002; Slab foundation; Composition roof
- Construction: Brick and cement siding construction
- Exterior features: Backyard fencing; Sprinkler / irrigation system; Fence
Interior
- Kitchen: Dishwasher; Gas cooktop; Garbage disposal; Microwave; Refrigerator
- Bedrooms: Space for up to 5 bedrooms; Total of 14 rooms
- Bathrooms: 2 full bathrooms; 1 half bathroom
- Heating & cooling: Central heating (electric); Central air conditioning (electric)
- Interior features: Double vanity; Jetted tub; Kitchen island; Kitchen/family room combo; Primary bedroom with its own bath; Pantry; Separate shower; Tub/shower combination; Kitchen/dining combo; Gas log fireplace
Neighborhood map
What this means for you Summary
Snapshot
- This is a 4-bed/3.0-bath single-family listed at $345k.
Deal economics
- At list price, monthly cash flow is $-363 ($-4k/yr) — negative.
- To cash-flow at today's rent, offer at most $281k (18.6% below list).
- To meet the 1% rule (rent ≥ 1% of price), the offer needs to be $310k (10.1% below list).
- Recommended offer: $281k (18.6% below list) — sets the bar for cash-flow.
- Cap rate 5.0% vs local median 3.5% in Missouri City — top-decile yield for the area; either an underpriced asset or a hidden risk that comps aren't pricing in. Stress-test before assuming the spread holds.
Location & tenants
- Location reads 67/100 on livability (#526 in TX) — a middle-class / working-renter tenant base. Strengths: housing A+, crime A, employment A; Watch: amenities F, commute F, health & safety F.
- Fort Bend ISD (suburban): math 44% / reading 53% proficiency, ranked #140 of 826 in TX (top 17%) — families likely to look elsewhere, expect single-tenant / working-renter base with shorter leases.
- Zoned schools: Lake Olympia Middle (math 18% / reading 31%, grade F, #1,279 of 1,662 statewide, top 78%, 1,170 students, 71% FRL); Hightower H S (math 23% / reading 45%, grade F, #1,002 of 1,632 statewide, top 62%, 2,535 students, 67% FRL) — zoned schools average 69% FRL vs 35% district-wide (34 pts higher); higher-poverty schools than district average — tighter screening recommended.
- Zoned-school proficiency averages 29% at this address vs 48% district-wide (-19 pts) — the specific schools serving this property underperform the Fort Bend ISD average; the district grade overstates school quality for this exact location.
- Market conditions: Rents soft (-0.1%/yr); 1215 active listings in the ZIP; 11 comparable units currently listed for rent nearby; rentals at typical pace (median 21d on market — plan ~3-4 weeks tenant-placement turnaround); 45% of comp listings sitting > 30 days — soft ceiling on asking rent; high-income renter base; 12,093 units permitted in Fort Bend County in 2024 (815 in 5+ unit buildings).
Forward outlook
- Local home prices are declining (-1.7%/yr); year-one equity from $2k of loan paydown is wiped out by about $6k of value loss. Plan a longer hold.
- Fort Bend County population projected at +75% by 2050 — long-run rental-demand tailwind backs the buy-and-hold thesis.
Negotiation context
- It's been on market 38 days — a 3% lower offer ($335k) is reasonable based on typical stale-listing flexibility.
- 2 sale attempts with the ask held roughly flat each time — persistent listings suggest the price (not the market) is what's stuck; bring a comps-based counter.
Risks & watch-outs
- Watch-outs: property tax is 2.8% of price.
- Climate carrying-cost: major flood risk; severe wind risk, 99% chance of damaging wind over 30y; extreme-heat days projected 7→24/yr by 2055 (HVAC capex compounding) — expect insurance premiums to compound above CPI over the hold.
Questions for the listing agent
- What do current leases actually rent for vs. the listed asking? Can we see a recent rent roll and the last 12 months of T-12 income?
- It's been on market 38 days. Have you received any prior offers? Is the seller open to a 19% concession, seller financing, or rate buy-down credit?
- Property tax is high relative to price — has the assessment been appealed recently, and will the sale trigger a re-assessment?
- What does the HOA fee cover, when was the last increase, and are there any pending special assessments or reserve-fund shortfalls?
- Is there a deadline driving the sale (1031 exchange, divorce, estate, relocation)? That informs how much negotiation room exists.
- Schools are B-rated — typically a magnet for longer-tenancy family renters. What's the average tenant stay here, and is there a school-zone premium baked into asking?
- The area grade is low — what's the realistic commute time and amenity access for the typical tenant pool here? Any planned neighborhood developments (good or bad) we should know about?
- What's the average days-on-market for RENTAL listings here right now (not sales)? A rising rental-DOM trend means longer vacancies and softer asking-rent achievability than the comps imply.
- What's the recent tenant-quality profile in this submarket — average credit score on applications, eviction rate, late-payment / NSF rate, and stable-employment percentage? A property-management company in the area should have these aggregated.
- How much new for-sale + rental construction is in the pipeline within 1–3 miles? Heavy new supply typically softens prices + rents 12–24 months out; constrained supply supports both.
Investment metrics
- 1% rule
- 0.90% ✗
- Cap rate
- 5.03%
- Cash-on-cash
- -4.52%
- DSCR
- 0.80
- GRM
- 9.3
CMA / ARV
- ARV (median comp)
- $354,586
- List price
- $345,000
- Delta
- -2.70%
- Verdict
- FAIR
- Comps
- 20 within 1.0 mi
Show comp detail 12 sales within ~0.75 mi
| Address | Dist | Beds/Ba | Sqft | Sold | Price | $/sf | Match |
|---|---|---|---|---|---|---|---|
| 3238 Woods Canyon Ct | 0.07mi | 4/2.5 | 3,379 (-1%) | 8mo | $345,000 | $102 | 87 |
| 3330 Liberty Way Dr | 0.27mi | 4/2.5 | 3,420 (+0%) | 4mo | $392,000 | $115 | 82 |
| 3014 Sophie Ct | 0.45mi | 5/4.0 (+1) | 3,281 (-4%) | 4mo | $435,000 | $133 | 60 |
| 3111 Shiloh Dr | 0.31mi | 4/2.5 | 2,978 (-13%) | 5mo | $375,000 | $126 | 58 |
| 3027 Sadie Ct | 0.21mi | 5/3.5 (+1) | 2,973 (-13%) | 7mo | $385,000 | $129 | 56 |
| 3723 Golden Shores Dr | 0.70mi | 5/3.5 (+1) | 3,470 (+2%) | 4mo | $460,000 | $133 | 54 |
| 2711 Sedona Creek Dr | 0.22mi | 5/3.5 (+1) | 2,969 (-13%) | 9mo | $379,900 | $128 | 54 |
| 2707 Dry Creek Dr | 0.47mi | 5/3.5 (+1) | 3,048 (-10%) | 2mo | $409,900 | $134 | 52 |
| 3014 Cumberland Dr | 0.60mi | 4/3.0 | 2,982 (-12%) | 1mo | $395,000 | $132 | 51 |
| 2623 Atlas Dr | 0.58mi | 4/3.0 | 2,975 (-13%) | 2mo | $379,900 | $128 | 50 |
| 2002 Argos Dr | 0.72mi | 4/3.5 | 3,018 (-11%) | 9mo | $395,000 | $131 | 38 |
| 3215 Selene Dr | 0.72mi | 5/3.5 (+1) | 2,976 (-13%) | 4mo | $377,500 | $127 | 35 |
Match score weights: distance 35% · size 25% · config 20% · recency 20%. Top-matched comps best support the ARV.
Projected returns pro-forma
-1.67% appreciation · 0.0% rent growth · sell at horizon
- IRR
- -18.1%
- Equity multiple
- 0.29×
- Total profit
- $-68,168
- Equity at exit
- $72,356
- IRR
- -15.9%
- Equity multiple
- -0.09×
- Total profit
- $-105,181
- Equity at exit
- $67,020
Cash invested: $96,600 (down + closing). Projections, not guarantees.
Landlord ↔ Tenant lean methodology
- Overall (STATE)
- 87 Strongly Landlord-Friendly
- State Texas
- 87 Strongly Landlord-Friendly · R+5
- County
- — inherits STATE
- City
- — inherits STATE
ZIP-level market 77459
- Home prices YoY
- -0.8%
- Rents YoY
- -0.1%
- Active inventory
- 1215
- Price-to-rent
- 9.3×
Monthly cashflow live
- Estimated rent
- $3,100 high interval (Pro) →
- Mortgage (P&I)
- −$1,809
- Tax from tax record
- −$810 /mo · $9,716/yr
- Insurance
- −$144
- HOA
- −$50
- Vacancy / Maint / Mgmt
- −$651
- Net cashflow
- $-363
Break-even live
UW: 25.0% down · 7.5% · 30yr · 1.5% tax · 5.0% vac · 8.0% maint · 8.0% mgmt
Financing live
Cash to close
- Down payment
- $86,250
- Closing costs
- $10,350
- Reserves months
- —
- Total cash needed
- —
Loan-product check · same deal, 3 products live
Conventional
25% down · 7.5% · 30yr
- Down + closing
- —
- Monthly P&I
- —
- Monthly cashflow
- —
- DSCR
- —
- Eligible?
- —
Personal DTI + credit; lowest rate.
DSCR
20% down · 8.5% · 30yr
- Down + closing
- —
- Monthly P&I
- —
- Monthly cashflow
- —
- DSCR
- —
- Eligible?
- —
No personal income docs; deal must DSCR.
Hard money
10% down · 12.0% · 12mo
- Down + closing
- —
- Monthly P&I
- —
- Monthly cashflow
- —
- DSCR
- —
- Eligible?
- —
Short-term bridge; refi at stabilization.
Rent comps 11 comps
| Address | Beds | Baths | Sqft | Rent | $/sqft | DOM | Units | Dist |
|---|---|---|---|---|---|---|---|---|
| 3314 Dry Creek Dr Missouri City, TX | 4.0 | 3.0 | 2600 | $4,200 | $1.62 | 43d | 1 | 0.17mi |
| 3218 Clayton Terrace Dr Missouri City, TX | 4.0 | 3.0 | 2278 | $2,395 | $1.05 | 19d | 1 | 0.27mi |
| 3211 Breckinridge Ct Missouri City, TX | 4.0 | 2.5 | 2920 | $2,550 | $0.87 | 20d | 1 | 0.28mi |
| 3212 Aldridge Dr Missouri City, TX | 4.0 | 2.5 | 2489 | $2,650 | $1.06 | 20d | 1 | 0.45mi |
| 2235 Argos Dr Missouri City, TX | 4.0 | 3.5 | 2838 | $2,550 | $0.90 | 20d | 1 | 0.79mi |
| 3935 Medici Ct Missouri City, TX | 4.0 | 3.0 | 2636 | $2,800 | $1.06 | 20d | 1 | 0.95mi |
| 3947 Amalfi Shores Ct Missouri City, TX | 4.0 | 2.5 | 2409 | $3,500 | $1.45 | 43d | 1 | 1.01mi |
| 2642 Sunlit Meadow Trl Fresno, TX | 5.0 | 3.5 | 2785 | $4,000 | $1.44 | 43d | 1 | 1.13mi |
| 2123 Witham Park Ln Fresno, TX | 4.0 | 4.0 | 3026 | $2,850 | $0.94 | 43d | 1 | 1.32mi |
| 3526 Cambridge Falls Dr Fresno, TX | 4.0 | 3.0 | 3136 | $2,624 | $0.84 | 20d | 1 | 1.36mi |
| 1714 Mustang Xing Missouri City, TX | 4.0 | 3.5 | 3065 | $2,436 | $0.79 | 43d | 1 | 1.46mi |
HOA detail
- Monthly dues
- $50 · $600/yr
Listing history 10 events
-
2026-06-07days on market $345,000 Pending 38 DOM
-
2026-06-04days on market $345,000 Pending 35 DOM
-
2026-06-03days on market $345,000 Pending 34 DOM
-
2026-06-02days on market $345,000 Pending 33 DOM
-
2026-06-02status $345,000 Pending 32 DOM
-
2026-06-01days on market $345,000 Active 32 DOM
-
2026-05-31days on market $345,000 Active 31 DOM
-
2026-04-30$345,000 Active 990-char remark
-
2026-04-27historical
-
2026-03-19$355,000 Active
ⓘ Source: listings_history table (triggers on properties + properties_extension) + one-shot
backfill from property_details.listing_events for pre-trigger history.
Tax reassessment forecast TX · Resets to sale price
- Current annual tax
- $9,716 · $810/mo
- Projected year-2 tax
- $9,716 · $810/mo
- Expected delta
- $0/yr ($0/mo · 0.0%)
ⓘ Screening estimate from a state-policy table — verify with the county assessor before closing.
Climate risk First Street
- Flood 6/10 Major FEMA zone X (unshaded) · 73% chance over 30 yrs
- Wildfire 3/10 Moderate
- Heat 9/10 Extreme 7 d/yr ≥110°F today · 24 d/yr by 30 yrs out
- Wind 9/10 Extreme 99% chance of damaging wind over 30 yrs
- Air quality 2/10 Low 2 unhealthy d/yr today · 2 by 30 yrs out
Nearby sold comps map
Loading sold comps map…
Walkable amenities ~0.75 mi
Loading nearby amenities…
Taxation est. · year 1
- Rental income
- $37,202
- − Mortgage interest
- −$19,325
- − Property taxes
- −$9,716
- − Insurance
- −$1,725
- − Repairs & maintenance
- −$2,976
- − Management
- −$2,976
- − HOA
- −$600
- − Depreciation
- −$10,036
- Taxable loss
- −$10,153
- Est. tax savings @ 24.0%
- +$2,437
- After-tax cash flow
- $-1,925/yr
For passive investors: Depreciation is non-cash, so a rental often shows a tax loss while cash-flowing — sheltering income. Rental losses are passive: they offset passive income freely, and up to $25,000/yr can offset ordinary (W-2) income if you actively participate and your MAGI is under $100k (phasing out to $0 by $150k); unused losses carry forward. On sale, claimed depreciation is recaptured at up to 25%, and gains may owe capital-gains tax (a 1031 exchange can defer both). Figures are a year-1 estimate at your 24.0% rate — not tax advice; consult a CPA.
Schools (NCES district)
- District
- Fort Bend ISD
- NCES district ID
- 4819650
- Math proficiency
- 44% ▼ -15.00%
- Reading proficiency
- 53% ▼ -4.00%
- Median HH income
- $82,360
- Composite
- 44.61/100
- National rank
- #2779
- State rank
- #140 of 826 in TX
Livability — Missouri City
- Score
- 67/100
- State rank
- #526
- US rank
- #10308
Category grades
Schools grade is shown separately in the Schools card above.
Census & demographics
- Census place
- Missouri City, TX
- County
- Fort Bend County · 836,777 people
- City population
- 123,513
- Metro
- Houston-The Woodlands-Sugar Land, TX
- Population (ZIP)
- 84,221
- Household income
- $129,151
- Rent vs Own
- Severe rent burden
- 1004.0
Population outlook (Fort Bend County) Hauer SSP2
- Today (2025)
- 1,004,526 people
- By 2030
- 1,153,104 · +14.8%
- By 2040
- 1,453,718 · +44.7%
- By 2050
- 1,753,781 · +74.6%
- By 2075
- 2,455,772 · +144.5%
- By 2100
- 2,930,528 · +191.7%
Race, ethnicity, and origin ACS 2023
- Neighborhood character
- Highly diverse neighborhood (Simpson 0.75)
- Race & ethnicity
- White 34% Black 26% Asian 22% Hispanic / Latino 13% Two or more races 10%
- Hispanic origin (detail)
- Mexican 7%
- Common ancestry
- Lithuanian 2% Slovak 1% Italian 1%
- Foreign-born
- 21% · Canada, China, Vietnam
- Languages at home
- 73% English-only · Other Asian/Pacific 8% Spanish 7% Other Indo-European 5%
Political lean MEDSL · Fort Bend
- 2024 margin
- Toss-up / Even · D 49.5% · R 47.9% · Other 2.6%
- 2008→2024 swing
- +4.0pp toward D · 2008: -2.4pp · 2024: 1.6pp
- All cycles
- 2024: D+1.6 2020: D+10.6 2016: D+6.6 2012: R+6.8 2008: R+2.4
Not yet ingested
- Civics
- —
Market trends
- HPI YoY
- ▼ -1.67%
- Current HPI
- 212.3573
- Rent YoY
- ▼ -0.15%
- Metro
- Houston-The Woodlands-Sugar Land, TX
- State GDP YoY
- ▲ 3.95%
- F500 in state
- 110
Industry mix (Fortune 500 HQ in TX)
| Industry | F500 HQs | Revenue |
|---|---|---|
| Energy | 16 | $1,198B |
|
||
| Technology | 5 | $198B |
|
||
| Engineering / Construction | 4 | $72B |
|
||
| Energy Services | 3 | $60B |
|
||
| Utilities | 3 | $41B |
|
||
| Healthcare | 2 | $330B |
|
||
Price history
-2.8% since first listed5 events — show timeline
- 2026-06-08 Pending — HARMLS
- 2026-06-01 Pending — HARMLS
- 2026-04-30 Listed $345,000 HARMLS
- 2026-04-27 Listing Removed — HARMLS
- 2026-03-19 Listed $355,000 HARMLS
Property tax history
+3.3%/yrLatest (2025): $9,716 · +7.3% YoY. Source: county tax records.
Cash-flow waterfall
monthlySold comps — $/sqft
last 12 mo · ≤1 miLoading sold comps…