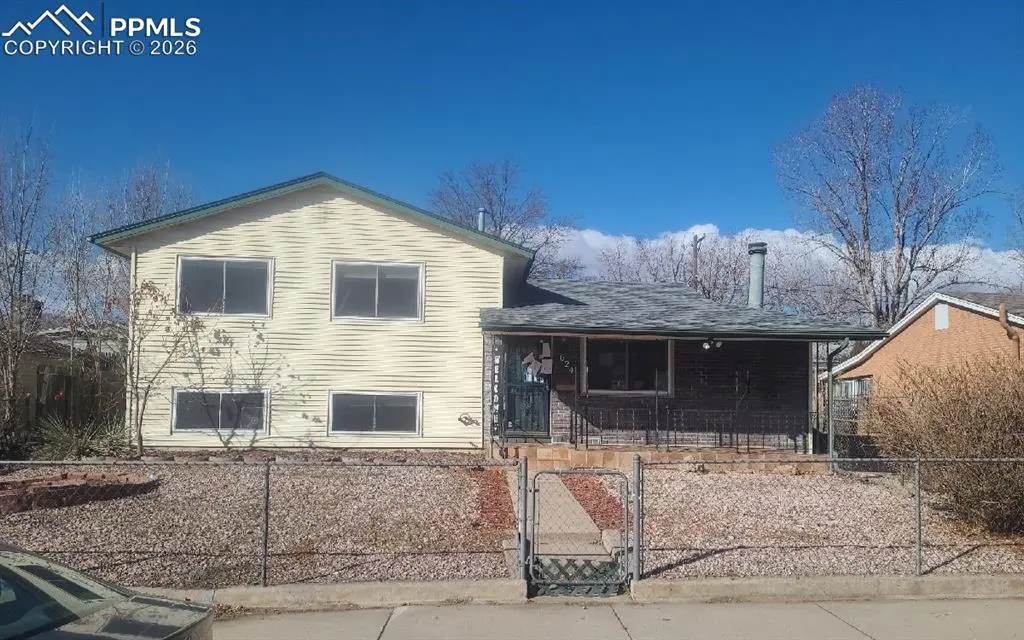
624 Bryce Dr · Colorado Springs, CO
Flood risk 1/10 · Minimal
- FEMA flood zone
- X (unshaded)
- Chance of flooding over 30 yrs
- 0.0%
- Est. flood insurance / yr
- $473 – $860
Fire risk 1/10 · Minimal
- Est. fire insurance / yr
- $939 – $1,743
Heat risk 2/10 · Minimal
- Hot days now (above 89°F)
- 7 days/yr
- Hot days in 30 yrs
- 18 days/yr
Wind risk 2/10 · Minimal
- Chance of severe wind over 30 yrs
- —
Air-quality risk 1/10 · Minimal
- Unhealthy air days now
- 0 days/yr
- Unhealthy air days in 30 yrs
- 0 days/yr
Risk factors via First Street. Map © Google.
Why this score? — see what drove the D+ grade
The composite is a weighted blend of 9 inputs, each scored 0–100. Each bar is that input's sub-score; the figure is the points it added to the 100-point composite (weight × sub-score).
- ARV discount +15.0/15.0
- Cash flow +14.9/30.0
- DSCR +4.6/10.0
- Livability +3.9/5.0
- 1% rule +3.0/10.0
- Schools +2.5/10.0
- Condition / age +2.5/5.0
- Rent growth +2.1/5.0
- Appreciation +0.0/10.0
$279,900
🖨 Deal sheet 📄 Offer letter ✓ Due diligence
Listing remarks
Don't miss out on this opportunity in Pikes Peak Park! This fully-finished tri-level boasts a low-maintenance lot, loaded with xeriscaping and is fully-fenced in front and back. There is ample off-street parking that even leads to the back yard, if needed, but protected by a full gate for security. The flooring throughout is primarily a mix of real hardwood and LVP. A large wood-burning fireplace graces the main-level living room, perfect for those chilly Colorado evenings. Quite a few updates have already been completed and this home awaits your final touches, so definitely come see it today!
Key facts
- Low-maintenance lot
- Updates completed
- Xeriscaping
Tags
Property features AI
Finance
- Financial info: Financing available: Cash, Conventional, FHA 203(k)
- HOA & community: No HOA
Exterior
- Utilities: Municipal water; Other utilities
- Home design: Single family home
- Construction: Wood frame construction; Aluminum/vinyl/steel siding; Composite shingle roof; Slab foundation; Existing home
- Exterior features: Level lot
Interior
- Bedrooms: Primary bedroom on the upper level
- Bathrooms: 2 full bathrooms
- Interior features: Central air; Forced air heating
Neighborhood map
What this means for you Summary
Snapshot
- This is a 4-bed/2.0-bath single-family listed at $280k.
Deal economics
- At list price, monthly cash flow is $82 ($979/yr) — positive.
- The deal already cash-flows at list — no discount required.
- To meet the 1% rule (rent ≥ 1% of price), the offer needs to be $223k (20.4% below list).
- Recommended offer: $223k (20.4% below list) — sets the bar for 1% rule.
- Cap rate 6.6% vs local median 3.3% in Colorado Springs — top-decile yield for the area; either an underpriced asset or a hidden risk that comps aren't pricing in. Stress-test before assuming the spread holds.
Location & tenants
- Location reads 78/100 on livability (#23 in CO, #2,639 nationally) — a middle-class / working-renter tenant base. Strengths: amenities A+, housing A+, health & safety A+; Watch: cost of living C-, crime F.
- Colorado Springs School District No. 11 In The County Of E (urban): math 20% / reading 37% proficiency, ranked #56 of 86 in CO (top 65%) — low school quality limits family demand, transient renter base, plan for 1-2y turnover.
- Market conditions: Rents soft (-1.5%/yr); 183 active listings in the ZIP; 22 comparable units currently listed for rent nearby; rentals leasing fast (median 3d on market — plan ~1-2 weeks tenant-placement turnaround); 3,906 units permitted in El Paso County in 2024 (872 in 5+ unit buildings).
- This rent runs 43% of the median local income ($62k/yr) — at the standard rent-burdened threshold; future hikes will face affordability resistance.
Forward outlook
- Local home prices are declining (-3.0%/yr); year-one equity from $2k of loan paydown is wiped out by about $8k of value loss. Plan a longer hold.
- El Paso County population projected at +28% by 2050 — long-run rental-demand tailwind backs the buy-and-hold thesis.
Negotiation context
- It's been on market 82 days — a 6% lower offer ($263k) is reasonable based on typical stale-listing flexibility.
- 5 sale attempts since 3y ago; this cycle's ask has dropped $30k (10%) from the opening price — seller is motivated, your offer sets the floor, not the list.
Questions for the listing agent
- It's been on market 82 days. Have you received any prior offers? Is the seller open to a 20% concession, seller financing, or rate buy-down credit?
- Built in 1961 — when were the roof, HVAC, electrical panel, plumbing, and water heater last replaced?
- Why hasn't it sold? Are there any deal-killer items the seller is aware of (foundation, flood, title, zoning, code violations)?
- Is there a deadline driving the sale (1031 exchange, divorce, estate, relocation)? That informs how much negotiation room exists.
- Schools are B-rated — typically a magnet for longer-tenancy family renters. What's the average tenant stay here, and is there a school-zone premium baked into asking?
- Crime grade is F in this area — have there been break-ins, vandalism, or insurance claims at this property in the last 3 years? What carrier currently insures it and at what premium?
- The area grade is low — what's the realistic commute time and amenity access for the typical tenant pool here? Any planned neighborhood developments (good or bad) we should know about?
- What's the average days-on-market for RENTAL listings here right now (not sales)? A rising rental-DOM trend means longer vacancies and softer asking-rent achievability than the comps imply.
- What's the recent tenant-quality profile in this submarket — average credit score on applications, eviction rate, late-payment / NSF rate, and stable-employment percentage? A property-management company in the area should have these aggregated.
- How much new for-sale + rental construction is in the pipeline within 1–3 miles? Heavy new supply typically softens prices + rents 12–24 months out; constrained supply supports both.
Investment metrics
- 1% rule
- 0.80% ✗
- Cap rate
- 6.64%
- Cash-on-cash
- 1.25%
- DSCR
- 1.06
- GRM
- 10.5
CMA / ARV
- ARV (on-the-fly)
- $346,524
- Comps found
- 12
Show comp detail 12 sales within ~0.75 mi
| Address | Dist | Beds/Ba | Sqft | Sold | Price | $/sf | Match |
|---|---|---|---|---|---|---|---|
| 604 Bryce Dr | 0.06mi | 4/3.0 | 1,599 (-7%) | 4mo | $310,000 | $194 | 78 |
| 425 Placid Rd | 0.19mi | 4/2.0 | 1,785 (+4%) | 12mo | $380,000 | $213 | 75 |
| 810 Hutchinson Dr | 0.24mi | 4/2.0 | 1,577 (-8%) | 6mo | $355,000 | $225 | 70 |
| 823 Sequoia Dr | 0.21mi | 4/2.0 | 1,599 (-7%) | 11mo | $397,000 | $248 | 70 |
| 931 Hayden Dr | 0.29mi | 4/2.0 | 1,577 (-8%) | 6mo | $299,900 | $190 | 67 |
| 524 Winnepeg Dr | 0.27mi | 4/2.0 | 1,920 (+11%) | 10mo | $289,000 | $151 | 61 |
| 3231 Michigan Ave | 0.64mi | 4/2.0 | 1,821 (+6%) | 2mo | $360,000 | $198 | 59 |
| 1223 Royale Dr | 0.67mi | 4/2.5 | 1,791 (+4%) | 2mo | $257,385 | $144 | 58 |
| 1115 Rainier Dr | 0.63mi | 4/2.0 | 1,596 (-7%) | 7mo | $321,000 | $201 | 52 |
| 1123 Royale Dr | 0.61mi | 3/2.0 (-1) | 1,508 (-12%) | 2mo | $320,000 | $212 | 44 |
| 321 Kenady Cir | 0.59mi | 3/2.0 (-1) | 1,922 (+12%) | 8mo | $369,000 | $192 | 41 |
| 1206 Yosemite Dr | 0.73mi | 3/2.0 (-1) | 1,465 (-15%) | 8mo | $315,000 | $215 | 29 |
Match score weights: distance 35% · size 25% · config 20% · recency 20%. Top-matched comps best support the ARV.
Projected returns pro-forma
-3.0% appreciation · 0.0% rent growth · sell at horizon
- IRR
- -17.3%
- Equity multiple
- 0.40×
- Total profit
- $-46,814
- Equity at exit
- $41,734
- IRR
- -15.3%
- Equity multiple
- 0.24×
- Total profit
- $-59,810
- Equity at exit
- $24,201
Cash invested: $78,372 (down + closing). Projections, not guarantees.
Landlord ↔ Tenant lean methodology
- Overall (STATE)
- 38 Tenant-Leaning
- State Colorado
- 38 Tenant-Leaning · D+4
- County
- — inherits STATE
- City
- — inherits STATE
ZIP-level market 80910
- Home prices YoY
- -27.5%
- Rents YoY
- -1.5%
- Active inventory
- 183
- Price-to-rent
- 10.5×
Monthly cashflow live
- Estimated rent
- $2,228 high interval (Pro) →
- Mortgage (P&I)
- −$1,468
- Tax from tax record
- −$94 /mo · $1,129/yr
- Insurance
- −$117
- HOA
- −$0
- Vacancy / Maint / Mgmt
- −$468
- Net cashflow
- $82
Break-even live
UW: 25.0% down · 7.5% · 30yr · 1.5% tax · 5.0% vac · 8.0% maint · 8.0% mgmt
Financing live
Cash to close
- Down payment
- $69,975
- Closing costs
- $8,397
- Reserves months
- —
- Total cash needed
- —
Loan-product check · same deal, 3 products live
Conventional
25% down · 7.5% · 30yr
- Down + closing
- —
- Monthly P&I
- —
- Monthly cashflow
- —
- DSCR
- —
- Eligible?
- —
Personal DTI + credit; lowest rate.
DSCR
20% down · 8.5% · 30yr
- Down + closing
- —
- Monthly P&I
- —
- Monthly cashflow
- —
- DSCR
- —
- Eligible?
- —
No personal income docs; deal must DSCR.
Hard money
10% down · 12.0% · 12mo
- Down + closing
- —
- Monthly P&I
- —
- Monthly cashflow
- —
- DSCR
- —
- Eligible?
- —
Short-term bridge; refi at stabilization.
Rent comps 22 comps
| Address | Beds | Baths | Sqft | Rent | $/sqft | DOM | Units | Dist |
|---|---|---|---|---|---|---|---|---|
| 827 Sequoia Dr Colorado Springs, CO | 4.0 | 2.0 | 1694 | $2,700 | $1.59 | 3d | 1 | 0.24mi |
| 2902 Airport Rd Colorado Springs, CO | 2.0–3.0 | 1.0–2.0 | 1202 | $1,900 | $1.58 | 3d | 2 | 0.42mi |
| 2205 Willow Tree Grv Colorado Springs, CO | 1.0–3.0 | 1.0–2.0 | 962 | $2,170 | $2.25 | 3d | 21 | 0.44mi |
| 3005 E Fountain Blvd Colorado Springs, CO | 3.0 | 1.5 | 1950 | $2,000 | $1.03 | 14d | 1 | 0.71mi |
| 3106 Gomer Ave Colorado Springs, CO | 3.0 | 1.0 | 1162 | $1,895 | $1.63 | 14d | 1 | 0.77mi |
| 106 Balfour Ave Colorado Springs, CO | 3.0 | 1.0 | 1391 | $2,000 | $1.44 | 23d | 1 | 0.79mi |
| 2528 Gilpin Ave Colorado Springs, CO | 3.0 | 2.0 | 1666 | $2,229 | $1.34 | 2d | 1 | 0.93mi |
| 3125 E Fountain Blvd Colorado Springs, CO | 2.0–3.0 | 1.5 | 1650 | $1,875 | $1.14 | 2d | 7 | 0.94mi |
| 2153 Gilpin Ave Colorado Springs, CO | 3.0 | 2.5 | 1520 | $2,200 | $1.45 | 2d | 1 | 0.96mi |
| 1819 E Bijou St Colorado Springs, CO | 5.0 | 2.0 | 1850 | $1,950 | $1.05 | 23d | 1 | 1.04mi |
| 3591 Indigo Ridge Pt Colorado Springs, CO | 4.0 | 2.0 | 2040 | $2,195 | $1.08 | 3d | 1 | 1.05mi |
| 1842 Springs Vista St Colorado Springs, CO | 3.0 | 2.5 | 1600 | $2,243 | $1.40 | 23d | 1 | 1.18mi |
| 213 Audubon Dr Colorado Springs, CO | 3.0 | 3.0 | 2157 | $2,325 | $1.08 | 23d | 1 | 1.22mi |
| 70 Audubon Dr Colorado Springs, CO | 3.0 | 2.0 | 1189 | $2,000 | $1.68 | 23d | 1 | 1.25mi |
| 2138 Phillips Aly Colorado Springs, CO | 3.0 | 2.5 | 1602 | $2,072 | $1.29 | 14d | 1 | 1.26mi |
| 2874 Carmel Cir Colorado Springs, CO | 4.0 | 1.0 | 1117 | $1,995 | $1.79 | 2d | 1 | 1.35mi |
| 2335 CoralBell Grv Colorado Springs, CO | 1.0–3.0 | 1.0–2.0 | 997 | $2,498 | $2.50 | 23d | 34 | 1.35mi |
| 2335 CoralBell Grv Colorado Springs, CO | 2.0–3.0 | 1.0–2.0 | 1004 | $2,195 | $2.19 | 2d | 7 | 1.35mi |
| 2115 Birmingham Loop Colorado Springs, CO | 1.0–3.0 | 1.0–2.0 | 923 | $2,382 | $2.58 | 2d | 24 | 1.36mi |
| 1953 Birmingham Loop Colorado Springs, CO | 3.0 | 2.0 | 1692 | $2,500 | $1.48 | 11d | 1 | 1.41mi |
| 1518 Tyram Grv Unit 102 Colorado Springs, CO | 3.0 | 3.0 | 1552 | $2,195 | $1.41 | 2d | 1 | 1.48mi |
| 2046 Del Mar Dr Colorado Springs, CO | 5.0 | 2.0 | 1824 | $2,500 | $1.37 | 2d | 1 | 1.49mi |
Listing history 34 events
-
2026-06-18days on market $279,900 Active 82 DOM
-
2026-06-17days on market $279,900 Active 81 DOM
-
2026-06-16days on market $279,900 Active 80 DOM
-
2026-06-15price $279,900 Active 79 DOM
-
2026-06-15days on market $289,900 Active 79 DOM
-
2026-06-14days on market $289,900 Active 77 DOM
-
2026-06-10days on market $289,900 Active 74 DOM
-
2026-06-09days on market $289,900 Active 73 DOM
-
2026-06-08days on market $289,900 Active 72 DOM
-
2026-06-07days on market $289,900 Active 71 DOM
-
2026-06-05days on market $289,900 Active 68 DOM
-
2026-06-03days on market $289,900 Active 67 DOM
-
2026-06-03days on market $289,900 Active 66 DOM
-
2026-06-01days on market $289,900 Active 65 DOM
-
2026-05-31days on market $289,900 Active 64 DOM
-
2026-05-12price $289,900
-
2026-03-28$309,900 Active
-
2025-03-28historical
-
2025-03-28historical
-
2025-01-30$330,000 Active
-
2025-01-30$330,000 Active
-
2023-09-15historical
-
2023-09-15historical
-
2023-08-20price $340,000
-
2023-08-20price $340,000
-
2023-08-20price $340,000
-
2023-08-05price $355,000
-
2023-08-05price $355,000
-
2023-08-05price $355,000
-
2023-07-22$365,000 Active
-
2023-07-22$365,000 Active
-
2021-07-08soldstatus $321,000
-
2018-10-02soldstatus $225,000
-
1967-07-01soldstatus $13,800
ⓘ Source: listings_history table (triggers on properties + properties_extension) + one-shot
backfill from property_details.listing_events for pre-trigger history.
Tax reassessment forecast CO · Resets to sale price
- Current annual tax
- $1,129 · $94/mo
- Projected year-2 tax
- $1,539 · $128/mo
- Expected delta
- +$411/yr (+$34/mo · 36.4%)
ⓘ Screening estimate from a state-policy table — verify with the county assessor before closing.
Climate risk First Street
- Flood 1/10 Low FEMA zone X (unshaded) · 0% chance over 30 yrs
- Wildfire 1/10 Low
- Heat 2/10 Low 7 d/yr ≥89°F today · 18 d/yr by 30 yrs out
- Wind 2/10 Low
- Air quality 1/10 Low 0 unhealthy d/yr today · 0 by 30 yrs out
Nearby sold comps map
Loading sold comps map…
Walkable amenities ~0.75 mi
Loading nearby amenities…
Taxation est. · year 1
- Rental income
- $26,736
- − Mortgage interest
- −$15,679
- − Property taxes
- −$1,129
- − Insurance
- −$1,400
- − Repairs & maintenance
- −$2,139
- − Management
- −$2,139
- − Depreciation
- −$8,143
- Taxable loss
- −$3,892
- Est. tax savings @ 24.0%
- +$934
- After-tax cash flow
- $1,913/yr
For passive investors: Depreciation is non-cash, so a rental often shows a tax loss while cash-flowing — sheltering income. Rental losses are passive: they offset passive income freely, and up to $25,000/yr can offset ordinary (W-2) income if you actively participate and your MAGI is under $100k (phasing out to $0 by $150k); unused losses carry forward. On sale, claimed depreciation is recaptured at up to 25%, and gains may owe capital-gains tax (a 1031 exchange can defer both). Figures are a year-1 estimate at your 24.0% rate — not tax advice; consult a CPA.
Schools (NCES district)
- District
- Colorado Springs School District No. 11 In The County Of E
- NCES district ID
- 0803060
- Math proficiency
- 20% ▼ -8.00%
- Reading proficiency
- 37% ▼ -4.00%
- Median HH income
- $47,884
- Composite
- 24.69/100
- National rank
- #7613
- State rank
- #56 of 86 in CO
Livability — Colorado Springs
- Score
- 78/100
- State rank
- #23
- US rank
- #2639
Category grades
Schools grade is shown separately in the Schools card above.
Census & demographics
- Census place
- Colorado Springs, CO
- County
- El Paso County · 689,348 people
- City population
- 555,783
- Metro
- Colorado Springs, CO
- Population (ZIP)
- 31,368
- Household income
- $61,969
- Rent vs Own
- Severe rent burden
- 1449.0
Population outlook (El Paso County) Hauer SSP2
- Today (2025)
- 768,926 people
- By 2030
- 815,739 · +6.1%
- By 2040
- 903,489 · +17.5%
- By 2050
- 981,204 · +27.6%
- By 2075
- 1,155,542 · +50.3%
- By 2100
- 1,202,070 · +56.3%
Race, ethnicity, and origin ACS 2023
- Neighborhood character
- Diverse neighborhood (Simpson 0.68)
- Race & ethnicity
- White 44% Hispanic / Latino 33% Two or more races 17% Black 11% Native American 3% Asian 3%
- Hispanic origin (detail)
- Mexican 24% Puerto Rican 3%
- Common ancestry
- Italian 2% Slovak 2% Lithuanian 2%
- Foreign-born
- 11% · Canada, South Korea
- Languages at home
- 78% English-only · Spanish 17% German/W. Germanic 1% Other Indo-European 1%
Political lean MEDSL · El Paso
- 2024 margin
- Lean R (+9.8) · D 43.8% · R 53.5% · Other 2.7%
- 2008→2024 swing
- +9.0pp toward D · 2008: -18.8pp · 2024: -9.8pp
- All cycles
- 2024: R+9.8 2020: R+10.8 2016: R+22.6 2012: R+21.4 2008: R+18.8
Not yet ingested
- Civics
- —
Market trends
- HPI YoY
- ▼ -121.36%
- Current HPI
- 320.6817
- Rent YoY
- ▼ -1.51%
- Metro
- Colorado Springs, CO
- State GDP YoY
- ▲ 1.95%
- F500 in state
- 14
Industry mix (Fortune 500 HQ in CO)
| Industry | F500 HQs | Revenue |
|---|---|---|
| Technology Distribution | 1 | $31B |
|
||
| Food / Agriculture | 1 | $18B |
|
||
| Packaging | 1 | $14B |
|
||
| Healthcare | 1 | $13B |
|
||
| Energy | 1 | $10B |
|
||
| Technology | 1 | $4B |
|
||
Price history
+2000.7% since first listed19 events — show timeline
- 2026-05-12 Price Changed $289,900 elevateMLS
- 2026-03-28 Listed $309,900 elevateMLS
- 2025-03-28 Listing Removed — REColorado as Distributed by MLS Grid
- 2025-03-28 Listing Removed — IRES
- 2025-01-30 Listed $330,000 REColorado as Distributed by MLS Grid
- 2025-01-30 Listed $330,000 IRES
- 2023-09-15 Listing Removed — REColorado as Distributed by MLS Grid
- 2023-09-15 Listing Removed — IRES
- 2023-08-20 Price Changed $340,000 elevateMLS
- 2023-08-20 Price Changed $340,000 REColorado as Distributed by MLS Grid
- 2023-08-20 Price Changed $340,000 IRES
- 2023-08-05 Price Changed $355,000 elevateMLS
- 2023-08-05 Price Changed $355,000 REColorado as Distributed by MLS Grid
- 2023-08-05 Price Changed $355,000 IRES
- 2023-07-22 Listed $365,000 REColorado as Distributed by MLS Grid
- 2023-07-22 Listed $365,000 IRES
- 2021-07-08 Sold (Public Records) $321,000 Public Records
- 2018-10-02 Sold (Public Records) $225,000 Public Records
- 1967-07-01 Sold (Public Records) $13,800 Public Records
Property tax history
+3.2%/yrLatest (2024): $1,129 · +10.9% YoY. Source: county tax records.
Cash-flow waterfall
monthlySold comps — $/sqft
last 12 mo · ≤1 miLoading sold comps…