5100 N Hwy 99 #245 · Morada, CA
Flood risk 1/10 · Minimal
- FEMA flood zone
- X
- Chance of flooding over 30 yrs
- 0.0%
- Est. flood insurance / yr
- $507 – $1,088
Fire risk 6/10 · Moderate
- Est. fire insurance / yr
- $659 – $1,223
Heat risk 7/10 · Major
- Hot days now (above 102°F)
- 7 days/yr
- Hot days in 30 yrs
- 15 days/yr
Wind risk 1/10 · Minimal
- Chance of severe wind over 30 yrs
- —
Air-quality risk 10/10 · Severe
- Unhealthy air days now
- 27 days/yr
- Unhealthy air days in 30 yrs
- 29 days/yr
Risk factors via First Street. Map © Google.
Why this score? — see what drove the C+ grade
The composite is a weighted blend of 9 inputs, each scored 0–100. Each bar is that input's sub-score; the figure is the points it added to the 100-point composite (weight × sub-score).
- Cash flow +30.0/30.0
- 1% rule +10.0/10.0
- DSCR +10.0/10.0
- Livability +3.0/5.0
- Schools +2.7/10.0
- Rent growth +2.5/5.0
- Condition / age +2.2/5.0
- ARV discount +1.0/15.0
- Appreciation +0.0/10.0
$115,000
🖨 Deal sheet 📄 Offer letter ✓ Due diligence
Listing remarks
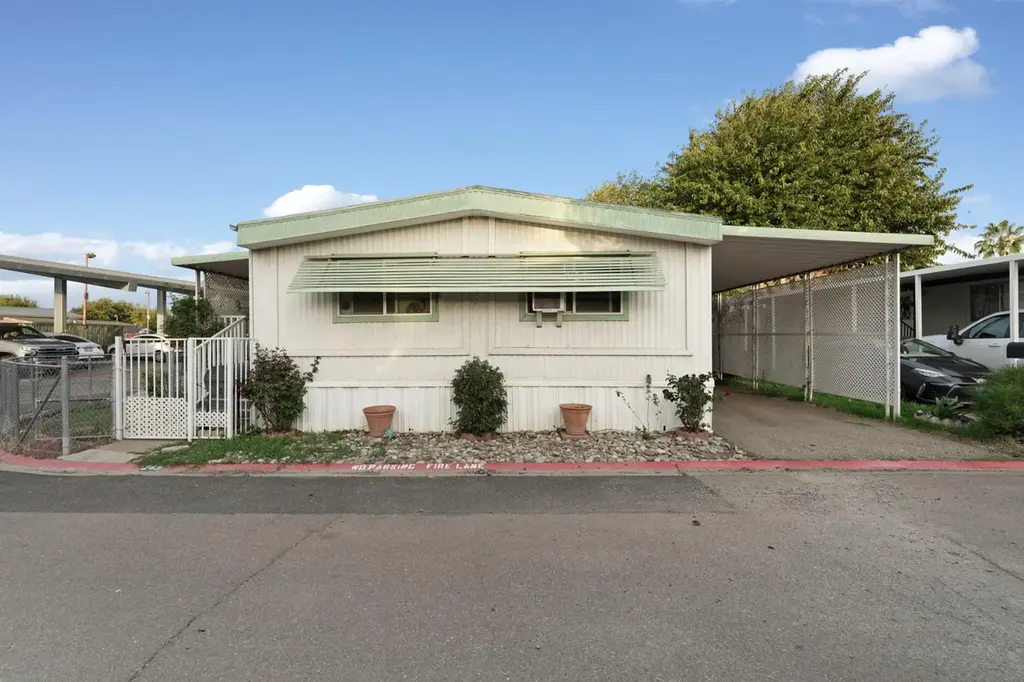
This beautifully maintained 3-bedroom, 2-bath manufactured home offers the perfect blend of comfort and convenience. With approximately 1,152 sq. ft. of living space, you'll enjoy granite slab kitchen counters, an open floor plan, and a detached carport. Situated on a generously sized lot within a well-managed, all-ages gated community, this home is ideal for families, first-time buyers, or investors seeking a move-in ready opportunity. The Shadow Lake community boasts amenities such as two pools, a serene duck pond, clubhouse, laundry facilities, and 24/7 surveillance, creating a secure and peaceful environment. 🌳🦆🏊♀️ Located just off Highway 99, this home provides easy access to H
Key facts
- Parking
- Built 1975
- Listed 225 days
Neighborhood map
What this means for you Summary
Snapshot
- This is a 3-bed/2.0-bath manufactured listed at $115k. Condition is rated fair.
Deal economics
- At list price, monthly cash flow is $2k ($22k/yr) — positive.
- The deal already cash-flows at list — no discount required.
- Meets the 1% rule at list price ($3k rent vs $115k).
- Recommended offer: $101k (12.0% below list) — sets the bar for market timing.
- Cap rate 25.0% vs local median 2.7% in Morada — top-decile yield for the area; either an underpriced asset or a hidden risk that comps aren't pricing in. Stress-test before assuming the spread holds.
Location & tenants
- Location reads 60/100 on livability (#596 in CA) — a middle-class / working-renter tenant base. Strengths: crime A+, employment A+, housing A+; Watch: amenities F, commute F, cost of living F.
- Lodi Unified (urban): math 24% / reading 36% proficiency, ranked #325 of 517 in CA (top 63%) — families likely to look elsewhere, expect single-tenant / working-renter base with shorter leases.
- Market conditions: 160 active listings in the ZIP; 5 comparable units currently listed for rent nearby; rentals at typical pace (median 15d on market — plan ~3-4 weeks tenant-placement turnaround); high-income renter base; 3,779 units permitted in San Joaquin County in 2024 (0 in 5+ unit buildings).
- This rent runs 35% of the median local income ($112k/yr) — at the standard rent-burdened threshold; future hikes will face affordability resistance.
Forward outlook
- Local home prices are declining (-3.0%/yr); year-one equity from $795 of loan paydown is wiped out by about $3k of value loss. Plan a longer hold.
- San Joaquin County population projected at +17% by 2050 — long-run rental-demand tailwind backs the buy-and-hold thesis.
- At projected returns (-3.0% appreciation + 3.0% rent growth), your $32k cash investment doubles in ~2 years — after that, you're playing with house money.
Negotiation context
- It's been on market 225 days — a 12% lower offer ($101k) is reasonable based on typical stale-listing flexibility.
Risks & watch-outs
- Climate carrying-cost: major wildfire risk; extreme-heat days projected 7→15/yr by 2055 (HVAC capex compounding) — expect insurance premiums to compound above CPI over the hold.
Questions for the listing agent
- It's been on market 225 days. Have you received any prior offers? Is the seller open to a 12% concession, seller financing, or rate buy-down credit?
- Have any recent inspections been done? Can we get a copy of the seller's disclosures and any deferred-maintenance estimates?
- Built in 1975 — when were the roof, HVAC, electrical panel, plumbing, and water heater last replaced?
- Why hasn't it sold? Are there any deal-killer items the seller is aware of (foundation, flood, title, zoning, code violations)?
- Is there a deadline driving the sale (1031 exchange, divorce, estate, relocation)? That informs how much negotiation room exists.
- What's the average days-on-market for RENTAL listings here right now (not sales)? A rising rental-DOM trend means longer vacancies and softer asking-rent achievability than the comps imply.
- What's the recent tenant-quality profile in this submarket — average credit score on applications, eviction rate, late-payment / NSF rate, and stable-employment percentage? A property-management company in the area should have these aggregated.
- How much new for-sale + rental construction is in the pipeline within 1–3 miles? Heavy new supply typically softens prices + rents 12–24 months out; constrained supply supports both.
Investment metrics
- 1% rule
- 2.85% ✓
- Cap rate
- 24.99%
- Cash-on-cash
- 66.78%
- DSCR
- 3.97
- GRM
- 2.9
CMA / ARV
- ARV (median comp)
- $100,465
- List price
- $115,000
- Delta
- 14.47%
- Verdict
- OVERPRICED
- Comps
- 20 within 1.0 mi
Show comp detail 7 sales within ~0.75 mi
| Address | Dist | Beds/Ba | Sqft | Sold | Price | $/sf | Match |
|---|---|---|---|---|---|---|---|
| 5100 N Hwy 99 #27 | 0.00mi | 3/2.0 | 1,152 (0%) | 2mo | $166,500 | $145 | 98 |
| 10780 N Highway 99 #45 | 0.06mi | 2/2.0 (-1) | 1,140 (-1%) | 1mo | $57,000 | $50 | 90 |
| 4900 N Hwy 99 #30 | 0.00mi | 2/2.0 (-1) | 1,152 (0%) | 22mo | $109,950 | $95 | 76 |
| 10780 N N Hwy 99 #6 | 0.06mi | 2/2.0 (-1) | 1,200 (+4%) | 12mo | $85,000 | $71 | 75 |
| 10780 N Hwy 99 #69 | 0.06mi | 2/2.0 (-1) | 1,056 (-8%) | 9mo | $90,000 | $85 | 70 |
| 9454 N Highway 99 #20 | 0.06mi | 2/2.0 (-1) | 1,296 (+12%) | 13mo | $80,000 | $62 | 60 |
| 4900 N Highway 99 #227 | 0.00mi | 2/2.0 (-1) | 1,040 (-10%) | 23mo | $75,000 | $72 | 60 |
Match score weights: distance 35% · size 25% · config 20% · recency 20%. Top-matched comps best support the ARV.
Projected returns pro-forma
-3.0% appreciation · 3.0% rent growth · sell at horizon
- IRR
- 66.1%
- Equity multiple
- 3.97×
- Total profit
- $95,552
- Equity at exit
- $17,147
- IRR
- 70.4%
- Equity multiple
- 8.15×
- Total profit
- $230,376
- Equity at exit
- $9,943
Cash invested: $32,200 (down + closing). Projections, not guarantees.
Landlord ↔ Tenant lean methodology
- Overall (STATE)
- 18 Strongly Tenant-Friendly
- State California
- 18 Strongly Tenant-Friendly · D+13
- County
- — inherits STATE
- City
- — inherits STATE
ZIP-level market 95212
- Active inventory
- 160
- Price-to-rent
- 2.9×
Monthly cashflow live
- Estimated rent
- $3,274 high interval (Pro) →
- Mortgage (P&I)
- −$603
- Tax est. 1.5%
- −$144 /mo · $1,725/yr
- Insurance
- −$48
- HOA
- −$0
- Vacancy / Maint / Mgmt
- −$688
- Net cashflow
- $1,792
Break-even live
UW: 25.0% down · 7.5% · 30yr · 1.5% tax · 5.0% vac · 8.0% maint · 8.0% mgmt
Financing live
Cash to close
- Down payment
- $28,750
- Closing costs
- $3,450
- Reserves months
- —
- Total cash needed
- —
Loan-product check · same deal, 3 products live
Conventional
25% down · 7.5% · 30yr
- Down + closing
- —
- Monthly P&I
- —
- Monthly cashflow
- —
- DSCR
- —
- Eligible?
- —
Personal DTI + credit; lowest rate.
DSCR
20% down · 8.5% · 30yr
- Down + closing
- —
- Monthly P&I
- —
- Monthly cashflow
- —
- DSCR
- —
- Eligible?
- —
No personal income docs; deal must DSCR.
Hard money
10% down · 12.0% · 12mo
- Down + closing
- —
- Monthly P&I
- —
- Monthly cashflow
- —
- DSCR
- —
- Eligible?
- —
Short-term bridge; refi at stabilization.
Rent comps 5 comps
| Address | Beds | Baths | Sqft | Rent | $/sqft | DOM | Units | Dist |
|---|---|---|---|---|---|---|---|---|
| 3461 Sina Ct Stockton, CA | 3.0 | 2.0 | 1335 | $3,000 | $2.25 | 44d | 1 | 0.80mi |
| 10400 Skynyrd Way Stockton, CA | 3.0 | 2.0 | 1342 | $4,500 | $3.35 | 14d | 1 | 0.94mi |
| 4142 E Morada Ln Stockton, CA | 2.0 | 2.0 | 1063 | $2,314 | $2.18 | 21d | 1 | 1.34mi |
| 4030 E Morada Ln Stockton, CA | 2.0 | 1.0–2.0 | 811 | $2,340 | $2.88 | 3d | 26 | 1.39mi |
| 9326 Lembert Dome Cir Stockton, CA | 3.0 | 2.0 | 1490 | $2,645 | $1.78 | 3d | 1 | 1.43mi |
Listing history 14 events
-
2026-06-18days on market $115,000 Active 225 DOM
-
2026-06-17days on market $115,000 Active 224 DOM
-
2026-06-16days on market $115,000 Active 223 DOM
-
2026-06-15days on market $115,000 Active 222 DOM
-
2026-06-14days on market $115,000 Active 220 DOM
-
2026-06-10days on market $115,000 Active 217 DOM
-
2026-06-09days on market $115,000 Active 216 DOM
-
2026-06-08days on market $115,000 Active 215 DOM
-
2026-06-07days on market $115,000 Active 214 DOM
-
2026-06-05days on market $115,000 Active 211 DOM
-
2026-06-03days on market $115,000 Active 210 DOM
-
2026-06-03days on market $115,000 Active 209 DOM
-
2026-06-01days on market $115,000 Active 208 DOM
-
2026-05-31days on market $115,000 Active 207 DOM
ⓘ Source: listings_history table (triggers on properties + properties_extension) + one-shot
backfill from property_details.listing_events for pre-trigger history.
Climate risk First Street
- Flood 1/10 Low FEMA zone X · 0% chance over 30 yrs
- Wildfire 6/10 Major
- Heat 7/10 Severe 7 d/yr ≥102°F today · 15 d/yr by 30 yrs out
- Wind 1/10 Low
- Air quality 10/10 Extreme 27 unhealthy d/yr today · 29 by 30 yrs out
Nearby sold comps map
Loading sold comps map…
Walkable amenities ~0.75 mi
Loading nearby amenities…
Taxation est. · year 1
- Rental income
- $39,293
- − Mortgage interest
- −$6,442
- − Property taxes
- −$1,725
- − Insurance
- −$575
- − Repairs & maintenance
- −$3,143
- − Management
- −$3,143
- − Depreciation
- −$3,345
- Taxable income
- $20,919
- Est. tax owed @ 24.0%
- −$5,021
- After-tax cash flow
- $16,484/yr
For passive investors: Depreciation is non-cash, so a rental often shows a tax loss while cash-flowing — sheltering income. Rental losses are passive: they offset passive income freely, and up to $25,000/yr can offset ordinary (W-2) income if you actively participate and your MAGI is under $100k (phasing out to $0 by $150k); unused losses carry forward. On sale, claimed depreciation is recaptured at up to 25%, and gains may owe capital-gains tax (a 1031 exchange can defer both). Figures are a year-1 estimate at your 24.0% rate — not tax advice; consult a CPA.
Condition & rehab AI · 12 photos
This 3-bedroom, 2-bath manufactured home requires moderate repairs and maintenance to improve its condition and value. Upgrading the interior walls, flooring, and appliances would significantly enhance its appeal and resale potential.
Repairs flagged
- Moderate siding — Weathered and discolored
- Moderate flooring — Worn hardwood
- Minor interior walls — Some paint chipping
- Moderate kitchen appliances — Older and dated
- Minor bathroom fixtures — Standard and dated
- Minor HVAC units — Standard units with some wear
Value-add opportunities
- Both Paint interior walls — Enhances curb appeal and interior aesthetics
- Both Replace worn flooring — Improves living space and resale value
- Both Upgrade kitchen appliances — Modernizes the space and attracts more buyers
- Both Replace dated bathroom fixtures — Enhances functionality and appeal
- Both Upgrade HVAC units — Improves comfort and energy efficiency
Renovation cost estimate screening
| Repair item | Severity | Est. cost |
|---|---|---|
| siding · Weathered and discolored | Moderate | $3,000–15,000 |
| flooring · Worn hardwood | Moderate | $3,000–15,000 |
| interior walls · Some paint chipping | Minor | $500–3,000 |
| kitchen appliances · Older and dated | Moderate | $3,000–15,000 |
| bathroom fixtures · Standard and dated | Minor | $500–3,000 |
| HVAC units · Standard units with some wear | Minor | $500–3,000 |
| Total estimated repair cost · 6 items | $10,500–54,000 |
Value-add ROI direction
- Both Paint interior walls — Enhances curb appeal and interior aesthetics ↑
- Both Replace worn flooring — Improves living space and resale value ↑
- Both Upgrade kitchen appliances — Modernizes the space and attracts more buyers ↑
- Both Replace dated bathroom fixtures — Enhances functionality and appeal ↑
- Both Upgrade HVAC units — Improves comfort and energy efficiency ↑
ⓘ Cost ranges are severity-bucket heuristics (US national rule-of-thumb). Get contractor quotes + a written scope before underwriting a rehab budget.
Schools (NCES district)
- District
- Lodi Unified
- NCES district ID
- 0622230
- Math proficiency
- 24% ▼ -8.00%
- Reading proficiency
- 36% ▼ -8.00%
- Median HH income
- $57,165
- Composite
- 26.84/100
- National rank
- #7108
- State rank
- #325 of 517 in CA
Livability — Morada
- Score
- 60/100
- State rank
- #596
- US rank
- #19273
Category grades
Schools grade is shown separately in the Schools card above.
Census & demographics
- Census place
- Morada, CA
- County
- San Joaquin County · 729,570 people
- Metro
- Stockton, CA
- Population (ZIP)
- 28,437
- Household income
- $111,720
- Rent vs Own
- Severe rent burden
- 414.0
Population outlook (San Joaquin County) Hauer SSP2
- Today (2025)
- 796,965 people
- By 2030
- 828,849 · +4.0%
- By 2040
- 885,611 · +11.1%
- By 2050
- 929,798 · +16.7%
- By 2075
- 994,578 · +24.8%
- By 2100
- 971,291 · +21.9%
Race, ethnicity, and origin ACS 2023
- Neighborhood character
- Highly diverse neighborhood (Simpson 0.70)
- Race & ethnicity
- Asian 43% Hispanic / Latino 24% White 22% Two or more races 12% Black 6% Native American 2%
- Hispanic origin (detail)
- Mexican 21%
- Common ancestry
- Italian 2% Slovak 2% Romanian 1%
- Foreign-born
- 31% · Canada, Vietnam, China
- Languages at home
- 49% English-only · Spanish 18% Other Asian/Pacific 10% Tagalog/Filipino 9%
Political lean MEDSL · San Joaquin
- 2024 margin
- Toss-up / Even · D 48.0% · R 48.9% · Other 3.0%
- 2008→2024 swing
- -11.6pp toward R · 2008: 10.7pp · 2024: -0.9pp
- All cycles
- 2024: R+0.9 2020: D+13.9 2016: D+12.9 2012: D+8.9 2008: D+10.7
Not yet ingested
- Civics
- —
Market trends
- HPI YoY
- ▼ -188.93%
- Current HPI
- 265.3844
- Rent YoY
- —
- Metro
- Stockton, CA
- State GDP YoY
- ▲ 3.21%
- F500 in state
- 116
Industry mix (Fortune 500 HQ in CA)
| Industry | F500 HQs | Revenue |
|---|---|---|
| Technology | 27 | $1,492B |
|
||
| Financial Services | 3 | $174B |
|
||
| Retail | 3 | $44B |
|
||
| Insurance | 3 | $26B |
|
||
| Media / Entertainment | 2 | $115B |
|
||
| Pharmaceuticals / Biotech | 2 | $62B |
|
||
Cash-flow waterfall
monthlySold comps — $/sqft
last 12 mo · ≤1 miLoading sold comps…