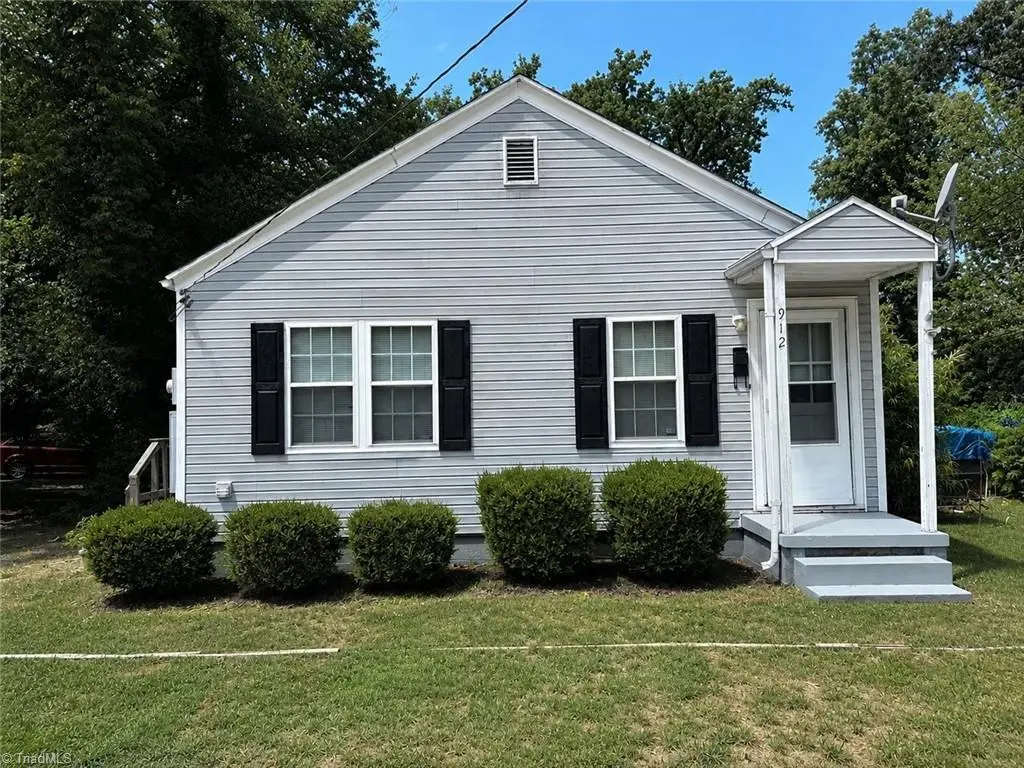
912 S English St · Greensboro, NC
Flood risk 1/10 · Minimal
- FEMA flood zone
- X (unshaded)
- Chance of flooding over 30 yrs
- 0.0%
- Est. flood insurance / yr
- $507 – $1,088
Fire risk 1/10 · Minimal
- Est. fire insurance / yr
- $906 – $1,684
Heat risk 6/10 · Moderate
- Hot days now (above 103°F)
- 7 days/yr
- Hot days in 30 yrs
- 18 days/yr
Wind risk 4/10 · Minor
- Chance of severe wind over 30 yrs
- 16.0%
Air-quality risk 2/10 · Minimal
- Unhealthy air days now
- 1 days/yr
- Unhealthy air days in 30 yrs
- 2 days/yr
Risk factors via First Street. Map © Google.
Why this score? — see what drove the D+ grade
The composite is a weighted blend of 9 inputs, each scored 0–100. Each bar is that input's sub-score; the figure is the points it added to the 100-point composite (weight × sub-score).
- Cash flow +23.8/30.0
- DSCR +7.7/10.0
- 1% rule +5.0/10.0
- Livability +4.0/5.0
- Schools +3.6/10.0
- Rent growth +2.9/5.0
- Condition / age +2.5/5.0
- ARV discount +0.0/15.0
- Appreciation +0.0/10.0
$115,000
🖨 Deal sheet 📄 Offer letter ✓ Due diligence
Listing remarks MLS
Welcome to 912 S English Street, this charming home is good for investors! Nestled in a quiet, established neighborhood just minutes from downtown Greensboro, this property offers both comfort and style. This home features two bedrooms, one bath home and outside, enjoy a large fenced backyard perfect for gardening, play, or outdoor gatherings. Don't wait to long, book a tour today!
Key facts
- 6,969 sq ft lot
- Built 1953
- Listed 12 days
Tags
Property features AI
Finance
- Other: Located in the Washington Park subdivision
- HOA & community: Not in an association
Exterior
- Parking: Driveway
- Utilities: Public sewer; Electric water heater; Electric-powered systems
- Home design: Single-story house; Stick/site-built residential structure; Built in 1953; Existing structure
- Construction: Vinyl siding; Crawl space foundation
- Exterior features: Public water; Publicly maintained road; Lot about 0.16 acres; No pool; No guest house
Interior
- Bathrooms: One full bathroom
- Heating & cooling: Baseboard heating (electric)
- Interior features: Primary bedroom located on the main level; Attic access only
Neighborhood map
What this means for you Summary
Snapshot
- This is a 2-bed/1.0-bath single-family listed at $115k.
Deal economics
- At list price, monthly cash flow is $221 ($3k/yr) — positive.
- The deal already cash-flows at list — no discount required.
- Meets the 1% rule at list price ($1k rent vs $115k).
- Cap rate 8.6% vs local median 3.8% in Greensboro — top-decile yield for the area; either an underpriced asset or a hidden risk that comps aren't pricing in. Stress-test before assuming the spread holds.
Location & tenants
- Location reads 81/100 on livability (#12 in NC, #1,335 nationally) — a professional / high-income tenant draw. Strengths: amenities A+, commute A+, cost of living A+; Watch: employment D, crime F.
- Guilford County Schools (urban): math 39% / reading 45% proficiency, ranked #99 of 178 in NC (top 56%) — families likely to look elsewhere, expect single-tenant / working-renter base with shorter leases.
- Market conditions: Rents rising (+1.8%/yr); 125 active listings in the ZIP; 8 comparable units currently listed for rent nearby; rentals at typical pace (median 23d on market — plan ~3-4 weeks tenant-placement turnaround); 3,843 units permitted in Guilford County in 2024 (2,397 in 5+ unit buildings).
Forward outlook
- Local home prices are declining (-3.0%/yr); year-one equity from $795 of loan paydown is wiped out by about $3k of value loss. Plan a longer hold.
- Guilford County population projected at +26% by 2050 — long-run rental-demand tailwind backs the buy-and-hold thesis.
Negotiation context
- Only 12 days on market — expect competitive offers; lowballing is unlikely to land.
- 2 sale attempts with the ask held roughly flat each time — persistent listings suggest the price (not the market) is what's stuck; bring a comps-based counter.
- Current owner paid $85k; 35% above their basis — modest negotiation headroom, anchor on the comps not their cost.
Risks & watch-outs
- Watch-outs: built in 1953 — expect roof / HVAC / electrical / plumbing capex.
- Climate carrying-cost: extreme-heat days projected 7→18/yr by 2055 (HVAC capex compounding) — expect insurance premiums to compound above CPI over the hold.
Questions for the listing agent
- Built in 1953 — when were the roof, HVAC, electrical panel, plumbing, and water heater last replaced?
- Is there a deadline driving the sale (1031 exchange, divorce, estate, relocation)? That informs how much negotiation room exists.
- Crime grade is F in this area — have there been break-ins, vandalism, or insurance claims at this property in the last 3 years? What carrier currently insures it and at what premium?
- The area grade is low — what's the realistic commute time and amenity access for the typical tenant pool here? Any planned neighborhood developments (good or bad) we should know about?
- What's the average days-on-market for RENTAL listings here right now (not sales)? A rising rental-DOM trend means longer vacancies and softer asking-rent achievability than the comps imply.
- What's the recent tenant-quality profile in this submarket — average credit score on applications, eviction rate, late-payment / NSF rate, and stable-employment percentage? A property-management company in the area should have these aggregated.
- How much new for-sale + rental construction is in the pipeline within 1–3 miles? Heavy new supply typically softens prices + rents 12–24 months out; constrained supply supports both.
Investment metrics
- 1% rule
- 1.00% ✓
- Cap rate
- 8.60%
- Cash-on-cash
- 8.25%
- DSCR
- 1.37
- GRM
- 8.3
CMA / ARV
- ARV (on-the-fly)
- $84,672
- Comps found
- 2
Show comp detail 2 sales within ~0.75 mi
| Address | Dist | Beds/Ba | Sqft | Sold | Price | $/sf | Match |
|---|---|---|---|---|---|---|---|
| 912 S English St | 0.00mi | 2/1.0 | 672 (0%) | 4mo | $85,000 | $126 | 97 |
| 915 S English St | 0.03mi | 2/1.0 | 672 (0%) | 2mo | $80,000 | $119 | 97 |
Match score weights: distance 35% · size 25% · config 20% · recency 20%. Top-matched comps best support the ARV.
Projected returns pro-forma
-3.0% appreciation · 1.78% rent growth · sell at horizon
- IRR
- -5.0%
- Equity multiple
- 0.81×
- Total profit
- $-5,979
- Equity at exit
- $17,147
- IRR
- 3.2%
- Equity multiple
- 1.22×
- Total profit
- $7,161
- Equity at exit
- $9,943
Cash invested: $32,200 (down + closing). Projections, not guarantees.
Landlord ↔ Tenant lean methodology
- Overall (STATE)
- 85 Strongly Landlord-Friendly
- State North Carolina
- 85 Strongly Landlord-Friendly · R+3
- County
- — inherits STATE
- City
- — inherits STATE
ZIP-level market 27401
- Home prices YoY
- -28.9%
- Rents YoY
- 1.8%
- Active inventory
- 125
- Price-to-rent
- 8.3×
Monthly cashflow live
- Estimated rent
- $1,152 high interval (Pro) →
- Mortgage (P&I)
- −$603
- Tax from tax record
- −$38 /mo · $457/yr
- Insurance
- −$48
- HOA
- −$0
- Vacancy / Maint / Mgmt
- −$242
- Net cashflow
- $221
Break-even live
UW: 25.0% down · 7.5% · 30yr · 1.5% tax · 5.0% vac · 8.0% maint · 8.0% mgmt
Financing live
Cash to close
- Down payment
- $28,750
- Closing costs
- $3,450
- Reserves months
- —
- Total cash needed
- —
Loan-product check · same deal, 3 products live
Conventional
25% down · 7.5% · 30yr
- Down + closing
- —
- Monthly P&I
- —
- Monthly cashflow
- —
- DSCR
- —
- Eligible?
- —
Personal DTI + credit; lowest rate.
DSCR
20% down · 8.5% · 30yr
- Down + closing
- —
- Monthly P&I
- —
- Monthly cashflow
- —
- DSCR
- —
- Eligible?
- —
No personal income docs; deal must DSCR.
Hard money
10% down · 12.0% · 12mo
- Down + closing
- —
- Monthly P&I
- —
- Monthly cashflow
- —
- DSCR
- —
- Eligible?
- —
Short-term bridge; refi at stabilization.
Rent comps 8 comps
| Address | Beds | Baths | Sqft | Rent | $/sqft | DOM | Units | Dist |
|---|---|---|---|---|---|---|---|---|
| 2001 Spencer St Greensboro, NC | 2.0 | 1.0 | 720 | $1,295 | $1.80 | 23d | 1 | 0.18mi |
| 307 Avalon Rd Greensboro, NC | 1.0–2.0 | 1.0 | 650 | $895 | $1.38 | 23d | 3 | 0.34mi |
| 402 Winston St Greensboro, NC | 2.0 | 1.0 | 640 | $1,150 | $1.80 | 23d | 1 | 0.89mi |
| 1112 Stephens St Greensboro, NC | 2.0 | 1.0 | 744 | $1,250 | $1.68 | 18d | 1 | 1.04mi |
| 1001 E Bragg St Apt B Greensboro, NC | 2.0 | 1.0 | 700 | $925 | $1.32 | 14d | 1 | 1.10mi |
| 3520 Calumet Pl Greensboro, NC | 1.0 | 1.0 | 650 | $1,150 | $1.77 | 23d | 1 | 1.23mi |
| 3715 Cameron Ave Unit B Greensboro, NC | 2.0 | 1.0 | 680 | $950 | $1.40 | 18d | 1 | 1.33mi |
| 702 Ross Ave Greensboro, NC | 2.0 | 1.0 | 672 | $1,200 | $1.79 | 23d | 1 | 1.48mi |
Listing history 10 events
-
2026-06-18days on market $115,000 Active 12 DOM
-
2026-06-17days on market $115,000 Active 11 DOM
-
2026-06-16days on market $115,000 Active 10 DOM
-
2026-06-15days on market $115,000 Active 9 DOM
-
2026-06-14days on market $115,000 Active 7 DOM
-
2026-06-10days on market $115,000 Active 4 DOM
-
2026-06-09days on market $115,000 Active 3 DOM
-
2026-06-08days on market $115,000 Active 2 DOM
-
2026-06-07remarks 699-char remark
-
2026-06-07$115,000 Active 1 DOM
ⓘ Source: listings_history table (triggers on properties + properties_extension) + one-shot
backfill from property_details.listing_events for pre-trigger history.
Tax reassessment forecast NC · Resets to sale price
- Current annual tax
- $457 · $38/mo
- Projected year-2 tax
- $943 · $79/mo
- Expected delta
- +$486/yr (+$41/mo · 106.4%)
ⓘ Screening estimate from a state-policy table — verify with the county assessor before closing.
Climate risk First Street
- Flood 1/10 Low FEMA zone X (unshaded) · 0% chance over 30 yrs
- Wildfire 1/10 Low
- Heat 6/10 Major 7 d/yr ≥103°F today · 18 d/yr by 30 yrs out
- Wind 4/10 Moderate 16% chance of damaging wind over 30 yrs
- Air quality 2/10 Low 1 unhealthy d/yr today · 2 by 30 yrs out
Nearby sold comps map
Loading sold comps map…
Walkable amenities ~0.75 mi
Loading nearby amenities…
Taxation est. · year 1
- Rental income
- $13,830
- − Mortgage interest
- −$6,442
- − Property taxes
- −$457
- − Insurance
- −$575
- − Repairs & maintenance
- −$1,106
- − Management
- −$1,106
- − Depreciation
- −$3,345
- Taxable income
- $798
- Est. tax owed @ 24.0%
- −$191
- After-tax cash flow
- $2,465/yr
For passive investors: Depreciation is non-cash, so a rental often shows a tax loss while cash-flowing — sheltering income. Rental losses are passive: they offset passive income freely, and up to $25,000/yr can offset ordinary (W-2) income if you actively participate and your MAGI is under $100k (phasing out to $0 by $150k); unused losses carry forward. On sale, claimed depreciation is recaptured at up to 25%, and gains may owe capital-gains tax (a 1031 exchange can defer both). Figures are a year-1 estimate at your 24.0% rate — not tax advice; consult a CPA.
Schools (NCES district)
- District
- Guilford County Schools
- NCES district ID
- 3701920
- Math proficiency
- 39% ▲ 1.00%
- Reading proficiency
- 45% ▲ 1.00%
- Median HH income
- $46,315
- Composite
- 35.78/100
- National rank
- #4842
- State rank
- #99 of 178 in NC
Livability — Greensboro
- Score
- 81/100
- State rank
- #12
- US rank
- #1335
Category grades
Schools grade is shown separately in the Schools card above.
Census & demographics
- Census place
- Greensboro, NC
- County
- Guilford County · 487,190 people
- City population
- 329,421
- Metro
- Greensboro-High Point, NC
- Population (ZIP)
- 21,920
- Household income
- $47,972
- Rent vs Own
- Severe rent burden
- 1138.0
Population outlook (Guilford County) Hauer SSP2
- Today (2025)
- 584,596 people
- By 2030
- 616,851 · +5.5%
- By 2040
- 678,451 · +16.1%
- By 2050
- 734,788 · +25.7%
- By 2075
- 862,985 · +47.6%
- By 2100
- 948,704 · +62.3%
Race, ethnicity, and origin ACS 2023
- Neighborhood character
- Majority Black (62%)
- Race & ethnicity
- Black 62% White 26% Hispanic / Latino 8% Two or more races 4% Asian 1%
- Hispanic origin (detail)
- Mexican 4%
- Common ancestry
- Italian 1% Serbian 1% Slovak 1%
- Foreign-born
- 9% · Canada
- Languages at home
- 88% English-only · Spanish 6% Arabic 2% French/Haitian/Cajun 1%
Political lean MEDSL · Guilford
- 2024 margin
- Strong D (+21.8) · D 60.2% · R 38.4% · Other 1.4%
- 2008→2024 swing
- +3.5pp toward D · 2008: 18.4pp · 2024: 21.8pp
- All cycles
- 2024: D+21.8 2020: D+23.1 2016: D+20.0 2012: D+16.5 2008: D+18.4
Not yet ingested
- Civics
- —
Market trends
- HPI YoY
- ▼ -97.87%
- Current HPI
- 240.5377
- Rent YoY
- ▲ 1.78%
- Metro
- Greensboro-High Point, NC
- State GDP YoY
- ▲ 3.28%
- F500 in state
- 26
Industry mix (Fortune 500 HQ in NC)
| Industry | F500 HQs | Revenue |
|---|---|---|
| Financial Services | 2 | $213B |
|
||
| Retail | 2 | $95B |
|
||
| Industrial Conglomerate | 1 | $38B |
|
||
| Metals / Steel | 1 | $35B |
|
||
| Utilities | 1 | $30B |
|
||
| Industrial Machinery | 1 | $19B |
|
||
Price history
+475.0% since first listed7 events — show timeline
- 2026-06-05 Listed $115,000 Triad MLS
- 2026-02-26 Sold (Public Records) $85,000 Public Records
- 2026-02-25 Sold (MLS) $85,000 Triad MLS
- 2026-02-10 Pending — Triad MLS
- 2026-01-20 Contingent — Triad MLS
- 2026-01-17 Listed $99,900 Triad MLS
- 1998-05-13 Sold (Public Records) $20,000 Public Records
Property tax history
+1.6%/yrLatest (2025): $457 · -1.0% YoY. Source: county tax records.
Cash-flow waterfall
monthlySold comps — $/sqft
last 12 mo · ≤1 miLoading sold comps…