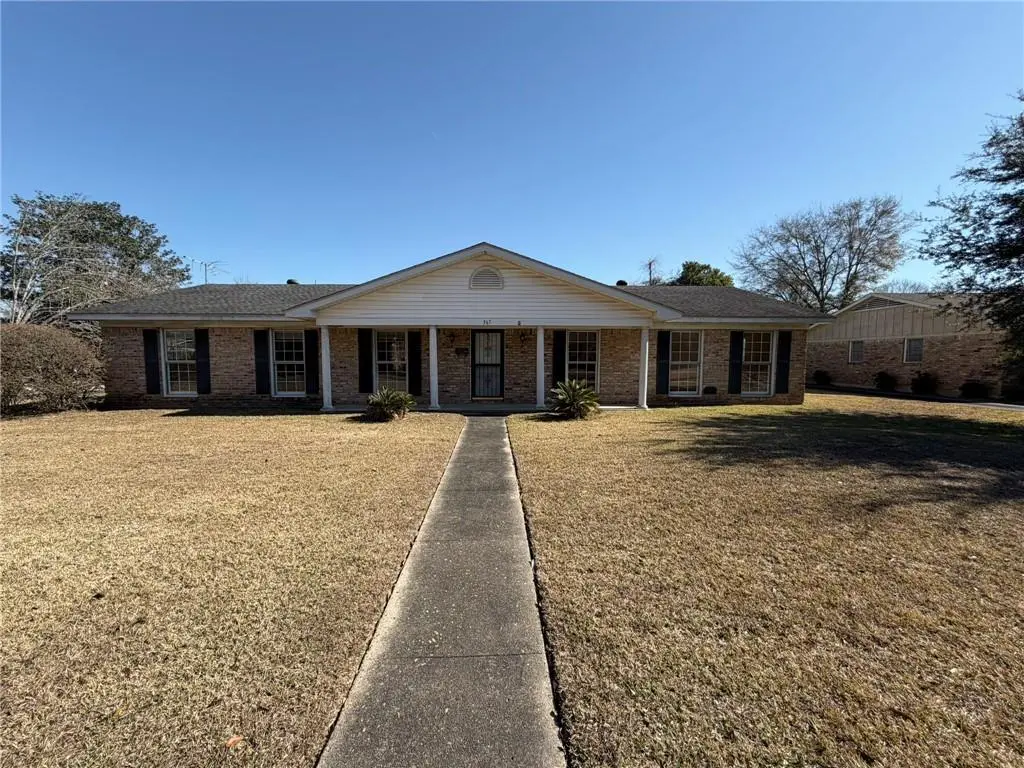
367 Sage Ave S · Mobile, AL
Flood risk 1/10 · Minimal
- FEMA flood zone
- X (unshaded)
- Chance of flooding over 30 yrs
- 0.0%
- Est. flood insurance / yr
- $507 – $1,088
Fire risk 1/10 · Minimal
- Est. fire insurance / yr
- $916 – $1,700
Heat risk 10/10 · Severe
- Hot days now (above 105°F)
- 7 days/yr
- Hot days in 30 yrs
- 21 days/yr
Wind risk 9/10 · Severe
- Chance of severe wind over 30 yrs
- 99.0%
Air-quality risk 2/10 · Minimal
- Unhealthy air days now
- 1 days/yr
- Unhealthy air days in 30 yrs
- 1 days/yr
Risk factors via First Street. Map © Google.
Why this score? — see what drove the C grade
The composite is a weighted blend of 9 inputs, each scored 0–100. Each bar is that input's sub-score; the figure is the points it added to the 100-point composite (weight × sub-score).
- Cash flow +20.9/30.0
- ARV discount +15.0/15.0
- DSCR +6.7/10.0
- 1% rule +4.5/10.0
- Rent growth +3.8/5.0
- Livability +3.8/5.0
- Condition / age +2.5/5.0
- Schools +2.3/10.0
- Appreciation +0.0/10.0
$190,000
🖨 Deal sheet 📄 Offer letter ✓ Due diligence
Listing remarks MLS
Welcome to 367 South Sage Ave. This house sits on a corner lot close to everything. Schools, Shopping, Mall's and Interstate. Large laundry room, Formal Dining and Living Room and a good sized Den. Bedrooms are spacious. Covered parking in the rear with a porch on the front and back. Please call your favorite Realtor today for a personal tour. May be subject to the Alabama One Year Right of Redemption.
Key facts
- Porch on the front
- Formal dining
- Covered parking
Tags
Neighborhood map
What this means for you Summary
Snapshot
- This is a 3-bed/2.0-bath single-family listed at $190k.
Deal economics
- At list price, monthly cash flow is $265 ($3k/yr) — positive.
- The deal already cash-flows at list — no discount required.
- To meet the 1% rule (rent ≥ 1% of price), the offer needs to be $180k (5.2% below list).
- Recommended offer: $167k (12.0% below list) — sets the bar for market timing.
- Cap rate 8.0% vs local median 4.9% in Mobile — top-decile yield for the area; either an underpriced asset or a hidden risk that comps aren't pricing in. Stress-test before assuming the spread holds.
Location & tenants
- Location reads 75/100 on livability (#20 in AL, #4,262 nationally) — a middle-class / working-renter tenant base. Strengths: commute A+, cost of living A+, housing A+; Watch: schools D-, crime F, employment D-.
- Mobile County (urban): math 15% / reading 39% proficiency, ranked #81 of 129 in AL (top 63%) — low school quality limits family demand, transient renter base, plan for 1-2y turnover; 67% free/reduced lunch — lower-income household profile, screen leases tightly.
- Market conditions: Rents rising fast (+5.1%/yr); 174 active listings in the ZIP; 11 comparable units currently listed for rent nearby; rentals at typical pace (median 21d on market — plan ~3-4 weeks tenant-placement turnaround); 1,678 units permitted in Mobile County in 2024 (264 in 5+ unit buildings).
- This rent runs 42% of the median local income ($51k/yr) — at the standard rent-burdened threshold; future hikes will face affordability resistance.
Forward outlook
- Local home prices are declining (-3.0%/yr); year-one equity from $1k of loan paydown is wiped out by about $6k of value loss. Plan a longer hold.
- Mobile County population projected to shrink 8% by 2050 — rents likely to lag national; underwrite the cash flow, not the appreciation.
Negotiation context
- It's been on market 126 days — a 12% lower offer ($167k) is reasonable based on typical stale-listing flexibility.
- Current owner paid $140k; 36% above their basis — modest negotiation headroom, anchor on the comps not their cost.
Risks & watch-outs
- Climate carrying-cost: severe wind risk, 99% chance of damaging wind over 30y; extreme-heat days projected 7→21/yr by 2055 (HVAC capex compounding) — expect insurance premiums to compound above CPI over the hold.
Questions for the listing agent
- It's been on market 126 days. Have you received any prior offers? Is the seller open to a 12% concession, seller financing, or rate buy-down credit?
- Built in 1964 — when were the roof, HVAC, electrical panel, plumbing, and water heater last replaced?
- Why hasn't it sold? Are there any deal-killer items the seller is aware of (foundation, flood, title, zoning, code violations)?
- Is there a deadline driving the sale (1031 exchange, divorce, estate, relocation)? That informs how much negotiation room exists.
- Schools are D-rated, which usually means shorter tenancies and higher turnover. Who's the typical renter profile here, and what's been the actual vacancy rate?
- Crime grade is F in this area — have there been break-ins, vandalism, or insurance claims at this property in the last 3 years? What carrier currently insures it and at what premium?
- What's the average days-on-market for RENTAL listings here right now (not sales)? A rising rental-DOM trend means longer vacancies and softer asking-rent achievability than the comps imply.
- What's the recent tenant-quality profile in this submarket — average credit score on applications, eviction rate, late-payment / NSF rate, and stable-employment percentage? A property-management company in the area should have these aggregated.
- How much new for-sale + rental construction is in the pipeline within 1–3 miles? Heavy new supply typically softens prices + rents 12–24 months out; constrained supply supports both.
Investment metrics
- 1% rule
- 0.95% ✗
- Cap rate
- 7.97%
- Cash-on-cash
- 5.99%
- DSCR
- 1.27
- GRM
- 8.8
CMA / ARV
- ARV (median comp)
- $251,087
- List price
- $190,000
- Delta
- -24.33%
- Verdict
- UNDERPRICED
- Comps
- 20 within 1.0 mi
Show comp detail 12 sales within ~0.75 mi
| Address | Dist | Beds/Ba | Sqft | Sold | Price | $/sf | Match |
|---|---|---|---|---|---|---|---|
| 504 Barksdale Dr W | 0.29mi | 4/2.5 (+1) | 2,000 (-5%) | 0mo | $280,000 | $140 | 70 |
| 320 Hadrian St | 0.34mi | 4/3.0 (+1) | 2,139 (+1%) | 5mo | $215,000 | $101 | 69 |
| 919 Grant Park Dr | 0.23mi | 3/2.0 | 1,846 (-13%) | 6mo | $290,000 | $157 | 64 |
| 2761 Barksdale Dr N | 0.39mi | 4/2.0 (+1) | 2,154 (+2%) | 12mo | $270,500 | $126 | 63 |
| 420 Pennington Cir | 0.22mi | 4/2.5 (+1) | 2,261 (+7%) | 11mo | $255,000 | $113 | 62 |
| 255 Berkley Ct | 0.41mi | 3/2.0 | 2,352 (+11%) | 1mo | $268,000 | $114 | 61 |
| 2762 Marcelus Dr | 0.45mi | 3/2.0 | 1,846 (-13%) | 5mo | $225,000 | $122 | 54 |
| 931 Grant Park Dr | 0.21mi | 3/2.0 | 1,812 (-14%) | 16mo | $311,500 | $172 | 53 |
| 2615 Walton Ave | 0.67mi | 4/2.5 (+1) | 2,172 (+3%) | 7mo | $265,000 | $122 | 51 |
| 2754 Brierwood Dr | 0.66mi | 3/2.0 | 1,866 (-12%) | 1mo | $252,000 | $135 | 49 |
| 2774 N Grafhill Dr | 0.60mi | 3/2.5 | 1,918 (-9%) | 9mo | $248,000 | $129 | 47 |
| 274 Walton Ave W | 0.64mi | 4/2.0 (+1) | 1,900 (-10%) | 9mo | $210,000 | $111 | 40 |
Match score weights: distance 35% · size 25% · config 20% · recency 20%. Top-matched comps best support the ARV.
Projected returns pro-forma
-3.0% appreciation · 5.06% rent growth · sell at horizon
- IRR
- -5.0%
- Equity multiple
- 0.81×
- Total profit
- $-10,144
- Equity at exit
- $28,330
- IRR
- 6.7%
- Equity multiple
- 1.54×
- Total profit
- $28,964
- Equity at exit
- $16,428
Cash invested: $53,200 (down + closing). Projections, not guarantees.
Landlord ↔ Tenant lean methodology
- Overall (STATE)
- 90 Strongly Landlord-Friendly
- State Alabama
- 90 Strongly Landlord-Friendly · R+15
- County
- — inherits STATE
- City
- — inherits STATE
ZIP-level market 36606
- Rents YoY
- 5.1%
- Active inventory
- 174
- Price-to-rent
- 8.8×
Monthly cashflow live
- Estimated rent
- $1,802 high interval (Pro) →
- Mortgage (P&I)
- −$996
- Tax from tax record
- −$82 /mo · $990/yr
- Insurance
- −$79
- HOA
- −$0
- Vacancy / Maint / Mgmt
- −$378
- Net cashflow
- $265
Break-even live
UW: 25.0% down · 7.5% · 30yr · 1.5% tax · 5.0% vac · 8.0% maint · 8.0% mgmt
Financing live
Cash to close
- Down payment
- $47,500
- Closing costs
- $5,700
- Reserves months
- —
- Total cash needed
- —
Loan-product check · same deal, 3 products live
Conventional
25% down · 7.5% · 30yr
- Down + closing
- —
- Monthly P&I
- —
- Monthly cashflow
- —
- DSCR
- —
- Eligible?
- —
Personal DTI + credit; lowest rate.
DSCR
20% down · 8.5% · 30yr
- Down + closing
- —
- Monthly P&I
- —
- Monthly cashflow
- —
- DSCR
- —
- Eligible?
- —
No personal income docs; deal must DSCR.
Hard money
10% down · 12.0% · 12mo
- Down + closing
- —
- Monthly P&I
- —
- Monthly cashflow
- —
- DSCR
- —
- Eligible?
- —
Short-term bridge; refi at stabilization.
Rent comps 11 comps
| Address | Beds | Baths | Sqft | Rent | $/sqft | DOM | Units | Dist |
|---|---|---|---|---|---|---|---|---|
| 315 Hadrian St Mobile, AL | 3.0 | 2.0 | 1843 | $1,800 | $0.98 | 43d | 1 | 0.32mi |
| 418 Durande Dr Mobile, AL | 3.0 | 2.0 | 1456 | $1,350 | $0.93 | 13d | 1 | 0.50mi |
| 2861 Ralston Rd Mobile, AL | 3.0 | 2.0 | 1617 | $1,650 | $1.02 | 43d | 1 | 0.57mi |
| 2861 Potter Dr Unit 1043844P Mobile, AL | 3.0 | 2.0 | 1496 | $2,492 | $1.67 | 21d | 1 | 0.63mi |
| 2863 Potter Dr Unit 1043693P Mobile, AL | 4.0 | 2.0 | 1496 | $3,049 | $2.04 | 13d | 1 | 0.63mi |
| 150 Dunn Ave Mobile, AL | 3.0 | 2.0 | 1455 | $1,250 | $0.86 | 21d | 1 | 0.79mi |
| 713 Iris Ave Mobile, AL | 3.0 | 1.0 | 1617 | $1,300 | $0.80 | 21d | 1 | 0.93mi |
| 412 Pinehill Dr Mobile, AL | 2.0 | 2.0 | 2000 | $2,450 | $1.23 | 13d | 1 | 0.99mi |
| 3661 Airport Blvd Mobile, AL | 1.0–3.0 | 1.0–2.5 | 1187 | $1,621 | $1.37 | 13d | 24 | 1.03mi |
| 618 Clarke St Mobile, AL | 3.0 | 1.0 | 1427 | $1,200 | $0.84 | 43d | 1 | 1.27mi |
| 146 Yester Oaks Dr Mobile, AL | 1.0–3.0 | 1.0–2.5 | 1203 | $1,596 | $1.33 | 13d | 12 | 1.40mi |
Listing history 14 events
-
2026-06-09status $190,000 Pending 126 DOM
-
2026-06-08days on market $190,000 Active 126 DOM
-
2026-06-07days on market $190,000 Active 125 DOM
-
2026-06-05days on market $190,000 Active 122 DOM
-
2026-06-03days on market $190,000 Active 121 DOM
-
2026-06-02days on market $190,000 Active 120 DOM
-
2026-06-01days on market $190,000 Active 119 DOM
-
2026-05-31days on market $190,000 Active 118 DOM
-
2026-05-30days on market $190,000 Active 117 DOM
-
2026-05-08price $190,000 412-char remark
Show marketing remark (412 chars)
Welcome to 367 South Sage Ave. This house sits on a corner lot close to everything. Schools, Shopping, Mall's and Interstate. Large laundry room, Formal Dining and Living Room and a good sized Den. Bedrooms are spacious. Covered parking in the rear with a porch on the front and back. Please call your favorite Realtor today for a personal tour. May be subject to the Alabama One Year Right of Redemption.
-
2026-04-06price $200,000 412-char remark
Show marketing remark (412 chars)
Welcome to 367 South Sage Ave. This house sits on a corner lot close to everything. Schools, Shopping, Mall's and Interstate. Large laundry room, Formal Dining and Living Room and a good sized Den. Bedrooms are spacious. Covered parking in the rear with a porch on the front and back. Please call your favorite Realtor today for a personal tour. May be subject to the Alabama One Year Right of Redemption.
-
2026-02-27price $210,000 412-char remark
Show marketing remark (412 chars)
Welcome to 367 South Sage Ave. This house sits on a corner lot close to everything. Schools, Shopping, Mall's and Interstate. Large laundry room, Formal Dining and Living Room and a good sized Den. Bedrooms are spacious. Covered parking in the rear with a porch on the front and back. Please call your favorite Realtor today for a personal tour. May be subject to the Alabama One Year Right of Redemption.
-
2026-02-02$230,000 Active 412-char remark
Show marketing remark (412 chars)
Welcome to 367 South Sage Ave. This house sits on a corner lot close to everything. Schools, Shopping, Mall's and Interstate. Large laundry room, Formal Dining and Living Room and a good sized Den. Bedrooms are spacious. Covered parking in the rear with a porch on the front and back. Please call your favorite Realtor today for a personal tour. May be subject to the Alabama One Year Right of Redemption.
-
2018-06-20soldstatus $140,203
ⓘ Source: listings_history table (triggers on properties + properties_extension) + one-shot
backfill from property_details.listing_events for pre-trigger history.
Tax reassessment forecast AL · Resets to sale price
- Current annual tax
- $990 · $82/mo
- Projected year-2 tax
- $990 · $82/mo
- Expected delta
- $0/yr ($0/mo · 0.0%)
ⓘ Screening estimate from a state-policy table — verify with the county assessor before closing.
Climate risk First Street
- Flood 1/10 Low FEMA zone X (unshaded) · 0% chance over 30 yrs
- Wildfire 1/10 Low
- Heat 10/10 Extreme 7 d/yr ≥105°F today · 21 d/yr by 30 yrs out
- Wind 9/10 Extreme 99% chance of damaging wind over 30 yrs
- Air quality 2/10 Low 1 unhealthy d/yr today · 1 by 30 yrs out
Nearby sold comps map
Loading sold comps map…
Walkable amenities ~0.75 mi
Loading nearby amenities…
Taxation est. · year 1
- Rental income
- $21,621
- − Mortgage interest
- −$10,643
- − Property taxes
- −$990
- − Insurance
- −$950
- − Repairs & maintenance
- −$1,730
- − Management
- −$1,730
- − Depreciation
- −$5,527
- Taxable income
- $52
- Est. tax owed @ 24.0%
- −$12
- After-tax cash flow
- $3,172/yr
For passive investors: Depreciation is non-cash, so a rental often shows a tax loss while cash-flowing — sheltering income. Rental losses are passive: they offset passive income freely, and up to $25,000/yr can offset ordinary (W-2) income if you actively participate and your MAGI is under $100k (phasing out to $0 by $150k); unused losses carry forward. On sale, claimed depreciation is recaptured at up to 25%, and gains may owe capital-gains tax (a 1031 exchange can defer both). Figures are a year-1 estimate at your 24.0% rate — not tax advice; consult a CPA.
Schools (NCES district)
- District
- Mobile County
- NCES district ID
- 0102370
- Math proficiency
- 15% ▼ -28.00%
- Reading proficiency
- 39% ▬ 0.00%
- Median HH income
- $42,455
- Composite
- 22.9/100
- National rank
- #8002
- State rank
- #81 of 129 in AL
Livability — Mobile
- Score
- 75/100
- State rank
- #20
- US rank
- #4262
Category grades
Schools grade is shown separately in the Schools card above.
Census & demographics
- Census place
- Mobile, AL
- County
- Mobile County · 246,577 people
- City population
- 205,729
- Metro
- Mobile, AL
- Population (ZIP)
- 18,728
- Household income
- $51,303
- Rent vs Own
- Severe rent burden
- 999.0
Population outlook (Mobile County) Hauer SSP2
- Today (2025)
- 415,303 people
- By 2030
- 411,755 · -0.9%
- By 2040
- 399,670 · -3.8%
- By 2050
- 382,616 · -7.9%
- By 2075
- 337,353 · -18.8%
- By 2100
- 283,391 · -31.8%
Race, ethnicity, and origin ACS 2023
- Neighborhood character
- Majority Black (56%)
- Race & ethnicity
- Black 56% White 37% Two or more races 5% Hispanic / Latino 4%
- Common ancestry
- Italian 2% Scottish 2% Lithuanian 1%
- Foreign-born
- 3% · Canada
- Languages at home
- 96% English-only · Spanish 3%
Political lean MEDSL · Mobile
- 2024 margin
- R (+16.4) · D 41.3% · R 57.7%
- 2008→2024 swing
- -7.7pp toward R · 2008: -8.7pp · 2024: -16.4pp
- All cycles
- 2024: R+16.4 2020: R+11.9 2016: R+13.9 2012: R+9.3 2008: R+8.7
Not yet ingested
- Civics
- —
Market trends
- HPI YoY
- ▼ -232.19%
- Current HPI
- 145.9025
- Rent YoY
- ▲ 5.06%
- Metro
- Mobile, AL
- State GDP YoY
- ▲ 2.94%
- F500 in state
- 4
Industry mix (Fortune 500 HQ in AL)
| Industry | F500 HQs | Revenue |
|---|---|---|
| Financial Services | 1 | $8B |
|
||
| Healthcare | 1 | $5B |
|
||
Price history
+35.5% since first listed5 events — show timeline
- 2026-05-08 Price Changed $190,000 GCMLS AL
- 2026-04-06 Price Changed $200,000 GCMLS AL
- 2026-02-27 Price Changed $210,000 GCMLS AL
- 2026-02-02 Listed $230,000 GCMLS AL
- 2018-06-20 Sold (Public Records) $140,203 Public Records
Property tax history
-6.8%/yrLatest (2025): $990 · +6.0% YoY. Source: county tax records.
Cash-flow waterfall
monthlySold comps — $/sqft
last 12 mo · ≤1 miLoading sold comps…