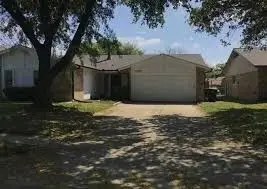
7209 W Cleburne Rd · Fort Worth, TX
Flood risk 1/10 · Minimal
- FEMA flood zone
- X (unshaded)
- Chance of flooding over 30 yrs
- 0.0%
- Est. flood insurance / yr
- $507 – $1,088
Fire risk 1/10 · Minimal
- Est. fire insurance / yr
- $1,222 – $2,270
Heat risk 7/10 · Major
- Hot days now (above 108°F)
- 7 days/yr
- Hot days in 30 yrs
- 23 days/yr
Wind risk 4/10 · Minor
- Chance of severe wind over 30 yrs
- 24.0%
Air-quality risk 3/10 · Minor
- Unhealthy air days now
- 2 days/yr
- Unhealthy air days in 30 yrs
- 3 days/yr
Risk factors via First Street. Map © Google.
Why this score? — see what drove the C- grade
The composite is a weighted blend of 9 inputs, each scored 0–100. Each bar is that input's sub-score; the figure is the points it added to the 100-point composite (weight × sub-score).
- Cash flow +15.3/30.0
- ARV discount +15.0/15.0
- 1% rule +6.6/10.0
- DSCR +4.7/10.0
- Livability +4.0/5.0
- Rent growth +2.5/5.0
- Condition / age +2.5/5.0
- Schools +2.0/10.0
- Appreciation +0.0/10.0
$188,480
🖨 Deal sheet 📄 Offer letter ✓ Due diligence
Listing remarks MLS
This property offers 4 bedrooms and 2 full bathrooms
Key facts
- 9,491 sq ft lot
- 2 garage spots
- Built 1979
Neighborhood map
What this means for you Summary
Snapshot
- This is a 4-bed/2.0-bath single-family listed at $188k.
Deal economics
- At list price, monthly cash flow is $69 ($830/yr) — positive.
- The deal already cash-flows at list — no discount required.
- Meets the 1% rule at list price ($2k rent vs $188k).
- Recommended offer: $177k (6.0% below list) — sets the bar for market timing.
- Cap rate 6.7% vs local median 3.9% in Fort Worth — top-decile yield for the area; either an underpriced asset or a hidden risk that comps aren't pricing in. Stress-test before assuming the spread holds.
Location & tenants
- Location reads 80/100 on livability (#49 in TX, #1,954 nationally) — a professional / high-income tenant draw. Strengths: amenities A+, cost of living A+, housing A+; Watch: schools D+, crime F.
- Fort Worth ISD (urban): math 18% / reading 28% proficiency, ranked #742 of 826 in TX (top 90%) — low school quality limits family demand, transient renter base, plan for 1-2y turnover; 73% free/reduced lunch — lower-income household profile, screen leases tightly.
- Market conditions: Rents soft (-0.2%/yr); 205 active listings in the ZIP; 40 comparable units currently listed for rent nearby; rentals at typical pace (median 15d on market — plan ~3-4 weeks tenant-placement turnaround); solid renter incomes; 18,938 units permitted in Tarrant County in 2024 (8,336 in 5+ unit buildings).
- This rent runs 35% of the median local income ($76k/yr) — at the standard rent-burdened threshold; future hikes will face affordability resistance.
Forward outlook
- Local home prices are declining (-3.0%/yr); year-one equity from $1k of loan paydown is wiped out by about $6k of value loss. Plan a longer hold.
- Tarrant County population projected at +41% by 2050 — long-run rental-demand tailwind backs the buy-and-hold thesis.
Negotiation context
- It's been on market 63 days — a 6% lower offer ($177k) is reasonable based on typical stale-listing flexibility.
- 4 sale attempts since 2y ago with the ask held roughly flat each time — persistent listings suggest the price (not the market) is what's stuck; bring a comps-based counter.
Risks & watch-outs
- Watch-outs: property tax is 3.8% of price.
- Climate carrying-cost: extreme-heat days projected 7→23/yr by 2055 (HVAC capex compounding) — expect insurance premiums to compound above CPI over the hold.
Questions for the listing agent
- It's been on market 63 days. Have you received any prior offers? Is the seller open to a 6% concession, seller financing, or rate buy-down credit?
- Built in 1979 — when were the roof, HVAC, electrical panel, plumbing, and water heater last replaced?
- Property tax is high relative to price — has the assessment been appealed recently, and will the sale trigger a re-assessment?
- Why hasn't it sold? Are there any deal-killer items the seller is aware of (foundation, flood, title, zoning, code violations)?
- Is there a deadline driving the sale (1031 exchange, divorce, estate, relocation)? That informs how much negotiation room exists.
- Schools are D-rated, which usually means shorter tenancies and higher turnover. Who's the typical renter profile here, and what's been the actual vacancy rate?
- Crime grade is F in this area — have there been break-ins, vandalism, or insurance claims at this property in the last 3 years? What carrier currently insures it and at what premium?
- What's the average days-on-market for RENTAL listings here right now (not sales)? A rising rental-DOM trend means longer vacancies and softer asking-rent achievability than the comps imply.
- What's the recent tenant-quality profile in this submarket — average credit score on applications, eviction rate, late-payment / NSF rate, and stable-employment percentage? A property-management company in the area should have these aggregated.
- How much new for-sale + rental construction is in the pipeline within 1–3 miles? Heavy new supply typically softens prices + rents 12–24 months out; constrained supply supports both.
Investment metrics
- 1% rule
- 1.16% ✓
- Cap rate
- 6.73%
- Cash-on-cash
- 1.57%
- DSCR
- 1.07
- GRM
- 7.2
CMA / ARV
- ARV (median comp)
- $260,606
- List price
- $188,480
- Delta
- -27.68%
- Verdict
- UNDERPRICED
- Comps
- 20 within 1.0 mi
Show comp detail 12 sales within ~0.75 mi
| Address | Dist | Beds/Ba | Sqft | Sold | Price | $/sf | Match |
|---|---|---|---|---|---|---|---|
| 4104 Misty Meadow Dr | 0.31mi | 3/2.0 (-1) | 2,162 (+2%) | 1mo | $385,000 | $178 | 75 |
| 3913 Willow Way Rd | 0.31mi | 3/2.5 (-1) | 2,255 (+7%) | 2mo | $350,000 | $155 | 65 |
| 3950 Cypress Wood Ct | 0.29mi | 4/2.0 | 1,830 (-13%) | 2mo | $189,900 | $104 | 62 |
| 7720 Four Winds Dr | 0.52mi | 4/2.5 | 2,239 (+6%) | 3mo | $270,000 | $121 | 61 |
| 4225 Capilla St | 0.53mi | 3/2.0 (-1) | 2,216 (+5%) | 4mo | $359,500 | $162 | 58 |
| 6809 Welch Ave | 0.59mi | 3/2.0 (-1) | 2,000 (-5%) | 2mo | $399,000 | $200 | 57 |
| 3817 Misty Meadow Dr | 0.39mi | 4/2.0 | 1,795 (-15%) | 2mo | $299,800 | $167 | 55 |
| 7701 Landmark Ridge St | 0.74mi | 4/2.5 | 2,206 (+4%) | 2mo | $215,000 | $97 | 55 |
| 4021 Aragon Dr | 0.64mi | 4/2.5 | 2,270 (+8%) | 2mo | $349,000 | $154 | 54 |
| 6616 Armando Ave | 0.62mi | 4/3.0 | 1,907 (-10%) | 1mo | $265,000 | $139 | 51 |
| 6709 Santiago Ave | 0.56mi | 4/2.0 | 2,380 (+13%) | 3mo | $373,999 | $157 | 50 |
| 4020 Aragon Dr | 0.65mi | 3/2.5 (-1) | 1,940 (-8%) | 2mo | $340,000 | $175 | 48 |
Match score weights: distance 35% · size 25% · config 20% · recency 20%. Top-matched comps best support the ARV.
Projected returns pro-forma
-3.0% appreciation · 0.0% rent growth · sell at horizon
- IRR
- -18.0%
- Equity multiple
- 0.39×
- Total profit
- $-32,289
- Equity at exit
- $28,103
- IRR
- -20.0%
- Equity multiple
- 0.13×
- Total profit
- $-46,176
- Equity at exit
- $16,296
Cash invested: $52,774 (down + closing). Projections, not guarantees.
Landlord ↔ Tenant lean methodology
- Overall (STATE)
- 87 Strongly Landlord-Friendly
- State Texas
- 87 Strongly Landlord-Friendly · R+5
- County
- — inherits STATE
- City
- — inherits STATE
ZIP-level market 76133
- Rents YoY
- -0.2%
- Active inventory
- 205
- Price-to-rent
- 7.2×
Monthly cashflow live
- Estimated rent
- $2,186 high interval (Pro) →
- Mortgage (P&I)
- −$988
- Tax from tax record
- −$591 /mo · $7,088/yr
- Insurance
- −$79
- HOA
- −$0
- Vacancy / Maint / Mgmt
- −$459
- Net cashflow
- $69
Break-even live
UW: 25.0% down · 7.5% · 30yr · 1.5% tax · 5.0% vac · 8.0% maint · 8.0% mgmt
Financing live
Cash to close
- Down payment
- $47,120
- Closing costs
- $5,654
- Reserves months
- —
- Total cash needed
- —
Loan-product check · same deal, 3 products live
Conventional
25% down · 7.5% · 30yr
- Down + closing
- —
- Monthly P&I
- —
- Monthly cashflow
- —
- DSCR
- —
- Eligible?
- —
Personal DTI + credit; lowest rate.
DSCR
20% down · 8.5% · 30yr
- Down + closing
- —
- Monthly P&I
- —
- Monthly cashflow
- —
- DSCR
- —
- Eligible?
- —
No personal income docs; deal must DSCR.
Hard money
10% down · 12.0% · 12mo
- Down + closing
- —
- Monthly P&I
- —
- Monthly cashflow
- —
- DSCR
- —
- Eligible?
- —
Short-term bridge; refi at stabilization.
Rent comps 40 comps
| Address | Beds | Baths | Sqft | Rent | $/sqft | DOM | Units | Dist |
|---|---|---|---|---|---|---|---|---|
| 7221 W Cleburne Rd Fort Worth, TX | 3.0 | 2.0 | 1623 | $1,795 | $1.11 | 24d | 1 | 0.04mi |
| 3921 Teaberry Ln Fort Worth, TX | 4.0 | 2.0 | 1548 | $2,200 | $1.42 | 2d | 1 | 0.09mi |
| 7294 Church Park Dr Fort Worth, TX | 3.0 | 2.0 | 1618 | $2,000 | $1.24 | 24d | 1 | 0.09mi |
| 7148 Misty Meadow Dr S Fort Worth, TX | 3.0 | 2.0 | 1480 | $1,795 | $1.21 | 2d | 1 | 0.14mi |
| 7221 Misty Meadow Dr S Fort Worth, TX | 3.0 | 2.0 | 1584 | $1,795 | $1.13 | 4d | 1 | 0.15mi |
| 7329 Southridge Trl Fort Worth, TX | 3.0 | 2.0 | 1529 | $2,200 | $1.44 | 43d | 1 | 0.22mi |
| 3965 Singleleaf Ln Fort Worth, TX | 3.0 | 2.0 | 2343 | $2,500 | $1.07 | 6d | 1 | 0.22mi |
| 7208 Southridge Trl Fort Worth, TX | 3.0 | 2.0 | 1506 | $1,950 | $1.29 | 1d | 1 | 0.23mi |
| 6920 Misty Meadow Dr S Fort Worth, TX | 3.0 | 2.0 | 1443 | $1,775 | $1.23 | 43d | 1 | 0.37mi |
| 3905 Seven Gables St Fort Worth, TX | 3.0 | 2.0 | 1864 | $1,700 | $0.91 | 43d | 1 | 0.47mi |
| 7609 Xavier Dr Fort Worth, TX | 4.0 | 2.5 | 2239 | $2,060 | $0.92 | 21d | 1 | 0.50mi |
| 3416 Forest Creek Dr Fort Worth, TX | 3.0 | 2.0 | 1400 | $1,895 | $1.35 | 24d | 1 | 0.67mi |
| 4032 Aragon Dr Fort Worth, TX | 4.0 | 2.0 | 2093 | $3,400 | $1.62 | 1d | 1 | 0.67mi |
| 3308 Clovermeadow Dr Fort Worth, TX | 3.0 | 2.0 | 1798 | $1,900 | $1.06 | 24d | 1 | 0.68mi |
| 3809 Bee Tree Ln Fort Worth, TX | 3.0 | 2.0 | 1458 | $1,855 | $1.27 | 15d | 1 | 0.69mi |
| 4217 Longmeadow Way Fort Worth, TX | 3.0 | 2.0 | 1502 | $1,890 | $1.26 | 43d | 1 | 0.75mi |
| 7801 Summerglen Rd Fort Worth, TX | 3.0 | 1.0 | 1715 | $2,045 | $1.19 | 43d | 1 | 0.79mi |
| 3104 Woodlark Dr Fort Worth, TX | 4.0 | 2.5 | 2565 | $2,350 | $0.92 | 43d | 1 | 0.81mi |
| 3309 Creekwood Ln Fort Worth, TX | 4.0 | 2.0 | 1748 | $2,060 | $1.18 | 1d | 1 | 0.83mi |
| 4127 Altamesa Blvd Unit NA Fort Worth, TX | 3.0 | 2.0 | 1645 | $1,850 | $1.12 | 24d | 1 | 0.83mi |
| 6824 Loma Vista Dr Fort Worth, TX | 3.0 | 2.0 | 1540 | $1,980 | $1.29 | 43d | 1 | 0.87mi |
| 2917 Joymeadow Dr Fort Worth, TX | 4.0 | 2.5 | 2253 | $2,210 | $0.98 | 20d | 1 | 0.87mi |
| 3816 Ashley Ln Fort Worth, TX | 3.0 | 2.0 | 1464 | $2,060 | $1.41 | 2d | 1 | 0.88mi |
| 3704 Fairhaven Dr Fort Worth, TX | 3.0 | 2.0 | 1528 | $1,995 | $1.31 | 12d | 1 | 0.90mi |
| 3704 Fairhaven Dr Fort Worth, TX | 3.0 | 2.0 | 1528 | $1,995 | $1.31 | 43d | 1 | 0.90mi |
| 4513 Foxfire Way Fort Worth, TX | 4.0 | 2.0 | 2436 | $9,750 | $4.00 | 43d | 1 | 0.90mi |
| 7421 Ridge Rd W Fort Worth, TX | 3.0 | 2.0 | 1480 | $1,839 | $1.24 | 2d | 1 | 0.90mi |
| 2905 Joymeadow Dr Fort Worth, TX | 4.0 | 2.5 | 2272 | $2,200 | $0.97 | 5d | 1 | 0.91mi |
| 7223 Fuller Cir Fort Worth, TX | 3.0 | 2.0 | 1451 | $1,900 | $1.31 | 14d | 1 | 0.94mi |
| 7501 Meadow Creek Dr Fort Worth, TX | 4.0 | 2.5 | 2167 | $2,295 | $1.06 | 5d | 1 | 0.97mi |
| 4401 Yellowleaf Dr Fort Worth, TX | 4.0 | 2.0 | 2170 | $2,350 | $1.08 | 43d | 1 | 0.97mi |
| 7504 Trotter Ct Fort Worth, TX | 3.0 | 2.5 | 2440 | $2,199 | $0.90 | 1d | 1 | 0.99mi |
| 6838 S Creek Dr Fort Worth, TX | 3.0 | 2.0 | 1400 | $1,395 | $1.00 | 2d | 1 | 0.99mi |
| 2729 Forest Creek Dr Fort Worth, TX | 3.0 | 2.5 | 2333 | $2,350 | $1.01 | 2d | 1 | 1.04mi |
| 7948 Mosspark Ln Fort Worth, TX | 4.0 | 2.0 | 1809 | $2,360 | $1.30 | 5d | 1 | 1.05mi |
| 7320 Laurelhill Ct S Fort Worth, TX | 3.0 | 2.0 | 1480 | $1,905 | $1.29 | 1d | 1 | 1.06mi |
| 4013 Winter Springs Dr Fort Worth, TX | 4.0 | 2.0 | 1764 | $3,000 | $1.70 | 43d | 1 | 1.07mi |
| 3288 Raleigh Dr Fort Worth, TX | 5.0 | 2.5 | 2443 | $2,395 | $0.98 | 19d | 1 | 1.08mi |
| 7713 Songbird Ln Fort Worth, TX | 3.0 | 2.0 | 1852 | $2,150 | $1.16 | 5d | 1 | 1.09mi |
| 2701 Clovermeadow Dr Fort Worth, TX | 4.0 | 2.5 | 2225 | $2,500 | $1.12 | 2d | 1 | 1.10mi |
Listing history 33 events
-
2026-06-18days on market $188,480 Active 63 DOM
-
2026-06-17days on market $188,480 Active 62 DOM
-
2026-06-16days on market $188,480 Active 61 DOM
-
2026-06-15days on market $188,480 Active 60 DOM
-
2026-06-13days on market $188,480 Active 58 DOM
-
2026-06-09days on market $188,480 Active 54 DOM
-
2026-06-08days on market $188,480 Active 53 DOM
-
2026-06-07days on market $188,480 Active 52 DOM
-
2026-06-04days on market $188,480 Active 49 DOM
-
2026-06-03days on market $188,480 Active 48 DOM
-
2026-06-02days on market $188,480 Active 47 DOM
-
2026-06-01days on market $188,480 Active 46 DOM
-
2026-05-31days on market $188,480 Active 45 DOM
-
2026-04-16$188,480 Active 52-char remark
Show marketing remark (52 chars)
This property offers 4 bedrooms and 2 full bathrooms
-
2025-10-28historical
-
2025-08-11price $300,000
-
2025-08-01price $302,000
-
2025-07-18price $302,500
-
2025-06-19price $303,000
-
2025-05-31price $307,000
-
2025-05-30$310,000 Active
-
2024-09-24soldstatus
-
2024-09-23soldstatus Closed
-
2024-09-04status Pending
-
2024-08-27historical Active Option Contract
-
2024-07-24$290,000 Active
-
2024-07-19historical
-
2024-07-15price $293,000
-
2024-05-24price $300,000
-
2024-05-06$315,000 Active
-
2002-05-14soldstatus
-
1997-01-03soldstatus
-
1982-06-01soldstatus
ⓘ Source: listings_history table (triggers on properties + properties_extension) + one-shot
backfill from property_details.listing_events for pre-trigger history.
Tax reassessment forecast TX · Resets to sale price
- Current annual tax
- $7,088 · $591/mo
- Projected year-2 tax
- $7,088 · $591/mo
- Expected delta
- $0/yr ($0/mo · 0.0%)
ⓘ Screening estimate from a state-policy table — verify with the county assessor before closing.
Climate risk First Street
- Flood 1/10 Low FEMA zone X (unshaded) · 0% chance over 30 yrs
- Wildfire 1/10 Low
- Heat 7/10 Severe 7 d/yr ≥108°F today · 23 d/yr by 30 yrs out
- Wind 4/10 Moderate 24% chance of damaging wind over 30 yrs
- Air quality 3/10 Moderate 2 unhealthy d/yr today · 3 by 30 yrs out
Nearby sold comps map
Loading sold comps map…
Walkable amenities ~0.75 mi
Loading nearby amenities…
Taxation est. · year 1
- Rental income
- $26,230
- − Mortgage interest
- −$10,558
- − Property taxes
- −$7,088
- − Insurance
- −$942
- − Repairs & maintenance
- −$2,098
- − Management
- −$2,098
- − Depreciation
- −$5,483
- Taxable loss
- −$2,038
- Est. tax savings @ 24.0%
- +$489
- After-tax cash flow
- $1,320/yr
For passive investors: Depreciation is non-cash, so a rental often shows a tax loss while cash-flowing — sheltering income. Rental losses are passive: they offset passive income freely, and up to $25,000/yr can offset ordinary (W-2) income if you actively participate and your MAGI is under $100k (phasing out to $0 by $150k); unused losses carry forward. On sale, claimed depreciation is recaptured at up to 25%, and gains may owe capital-gains tax (a 1031 exchange can defer both). Figures are a year-1 estimate at your 24.0% rate — not tax advice; consult a CPA.
Schools (NCES district)
- District
- Fort Worth ISD
- NCES district ID
- 4819700
- Math proficiency
- 18% ▼ -16.00%
- Reading proficiency
- 28% ▼ -6.00%
- Median HH income
- $42,109
- Composite
- 19.61/100
- National rank
- #8753
- State rank
- #742 of 826 in TX
Livability — Fort Worth
- Score
- 80/100
- State rank
- #49
- US rank
- #1954
Category grades
Schools grade is shown separately in the Schools card above.
Census & demographics
- Census place
- Fort Worth, TX
- County
- Tarrant County · 2,033,669 people
- City population
- 911,619
- Metro
- Dallas-Fort Worth-Arlington, TX
- Population (ZIP)
- 53,958
- Household income
- $75,523
- Rent vs Own
- Severe rent burden
- 2000.0
Population outlook (Tarrant County) Hauer SSP2
- Today (2025)
- 2,380,417 people
- By 2030
- 2,578,900 · +8.3%
- By 2040
- 2,974,995 · +25.0%
- By 2050
- 3,350,489 · +40.8%
- By 2075
- 4,216,909 · +77.2%
- By 2100
- 4,741,527 · +99.2%
Race, ethnicity, and origin ACS 2023
- Neighborhood character
- Diverse neighborhood (Simpson 0.69)
- Race & ethnicity
- Hispanic / Latino 39% White 34% Black 21% Two or more races 19% Asian 3% Native American 1%
- Hispanic origin (detail)
- Mexican 34%
- Common ancestry
- Italian 3% Slovak 2% Lithuanian 1%
- Foreign-born
- 15% · Canada, China, Philippines
- Languages at home
- 70% English-only · Spanish 25% Other Asian/Pacific 1% French/Haitian/Cajun 1%
Political lean MEDSL · Tarrant
- 2024 margin
- Lean R (+5.1) · D 46.7% · R 51.9% · Other 1.4%
- 2008→2024 swing
- +6.6pp toward D · 2008: -11.7pp · 2024: -5.1pp
- All cycles
- 2024: R+5.1 2020: D+0.2 2016: R+8.7 2012: R+15.7 2008: R+11.7
Not yet ingested
- Civics
- —
Market trends
- HPI YoY
- ▼ -196.95%
- Current HPI
- 293.8679
- Rent YoY
- ▼ -0.20%
- Metro
- Dallas-Fort Worth-Arlington, TX
- State GDP YoY
- ▲ 3.95%
- F500 in state
- 110
Industry mix (Fortune 500 HQ in TX)
| Industry | F500 HQs | Revenue |
|---|---|---|
| Energy | 16 | $1,198B |
|
||
| Technology | 5 | $198B |
|
||
| Engineering / Construction | 4 | $72B |
|
||
| Energy Services | 3 | $60B |
|
||
| Utilities | 3 | $41B |
|
||
| Healthcare | 2 | $330B |
|
||
Price history
-40.2% since first listed20 events — show timeline
- 2026-04-16 Listed $188,480 HARMLS
- 2025-10-28 Listing Removed — NTREIS
- 2025-08-11 Price Changed $300,000 NTREIS
- 2025-08-01 Price Changed $302,000 NTREIS
- 2025-07-18 Price Changed $302,500 NTREIS
- 2025-06-19 Price Changed $303,000 NTREIS
- 2025-05-31 Price Changed $307,000 NTREIS
- 2025-05-30 Listed $310,000 NTREIS
- 2024-09-24 Sold (Public Records) — Public Records
- 2024-09-23 Sold (MLS) — NTREIS
- 2024-09-04 Pending — NTREIS
- 2024-08-27 Contingent — NTREIS
- 2024-07-24 Listed $290,000 NTREIS
- 2024-07-19 Listing Removed — NTREIS
- 2024-07-15 Price Changed $293,000 NTREIS
- 2024-05-24 Price Changed $300,000 NTREIS
- 2024-05-06 Listed $315,000 NTREIS
- 2002-05-14 Sold (Public Records) — Public Records
- 1997-01-03 Sold (Public Records) — Public Records
- 1982-06-01 Sold (Public Records) — Public Records
Property tax history
+5.7%/yrLatest (2025): $7,088 · +15.6% YoY. Source: county tax records.
Cash-flow waterfall
monthlySold comps — $/sqft
last 12 mo · ≤1 miLoading sold comps…