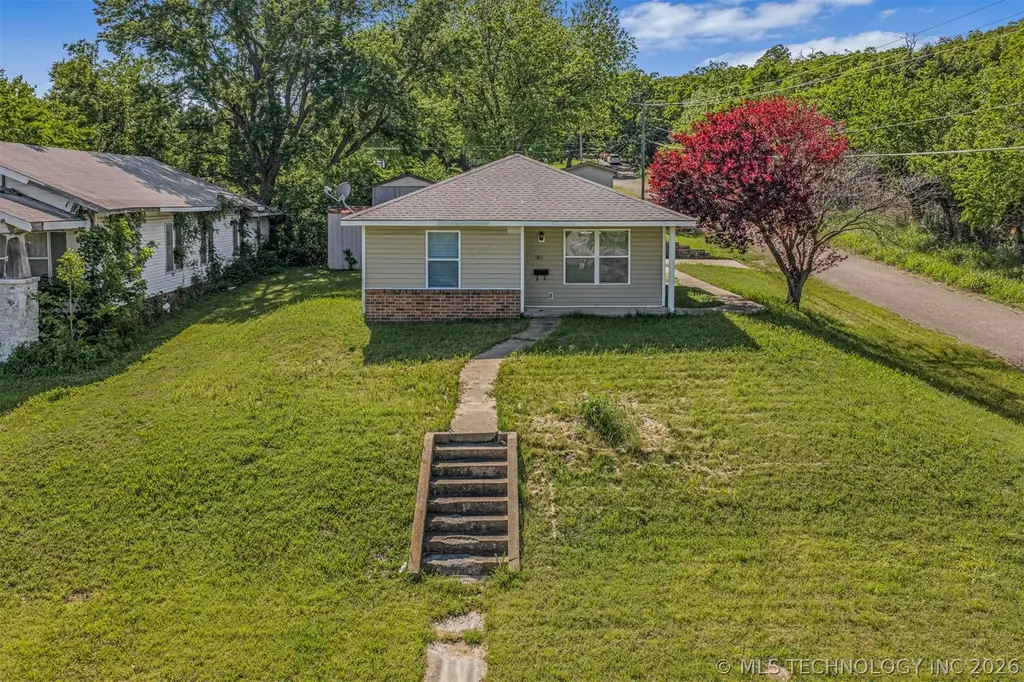
1811 Revard Ave · Pawhuska, OK
Flood risk 1/10 · Minimal
- FEMA flood zone
- X (unshaded)
- Chance of flooding over 30 yrs
- 0.0%
- Est. flood insurance / yr
- $507 – $1,088
Fire risk 10/10 · Severe
- Est. fire insurance / yr
- $2,463 – $4,575
Heat risk 5/10 · Moderate
- Hot days now (above 111°F)
- 7 days/yr
- Hot days in 30 yrs
- 19 days/yr
Wind risk 2/10 · Minimal
- Chance of severe wind over 30 yrs
- 1.0%
Air-quality risk 2/10 · Minimal
- Unhealthy air days now
- 1 days/yr
- Unhealthy air days in 30 yrs
- 3 days/yr
Risk factors via First Street. Map © Google.
Why this score? — see what drove the B- grade
The composite is a weighted blend of 9 inputs, each scored 0–100. Each bar is that input's sub-score; the figure is the points it added to the 100-point composite (weight × sub-score).
- Cash flow +22.8/30.0
- ARV discount +15.0/15.0
- Appreciation +7.8/10.0
- DSCR +7.3/10.0
- 1% rule +5.5/10.0
- Livability +3.5/5.0
- Rent growth +2.5/5.0
- Condition / age +2.5/5.0
- Schools +0.9/10.0
$99,900
🖨 Deal sheet 📄 Offer letter ✓ Due diligence
Listing remarks
Single-Story , 2 bedrooms, 2 bathroom home situated on two lots offering added space and flexibility. This well-maintained property features 36" wide interior doorway's throughout most of the home (with one standard size interior door), providing enhanced accessibility through the home. Inside you will find laminate wood flooring throughout and a freshly painted interior. The spacious eat-in kitchen offers ample cabinetry and storage. The utility room includes additional storage and direct access to exterior for convenience. Two shed remain with the sale. This home is move in ready and offers a practical layout with thoughtful updates throughout. Home is situated near Pawhuska element
Key facts
- Two lots
- Utility room
- Ample cabinetry
Tags
Property features AI
Finance
- HOA & community: Sidewalks in the community
Exterior
- Security: Smoke detector(s); No safety shelter
- Utilities: Public water; Public sewer; Utilities listed as unknown
- Home design: Single-story home; Faces east; Slab foundation
- Construction: Vinyl siding; Wood frame construction; Built (year per public records)
- Exterior features: Corner lot; Sloped lot; Shed(s)
Interior
- Kitchen: Eat-in kitchen; Oven; Range; Dishwasher; Electric water heater
- Bedrooms: First-floor bedroom with walk-in closet; First-floor bedroom with private bath and walk-in closet
- Flooring: Laminate flooring
- Bathrooms: Two full bathrooms; Hall bath with bathtub and vent
- Heating & cooling: Central heating (electric); Central air conditioning
- Interior features: Ceiling fan(s); Vinyl windows; Other interior features
- Laundry & utility: Inside utility room; Electric dryer hookup; Gas dryer hookup
Neighborhood map
What this means for you Summary
Snapshot
- This is a 2-bed/2.0-bath single-family listed at $100k.
Deal economics
- At list price, monthly cash flow is $174 ($2k/yr) — positive.
- The deal already cash-flows at list — no discount required.
- Meets the 1% rule at list price ($1k rent vs $100k).
Location & tenants
- Location reads 70/100 on livability (#37 in OK) — a middle-class / working-renter tenant base. Strengths: cost of living A+, housing A+, health & safety A+; Watch: crime D+, schools F, amenities F.
- Pawhuska (town): math 9% / reading 13% proficiency, ranked #248 of 270 in OK (top 92%) — low school quality limits family demand, transient renter base, plan for 1-2y turnover; 61% free/reduced lunch — lower-income household profile, screen leases tightly.
- Market conditions: 33 active listings in the ZIP; 89 units permitted in Osage County in 2024 (0 in 5+ unit buildings).
Forward outlook
- In year one you build about $6k of equity ($691 loan paydown + $6k appreciation (5.7% local appreciation)).
- Osage County population projected to shrink 6% by 2050 — rents likely to lag national; underwrite the cash flow, not the appreciation.
- At projected returns (5.7% appreciation + 3.0% rent growth), your $28k cash investment doubles in ~4 years — after that, you're playing with house money.
- By year 6, paydown + projected appreciation supports a ~$35k cash-out refi (75% LTV) — recoverable capital for the next deal without selling this one.
Negotiation context
- Only 13 days on market — expect competitive offers; lowballing is unlikely to land.
Risks & watch-outs
- Climate carrying-cost: severe wildfire risk; extreme-heat days projected 7→19/yr by 2055 (HVAC capex compounding) — expect insurance premiums to compound above CPI over the hold.
Questions for the listing agent
- Is there a deadline driving the sale (1031 exchange, divorce, estate, relocation)? That informs how much negotiation room exists.
- Schools are F-rated, which usually means shorter tenancies and higher turnover. Who's the typical renter profile here, and what's been the actual vacancy rate?
- Crime grade is D in this area — have there been break-ins, vandalism, or insurance claims at this property in the last 3 years? What carrier currently insures it and at what premium?
- What's the average days-on-market for RENTAL listings here right now (not sales)? A rising rental-DOM trend means longer vacancies and softer asking-rent achievability than the comps imply.
- What's the recent tenant-quality profile in this submarket — average credit score on applications, eviction rate, late-payment / NSF rate, and stable-employment percentage? A property-management company in the area should have these aggregated.
- How much new for-sale + rental construction is in the pipeline within 1–3 miles? Heavy new supply typically softens prices + rents 12–24 months out; constrained supply supports both.
Investment metrics
- 1% rule
- 1.05% ✓
- Cap rate
- 8.39%
- Cash-on-cash
- 7.48%
- DSCR
- 1.33
- GRM
- 7.9
CMA / ARV
- ARV (on-the-fly)
- $152,256
- Comps found
- 4
Show comp detail 4 sales within ~0.75 mi
| Address | Dist | Beds/Ba | Sqft | Sold | Price | $/sf | Match |
|---|---|---|---|---|---|---|---|
| 1419 Leahy Ave | 0.30mi | 2/1.0 | 1,120 (-10%) | 3mo | $155,000 | $138 | 62 |
| 1611 Claremore Ave | 0.44mi | 3/1.0 (+1) | 1,273 (+2%) | 20mo | $110,000 | $86 | 50 |
| 2113 Mckenzie Rd | 0.44mi | 3/2.0 (+1) | 1,323 (+6%) | 20mo | $161,500 | $122 | 48 |
| 720 E 11th St | 0.59mi | 3/1.0 (+1) | 1,409 (+13%) | 10mo | $15,000 | $11 | 34 |
Match score weights: distance 35% · size 25% · config 20% · recency 20%. Top-matched comps best support the ARV.
Projected returns pro-forma
5.7% appreciation · 3.0% rent growth · sell at horizon
- IRR
- 20.9%
- Equity multiple
- 2.36×
- Total profit
- $38,174
- Equity at exit
- $60,913
- IRR
- 20.2%
- Equity multiple
- 4.72×
- Total profit
- $104,077
- Equity at exit
- $108,869
Cash invested: $27,972 (down + closing). Projections, not guarantees.
Landlord ↔ Tenant lean methodology
- Overall (STATE)
- 83 Strongly Landlord-Friendly
- State Oklahoma
- 83 Strongly Landlord-Friendly · R+20
- County
- — inherits STATE
- City
- — inherits STATE
ZIP-level market 74056
- Home prices YoY
- 2.0%
- Active inventory
- 33
- Price-to-rent
- 7.9×
Monthly cashflow live
- Estimated rent
- $1,052 medium interval (Pro) →
- Mortgage (P&I)
- −$524
- Tax from tax record
- −$91 /mo · $1,093/yr
- Insurance
- −$42
- HOA
- −$0
- Vacancy / Maint / Mgmt
- −$221
- Net cashflow
- $174
Break-even live
UW: 25.0% down · 7.5% · 30yr · 1.5% tax · 5.0% vac · 8.0% maint · 8.0% mgmt
Financing live
Cash to close
- Down payment
- $24,975
- Closing costs
- $2,997
- Reserves months
- —
- Total cash needed
- —
Loan-product check · same deal, 3 products live
Conventional
25% down · 7.5% · 30yr
- Down + closing
- —
- Monthly P&I
- —
- Monthly cashflow
- —
- DSCR
- —
- Eligible?
- —
Personal DTI + credit; lowest rate.
DSCR
20% down · 8.5% · 30yr
- Down + closing
- —
- Monthly P&I
- —
- Monthly cashflow
- —
- DSCR
- —
- Eligible?
- —
No personal income docs; deal must DSCR.
Hard money
10% down · 12.0% · 12mo
- Down + closing
- —
- Monthly P&I
- —
- Monthly cashflow
- —
- DSCR
- —
- Eligible?
- —
Short-term bridge; refi at stabilization.
Listing history 2 events
-
2026-05-12status Pending
-
2026-04-30$99,900 Active
ⓘ Source: listings_history table (triggers on properties + properties_extension) + one-shot
backfill from property_details.listing_events for pre-trigger history.
Tax reassessment forecast OK · Resets to sale price
- Current annual tax
- $1,093 · $91/mo
- Projected year-2 tax
- $1,093 · $91/mo
- Expected delta
- $0/yr ($0/mo · 0.0%)
ⓘ Screening estimate from a state-policy table — verify with the county assessor before closing.
Climate risk First Street
- Flood 1/10 Low FEMA zone X (unshaded) · 0% chance over 30 yrs
- Wildfire 10/10 Extreme
- Heat 5/10 Major 7 d/yr ≥111°F today · 19 d/yr by 30 yrs out
- Wind 2/10 Low 100% chance of damaging wind over 30 yrs
- Air quality 2/10 Low 1 unhealthy d/yr today · 3 by 30 yrs out
Nearby sold comps map
Loading sold comps map…
Walkable amenities ~0.75 mi
Loading nearby amenities…
Taxation est. · year 1
- Rental income
- $12,623
- − Mortgage interest
- −$5,596
- − Property taxes
- −$1,093
- − Insurance
- −$500
- − Repairs & maintenance
- −$1,010
- − Management
- −$1,010
- − Depreciation
- −$2,906
- Taxable income
- $509
- Est. tax owed @ 24.0%
- −$122
- After-tax cash flow
- $1,971/yr
For passive investors: Depreciation is non-cash, so a rental often shows a tax loss while cash-flowing — sheltering income. Rental losses are passive: they offset passive income freely, and up to $25,000/yr can offset ordinary (W-2) income if you actively participate and your MAGI is under $100k (phasing out to $0 by $150k); unused losses carry forward. On sale, claimed depreciation is recaptured at up to 25%, and gains may owe capital-gains tax (a 1031 exchange can defer both). Figures are a year-1 estimate at your 24.0% rate — not tax advice; consult a CPA.
Schools (NCES district)
- District
- Pawhuska
- NCES district ID
- 4023580
- Math proficiency
- 9% ▼ -6.00%
- Reading proficiency
- 13% ▼ -8.00%
- Median HH income
- $34,773
- Composite
- 8.98/100
- National rank
- #9883
- State rank
- #248 of 270 in OK
Livability — Pawhuska
- Score
- 70/100
- State rank
- #37
- US rank
- #7514
Category grades
Schools grade is shown separately in the Schools card above.
Census & demographics
- Census place
- Pawhuska, OK
- Population (ZIP)
- 4,874
Population outlook (Osage County) Hauer SSP2
- Today (2025)
- 48,950 people
- By 2030
- 48,936 · +-0.0%
- By 2040
- 47,826 · -2.3%
- By 2050
- 45,781 · -6.5%
- By 2075
- 41,140 · -16.0%
- By 2100
- 32,796 · -33.0%
Race, ethnicity, and origin ACS 2023
- Neighborhood character
- Diverse neighborhood (Simpson 0.64)
- Race & ethnicity
- White 59% Native American 27% Two or more races 11% Hispanic / Latino 4%
- Common ancestry
- Italian 3% Lithuanian 2% Iranian 2%
- Foreign-born
- 1% · Canada, Vietnam
- Languages at home
- 95% English-only · Spanish 3%
Political lean MEDSL · Osage
- 2024 margin
- Solid R (+41.4) · D 28.4% · R 69.8% · Other 1.7%
- 2008→2024 swing
- -17.7pp toward R · 2008: -23.7pp · 2024: -41.4pp
- All cycles
- 2024: R+41.4 2020: R+39.5 2016: R+36.8 2012: R+25.2 2008: R+23.7
Not yet ingested
- Civics
- —
Market trends
- HPI YoY
- ▲ 5.70%
- Current HPI
- 296.6482
- Rent YoY
- —
- Metro
- —
- State GDP YoY
- ▲ 1.55%
- F500 in state
- 6
Industry mix (Fortune 500 HQ in OK)
| Industry | F500 HQs | Revenue |
|---|---|---|
| Energy | 3 | $48B |
|
||
Price history
2 events — show timeline
- 2026-05-12 Pending — MLS Technology, Inc.
- 2026-04-30 Listed $99,900 MLS Technology, Inc.
Property tax history
+1.8%/yrLatest (2025): $1,093 · +10.7% YoY. Source: county tax records.
Cash-flow waterfall
monthlySold comps — $/sqft
last 12 mo · ≤1 miLoading sold comps…