 Multi-family
764 Terminal Ct · Columbus, GA
Flood risk No data
- FEMA flood zone
- —
- Chance of flooding over 30 yrs
- —
- Est. flood insurance / yr
- —
Fire risk No data
- Est. fire insurance / yr
- —
Heat risk No data
- Hot days now (above threshold)
- —
- Hot days in 30 yrs
- —
Wind risk No data
- Chance of severe wind over 30 yrs
- —
Air-quality risk No data
- Unhealthy air days now
- —
- Unhealthy air days in 30 yrs
- —
Risk factors via First Street. Map © Google.
Why this score? — see what drove the C+ grade
The composite is a weighted blend of 9 inputs, each scored 0–100. Each bar is that input's sub-score; the figure is the points it added to the 100-point composite (weight × sub-score).
- Cash flow +30.0/30.0
- 1% rule +10.0/10.0
- DSCR +10.0/10.0
- Rent growth +3.7/5.0
- Livability +3.2/5.0
- Schools +2.2/10.0
- Condition / age +1.0/5.0
- ARV discount +0.8/15.0
- Appreciation +0.0/10.0
$115,000
🖨 Deal sheet 📄 Offer letter ✓ Due diligence
Multi-family units
County records classify this as Multi-Family (2-4 Unit). Listing-text estimate: 1 unit. estimate disagrees with records
Listing remarks
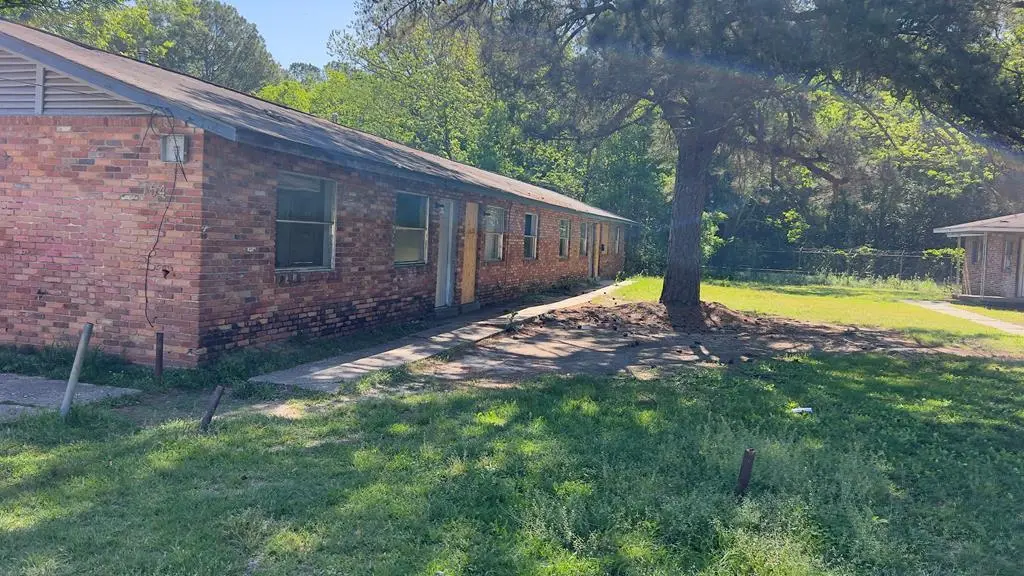
All-brick quadraplex, located on a circular road in close proximity to shopping, medical and entertainment. Complex conforms to the other buildings on the street. Proof of funds is required to show the properties and must be escorted by a licensed agent. Agents, please email if help is needed. Thank you
Key facts
- 0.23 acre lot
- Listed 55 days
Property features AI
Exterior
- Utilities: Public water; Public sewer
- Home design: Residential income property (quadruplex)
- Construction: Brick construction
- Exterior features: Lot approximately 0.23 acres
Interior
- Interior features: Unbranded virtual tour available
Neighborhood map
What this means for you Summary
Snapshot
- This is a 2-bed/1.0-bath multifamily listed at $115k. Condition is rated poor.
Deal economics
- At list price, monthly cash flow is $2k ($20k/yr) — positive.
- The deal already cash-flows at list — no discount required.
- Meets the 1% rule at list price ($3k rent vs $115k).
- Recommended offer: $112k (3.0% below list) — sets the bar for market timing.
- Cap rate 23.9% vs local median 4.7% in Columbus — top-decile yield for the area; either an underpriced asset or a hidden risk that comps aren't pricing in. Stress-test before assuming the spread holds.
Location & tenants
- Location reads 64/100 on livability (#254 in GA) — a middle-class / working-renter tenant base. Strengths: cost of living A+, housing A+, health & safety B; Watch: amenities D+, schools F, crime F.
- Muscogee County (urban): math 21% / reading 30% proficiency, ranked #120 of 174 in GA (top 69%) — low school quality limits family demand, transient renter base, plan for 1-2y turnover; 61% free/reduced lunch — lower-income household profile, screen leases tightly.
- Market conditions: Rents rising fast (+4.8%/yr); 118 active listings in the ZIP; 5 comparable units currently listed for rent nearby; rentals at typical pace (median 21d on market — plan ~3-4 weeks tenant-placement turnaround); 40% of comp listings sitting > 30 days — soft ceiling on asking rent; lower-income renter base — watch delinquency; 291 units permitted in Muscogee County in 2024 (30 in 5+ unit buildings).
- At $3,092/mo this rent would consume 83% of the median local household income ($45k/yr) (locally 1003% of renters already pay >50% of income on rent) — very limited rent-growth headroom before tenants either downsize or default.
Forward outlook
- Local home prices are declining (-3.0%/yr); year-one equity from $795 of loan paydown is wiped out by about $3k of value loss. Plan a longer hold.
- Muscogee County population projected at +15% by 2050 — modest demand growth; plan on rents tracking national, not racing it.
- At projected returns (-3.0% appreciation + 4.8% rent growth), your $32k cash investment doubles in ~2 years — after that, you're playing with house money.
Negotiation context
- It's been on market 55 days — a 3% lower offer ($112k) is reasonable based on typical stale-listing flexibility.
- 3 sale attempts since 2y ago with the ask held roughly flat each time — persistent listings suggest the price (not the market) is what's stuck; bring a comps-based counter.
- Current owner paid $50k; list at $115k implies a 130% gain — meaningful room to come down on a strong offer.
Risks & watch-outs
- Watch-outs: built in 1958 — expect roof / HVAC / electrical / plumbing capex.
Questions for the listing agent
- It's been on market 55 days. Have you received any prior offers? Is the seller open to a 3% concession, seller financing, or rate buy-down credit?
- Have any recent inspections been done? Can we get a copy of the seller's disclosures and any deferred-maintenance estimates?
- Built in 1958 — when were the roof, HVAC, electrical panel, plumbing, and water heater last replaced?
- Is there a deadline driving the sale (1031 exchange, divorce, estate, relocation)? That informs how much negotiation room exists.
- Schools are F-rated, which usually means shorter tenancies and higher turnover. Who's the typical renter profile here, and what's been the actual vacancy rate?
- Crime grade is F in this area — have there been break-ins, vandalism, or insurance claims at this property in the last 3 years? What carrier currently insures it and at what premium?
- What's the average days-on-market for RENTAL listings here right now (not sales)? A rising rental-DOM trend means longer vacancies and softer asking-rent achievability than the comps imply.
- What's the recent tenant-quality profile in this submarket — average credit score on applications, eviction rate, late-payment / NSF rate, and stable-employment percentage? A property-management company in the area should have these aggregated.
- How much new apartment / multifamily construction is in the pipeline within 1–3 miles? Heavy new supply (>2% of stock underway) typically softens rents 12–24 months out; light construction supports rent growth.
Investment metrics
- 1% rule
- 2.69% ✓
- Cap rate
- 23.86%
- Cash-on-cash
- 62.75%
- DSCR
- 3.79
- GRM
- 3.1
CMA / ARV
- ARV (median comp)
- $100,000
- List price
- $115,000
- Delta
- 15.00%
- Verdict
- OVERPRICED
- Comps
- 5 within 1.0 mi
Projected returns pro-forma
-3.0% appreciation · 4.82% rent growth · sell at horizon
- IRR
- 63.8%
- Equity multiple
- 3.93×
- Total profit
- $94,404
- Equity at exit
- $17,147
- IRR
- 68.8%
- Equity multiple
- 8.61×
- Total profit
- $244,958
- Equity at exit
- $9,943
Cash invested: $32,200 (down + closing). Projections, not guarantees.
Landlord ↔ Tenant lean methodology
- Overall (STATE)
- 90 Strongly Landlord-Friendly
- State Georgia
- 90 Strongly Landlord-Friendly · R+3
- County
- — inherits STATE
- City
- — inherits STATE
ZIP-level market 31906
- Rents YoY
- 4.8%
- Active inventory
- 118
- Price-to-rent
- 12.4×
Monthly cashflow live
- Estimated rent
- $3,092 high interval (Pro) →
- Mortgage (P&I)
- −$603
- Tax from tax record
- −$108 /mo · $1,293/yr
- Insurance
- −$48
- HOA
- −$0
- Vacancy / Maint / Mgmt
- −$649
- Net cashflow
- $1,684
Break-even live
4-unit breakdown (identical units grouped — click to expand)
| Units | Beds | Baths | Est. rent |
|---|---|---|---|
| 4× units | 2 | 1 | $3,092 |
| #1 | 2 | 1 | $773 |
| #2 | 2 | 1 | $773 |
| #3 | 2 | 1 | $773 |
| #4 | 2 | 1 | $773 |
| Total (4 units) | $3,092 | ||
UW: 25.0% down · 7.5% · 30yr · 1.5% tax · 5.0% vac · 8.0% maint · 8.0% mgmt
Financing live
Cash to close
- Down payment
- $28,750
- Closing costs
- $3,450
- Reserves months
- —
- Total cash needed
- —
Loan-product check · same deal, 3 products live
Conventional
25% down · 7.5% · 30yr
- Down + closing
- —
- Monthly P&I
- —
- Monthly cashflow
- —
- DSCR
- —
- Eligible?
- —
Personal DTI + credit; lowest rate.
DSCR
20% down · 8.5% · 30yr
- Down + closing
- —
- Monthly P&I
- —
- Monthly cashflow
- —
- DSCR
- —
- Eligible?
- —
No personal income docs; deal must DSCR.
Hard money
10% down · 12.0% · 12mo
- Down + closing
- —
- Monthly P&I
- —
- Monthly cashflow
- —
- DSCR
- —
- Eligible?
- —
Short-term bridge; refi at stabilization.
Rent comps 5 comps
| Address | Beds | Baths | Sqft | Rent | $/sqft | DOM | Units | Dist |
|---|---|---|---|---|---|---|---|---|
| 3775 Steam Mill Rd Columbus, GA | 3.0 | 2.0 | 1613 | $2,100 | $1.30 | 43d | 1 | 0.58mi |
| 1097 Bolton Ct Columbus, GA | 3.0 | 2.5 | 2127 | $1,350 | $0.63 | 21d | 1 | 0.60mi |
| 2309 Willard St Columbus, GA | 3.0 | 2.0 | 1803 | $1,700 | $0.94 | 13d | 1 | 0.96mi |
| 1706 Wells Dr Columbus, GA | 3.0 | 2.0 | 1990 | $1,850 | $0.93 | 13d | 1 | 1.38mi |
| 1192 Munro Ave Columbus, GA | 3.0 | 2.0 | 1711 | $1,750 | $1.02 | 43d | 1 | 1.48mi |
Listing history 26 events
-
2026-06-18days on market $115,000 Active 55 DOM
-
2026-06-17days on market $115,000 Active 54 DOM
-
2026-06-16days on market $115,000 Active 53 DOM
-
2026-06-15days on market $115,000 Active 52 DOM
-
2026-06-14days on market $115,000 Active 50 DOM
-
2026-06-13days on market $115,000 Active 49 DOM
-
2026-06-10days on market $115,000 Active 47 DOM
-
2026-06-09days on market $115,000 Active 46 DOM
-
2026-06-08days on market $115,000 Active 45 DOM
-
2026-06-07days on market $115,000 Active 44 DOM
-
2026-06-05days on market $115,000 Active 41 DOM
-
2026-06-03days on market $115,000 Active 40 DOM
-
2026-06-02days on market $115,000 Active 39 DOM
-
2026-06-01days on market $115,000 Active 38 DOM
-
2026-05-31days on market $115,000 Active 37 DOM
-
2026-05-30days on market $115,000 Active 36 DOM
-
2026-04-24$120,000 Active 304-char remark
-
2024-09-28status Pending
-
2024-07-30price $189,000
-
2024-07-30price $189,000
-
2024-06-21price $199,000
-
2024-06-21price $199,000
-
2024-06-21status Active
-
2024-06-11status Pending
-
2024-05-17$215,000 Active
-
2022-06-09soldstatus $50,000
ⓘ Source: listings_history table (triggers on properties + properties_extension) + one-shot
backfill from property_details.listing_events for pre-trigger history.
Tax reassessment forecast GA · Resets to sale price
- Current annual tax
- $1,293 · $108/mo
- Projected year-2 tax
- $1,293 · $108/mo
- Expected delta
- $0/yr ($0/mo · 0.0%)
ⓘ Screening estimate from a state-policy table — verify with the county assessor before closing.
Nearby sold comps map
Loading sold comps map…
Walkable amenities ~0.75 mi
Loading nearby amenities…
Taxation est. · year 1
- Rental income
- $37,104
- − Mortgage interest
- −$6,442
- − Property taxes
- −$1,293
- − Insurance
- −$575
- − Repairs & maintenance
- −$2,968
- − Management
- −$2,968
- − Depreciation
- −$3,345
- Taxable income
- $19,512
- Est. tax owed @ 24.0%
- −$4,683
- After-tax cash flow
- $15,524/yr
For passive investors: Depreciation is non-cash, so a rental often shows a tax loss while cash-flowing — sheltering income. Rental losses are passive: they offset passive income freely, and up to $25,000/yr can offset ordinary (W-2) income if you actively participate and your MAGI is under $100k (phasing out to $0 by $150k); unused losses carry forward. On sale, claimed depreciation is recaptured at up to 25%, and gains may owe capital-gains tax (a 1031 exchange can defer both). Figures are a year-1 estimate at your 24.0% rate — not tax advice; consult a CPA.
Condition & rehab AI · 12 photos
This multi-family property requires extensive repairs and maintenance to bring it up to a livable condition. Immediate attention is needed to address safety hazards and improve the property's value.
Repairs flagged
- Major Exposed plumbing and electrical wiring — Safety hazard
- Major Overgrown vegetation and debris — Safety hazard
Value-add opportunities
- Both Paint — Enhances curb appeal and interior aesthetics
- Both Flooring — Improves comfort and durability
- Both Windows — Enhances natural light and security
- Both HVAC — Improves comfort and energy efficiency
Renovation cost estimate screening
| Repair item | Severity | Est. cost |
|---|---|---|
| Exposed plumbing and electrical wiring · Safety hazard | Major | $15,000–50,000 |
| Overgrown vegetation and debris · Safety hazard | Major | $15,000–50,000 |
| Total estimated repair cost · 2 items | $30,000–100,000 |
Value-add ROI direction
- Both Paint — Enhances curb appeal and interior aesthetics ↑
- Both Flooring — Improves comfort and durability ↑
- Both Windows — Enhances natural light and security ↑
- Both HVAC — Improves comfort and energy efficiency ↑
ⓘ Cost ranges are severity-bucket heuristics (US national rule-of-thumb). Get contractor quotes + a written scope before underwriting a rehab budget.
Schools (NCES district)
- District
- Muscogee County
- NCES district ID
- 1303870
- Math proficiency
- 21% ▼ -11.00%
- Reading proficiency
- 30% ▼ -7.00%
- Median HH income
- $41,176
- Composite
- 21.6/100
- National rank
- #8297
- State rank
- #120 of 174 in GA
Livability — Columbus
- Score
- 64/100
- State rank
- #254
- US rank
- #14102
Category grades
Schools grade is shown separately in the Schools card above.
Census & demographics
- Census place
- Columbus, GA
- County
- Muscogee County · 180,764 people
- City population
- 180,764
- Metro
- Columbus, GA-AL
- Population (ZIP)
- 20,400
- Household income
- $44,965
- Rent vs Own
- Severe rent burden
- 1003.0
Population outlook (Muscogee County) Hauer SSP2
- Today (2025)
- 216,729 people
- By 2030
- 224,504 · +3.6%
- By 2040
- 238,318 · +10.0%
- By 2050
- 249,027 · +14.9%
- By 2075
- 264,862 · +22.2%
- By 2100
- 254,786 · +17.6%
Race, ethnicity, and origin ACS 2023
- Neighborhood character
- Majority Black (64%)
- Race & ethnicity
- Black 64% White 28% Hispanic / Latino 4% Two or more races 3% Asian 1%
- Common ancestry
- Slovak 1% Lithuanian 1% Hispanic 1%
- Foreign-born
- 3% · Canada
- Languages at home
- 95% English-only · Spanish 3% Other Indo-European 1%
Political lean MEDSL · Muscogee
- 2024 margin
- Strong D (+23.4) · D 61.4% · R 38.0%
- 2008→2024 swing
- +3.7pp toward D · 2008: 19.7pp · 2024: 23.4pp
- All cycles
- 2024: D+23.4 2020: D+24.0 2016: D+18.6 2012: D+21.3 2008: D+19.7
Not yet ingested
- Civics
- —
Market trends
- HPI YoY
- ▼ -122.49%
- Current HPI
- 113.2749
- Rent YoY
- ▲ 4.82%
- Metro
- Columbus, GA-AL
- State GDP YoY
- ▲ 2.66%
- F500 in state
- 28
Industry mix (Fortune 500 HQ in GA)
| Industry | F500 HQs | Revenue |
|---|---|---|
| Paper / Packaging | 2 | $29B |
|
||
| Retail | 1 | $160B |
|
||
| Transportation / Logistics | 1 | $91B |
|
||
| Airlines | 1 | $62B |
|
||
| Consumer Goods | 1 | $47B |
|
||
| Utilities | 1 | $25B |
|
||
Price history
+130.0% since first listed11 events — show timeline
- 2026-05-28 Price Changed $115,000 CBOR
- 2026-04-24 Listed $120,000 CBOR
- 2024-09-28 Pending — EABOR
- 2024-07-30 Price Changed $189,000 EABOR
- 2024-07-30 Price Changed $189,000 CBOR
- 2024-06-21 Price Changed $199,000 CBOR
- 2024-06-21 Price Changed $199,000 EABOR
- 2024-06-21 Relisted — EABOR
- 2024-06-11 Pending — EABOR
- 2024-05-17 Listed $215,000 EABOR
- 2022-06-09 Sold (Public Records) $50,000 Public Records
Property tax history
+18.3%/yrLatest (2025): $1,293 · +12.5% YoY. Source: county tax records.
Cash-flow waterfall
monthlySold comps — $/sqft
last 12 mo · ≤1 miLoading sold comps…