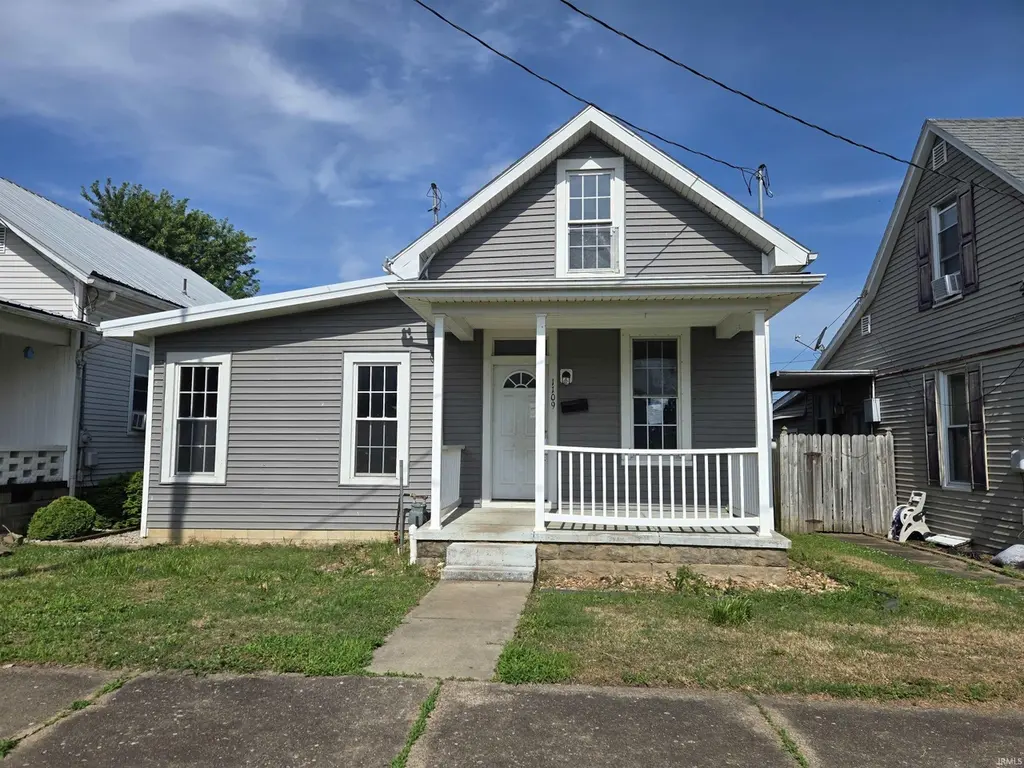
1109 9th St · Tell City, IN
Flood risk 1/10 · Minimal
- FEMA flood zone
- X (unshaded)
- Chance of flooding over 30 yrs
- 0.0%
- Est. flood insurance / yr
- $473 – $860
Fire risk 3/10 · Minor
- Est. fire insurance / yr
- $717 – $1,331
Heat risk 6/10 · Moderate
- Hot days now (above 106°F)
- 7 days/yr
- Hot days in 30 yrs
- 20 days/yr
Wind risk 2/10 · Minimal
- Chance of severe wind over 30 yrs
- 2.0%
Air-quality risk 3/10 · Minor
- Unhealthy air days now
- 2 days/yr
- Unhealthy air days in 30 yrs
- 5 days/yr
Risk factors via First Street. Map © Google.
Why this score? — see what drove the B+ grade
The composite is a weighted blend of 9 inputs, each scored 0–100. Each bar is that input's sub-score; the figure is the points it added to the 100-point composite (weight × sub-score).
- Cash flow +30.0/30.0
- ARV discount +15.0/15.0
- DSCR +10.0/10.0
- 1% rule +8.4/10.0
- Livability +3.8/5.0
- Schools +3.7/10.0
- Rent growth +2.5/5.0
- Condition / age +2.5/5.0
- Appreciation +0.0/10.0
$91,000
🖨 Deal sheet 📄 Offer letter ✓ Due diligence
Listing remarks
This 3-bedroom, 2.5-bath property offers plenty of potential for buyers looking to build sweat equity or investors searching for their next project. With a little TLC, this property could be transformed into a charming place to call home. The home features a spacious layout, a fenced backyard perfect for pets or outdoor gatherings, and both a covered porch and concrete patio for enjoying the outdoors. Off-street parking adds extra convenience and value. Whether you're a first-time buyer looking for an affordable way into homeownership or an investor with a vision, this property offers a great opportunity to make it your own. Bring your ideas and see the possibilities!
Key facts
- Covered porch
- Concrete patio
- Fenced backyard
Tags
Property features AI
Exterior
- Parking: Off-street parking
- Utilities: Public water; Public sewer
- Home design: Single-family, site-built residential home; One story
- Construction: Vinyl siding
- Exterior features: Level lot; Lot dimensions approximately 40 x 140
Interior
- Bathrooms: 2 full bathrooms; 1 half bathroom; 2 main-level bathrooms
- Heating & cooling: Central air conditioning; Natural gas forced air heating
- Interior features: 6 total rooms; Unfinished basement
- Laundry & utility: Laundry on the main level
Neighborhood map
What this means for you Summary
Snapshot
- This is a 3-bed/2.5-bath single-family listed at $91k.
Deal economics
- At list price, monthly cash flow is $352 ($4k/yr) — positive.
- The deal already cash-flows at list — no discount required.
- Meets the 1% rule at list price ($1k rent vs $91k).
Location & tenants
- Location reads 75/100 on livability (#60 in IN, #4,053 nationally) — a middle-class / working-renter tenant base. Strengths: cost of living A+, housing A+, crime A; Watch: employment D, amenities F, commute F.
- Tell City-Troy Twp School Corporation (rural): math 37% / reading 51% proficiency, ranked #108 of 301 in IN (top 36%) — families likely to look elsewhere, expect single-tenant / working-renter base with shorter leases.
- Zoned schools: William Tell Elementary School (math 34% / reading 43%, grade F, #535 of 994 statewide, top 54%, 757 students, 52% FRL); Tell City Jr-Sr High School (math 39% / reading 61%, grade D+, #120 of 369 statewide, top 33%, 643 students, 47% FRL).
- Market conditions: 29 active listings in the ZIP; 31 units permitted in Perry County in 2024 (0 in 5+ unit buildings).
Forward outlook
- Local home prices are declining (-3.0%/yr); year-one equity from $629 of loan paydown is wiped out by about $3k of value loss. Plan a longer hold.
- Perry County population projected to shrink 9% by 2050 — rents likely to lag national; underwrite the cash flow, not the appreciation.
- At projected returns (-3.0% appreciation + 3.0% rent growth), your $25k cash investment doubles in ~8 years — after that, you're playing with house money.
Negotiation context
- Only 7 days on market — expect competitive offers; lowballing is unlikely to land.
- 3 sale attempts since 12y ago with the ask held roughly flat each time — persistent listings suggest the price (not the market) is what's stuck; bring a comps-based counter.
- Current owner paid $68k; 33% above their basis — modest negotiation headroom, anchor on the comps not their cost.
Risks & watch-outs
- Watch-outs: built in 1915 — expect roof / HVAC / electrical / plumbing capex.
- Climate carrying-cost: extreme-heat days projected 7→20/yr by 2055 (HVAC capex compounding) — expect insurance premiums to compound above CPI over the hold.
Questions for the listing agent
- Built in 1915 — when were the roof, HVAC, electrical panel, plumbing, and water heater last replaced?
- Is there a deadline driving the sale (1031 exchange, divorce, estate, relocation)? That informs how much negotiation room exists.
- What's the average days-on-market for RENTAL listings here right now (not sales)? A rising rental-DOM trend means longer vacancies and softer asking-rent achievability than the comps imply.
- What's the recent tenant-quality profile in this submarket — average credit score on applications, eviction rate, late-payment / NSF rate, and stable-employment percentage? A property-management company in the area should have these aggregated.
- How much new for-sale + rental construction is in the pipeline within 1–3 miles? Heavy new supply typically softens prices + rents 12–24 months out; constrained supply supports both.
Investment metrics
- 1% rule
- 1.34% ✓
- Cap rate
- 10.93%
- Cash-on-cash
- 16.57%
- DSCR
- 1.74
- GRM
- 6.2
CMA / ARV
- ARV (on-the-fly)
- $116,600
- Comps found
- 5
Show comp detail 5 sales within ~0.75 mi
| Address | Dist | Beds/Ba | Sqft | Sold | Price | $/sf | Match |
|---|---|---|---|---|---|---|---|
| 931 9th St | 0.17mi | 4/1.0 (+1) | 1,984 (-10%) | 3mo | $160,000 | $81 | 62 |
| 647 10th St | 0.46mi | 3/3.0 | 2,024 (-8%) | 14mo | $95,000 | $47 | 51 |
| 1045 13th St | 0.29mi | 3/1.0 | 2,520 (+14%) | 8mo | $115,000 | $46 | 49 |
| 533 15th St | 0.71mi | 3/2.5 | 2,212 (+0%) | 21mo | $117,900 | $53 | 49 |
| 631 16th St | 0.70mi | 3/1.0 | 1,956 (-11%) | 2mo | $149,000 | $76 | 41 |
Match score weights: distance 35% · size 25% · config 20% · recency 20%. Top-matched comps best support the ARV.
Projected returns pro-forma
-3.0% appreciation · 3.0% rent growth · sell at horizon
- IRR
- 7.7%
- Equity multiple
- 1.30×
- Total profit
- $7,664
- Equity at exit
- $13,568
- IRR
- 17.0%
- Equity multiple
- 2.40×
- Total profit
- $35,551
- Equity at exit
- $7,868
Cash invested: $25,480 (down + closing). Projections, not guarantees.
Landlord ↔ Tenant lean methodology
- Overall (STATE)
- 90 Strongly Landlord-Friendly
- State Indiana
- 90 Strongly Landlord-Friendly · R+11
- County
- — inherits STATE
- City
- — inherits STATE
ZIP-level market 47586
- Home prices YoY
- -22.5%
- Active inventory
- 29
- Price-to-rent
- 6.2×
Monthly cashflow live
- Estimated rent
- $1,219 medium interval (Pro) →
- Mortgage (P&I)
- −$477
- Tax from tax record
- −$96 /mo · $1,155/yr
- Insurance
- −$38
- HOA
- −$0
- Vacancy / Maint / Mgmt
- −$256
- Net cashflow
- $352
Break-even live
UW: 25.0% down · 7.5% · 30yr · 1.5% tax · 5.0% vac · 8.0% maint · 8.0% mgmt
Financing live
Cash to close
- Down payment
- $22,750
- Closing costs
- $2,730
- Reserves months
- —
- Total cash needed
- —
Loan-product check · same deal, 3 products live
Conventional
25% down · 7.5% · 30yr
- Down + closing
- —
- Monthly P&I
- —
- Monthly cashflow
- —
- DSCR
- —
- Eligible?
- —
Personal DTI + credit; lowest rate.
DSCR
20% down · 8.5% · 30yr
- Down + closing
- —
- Monthly P&I
- —
- Monthly cashflow
- —
- DSCR
- —
- Eligible?
- —
No personal income docs; deal must DSCR.
Hard money
10% down · 12.0% · 12mo
- Down + closing
- —
- Monthly P&I
- —
- Monthly cashflow
- —
- DSCR
- —
- Eligible?
- —
Short-term bridge; refi at stabilization.
Listing history 7 events
-
2026-06-18days on market $91,000 Active 7 DOM
-
2026-06-17days on market $91,000 Active 6 DOM
-
2026-06-16days on market $91,000 Active 5 DOM
-
2026-06-15days on market $91,000 Active 4 DOM
-
2026-06-13days on market $91,000 Active 2 DOM
-
2026-06-12remarks 676-char remark
-
2026-06-12$91,000 Active 1 DOM
ⓘ Source: listings_history table (triggers on properties + properties_extension) + one-shot
backfill from property_details.listing_events for pre-trigger history.
Tax reassessment forecast IN · Partial reset (capped growth)
- Current annual tax
- $1,155 · $96/mo
- Projected year-2 tax
- $1,155 · $96/mo
- Expected delta
- $0/yr ($0/mo · 0.0%)
ⓘ Screening estimate from a state-policy table — verify with the county assessor before closing.
Climate risk First Street
- Flood 1/10 Low FEMA zone X (unshaded) · 0% chance over 30 yrs
- Wildfire 3/10 Moderate
- Heat 6/10 Major 7 d/yr ≥106°F today · 20 d/yr by 30 yrs out
- Wind 2/10 Low 2% chance of damaging wind over 30 yrs
- Air quality 3/10 Moderate 2 unhealthy d/yr today · 5 by 30 yrs out
Nearby sold comps map
Loading sold comps map…
Walkable amenities ~0.75 mi
Loading nearby amenities…
Taxation est. · year 1
- Rental income
- $14,630
- − Mortgage interest
- −$5,097
- − Property taxes
- −$1,155
- − Insurance
- −$455
- − Repairs & maintenance
- −$1,170
- − Management
- −$1,170
- − Depreciation
- −$2,647
- Taxable income
- $2,934
- Est. tax owed @ 24.0%
- −$704
- After-tax cash flow
- $3,517/yr
For passive investors: Depreciation is non-cash, so a rental often shows a tax loss while cash-flowing — sheltering income. Rental losses are passive: they offset passive income freely, and up to $25,000/yr can offset ordinary (W-2) income if you actively participate and your MAGI is under $100k (phasing out to $0 by $150k); unused losses carry forward. On sale, claimed depreciation is recaptured at up to 25%, and gains may owe capital-gains tax (a 1031 exchange can defer both). Figures are a year-1 estimate at your 24.0% rate — not tax advice; consult a CPA.
Schools (NCES district)
- District
- Tell City-Troy Twp School Corporation
- NCES district ID
- 1811260
- Math proficiency
- 37% ▼ -19.00%
- Reading proficiency
- 51% ▼ -7.00%
- Median HH income
- $45,706
- Composite
- 37.35/100
- National rank
- #4435
- State rank
- #108 of 301 in IN
Livability — Tell City
- Score
- 75/100
- State rank
- #60
- US rank
- #4053
Category grades
Schools grade is shown separately in the Schools card above.
Census & demographics
- Census place
- Tell City, IN
- Population (ZIP)
- 10,994
Population outlook (Perry County) Hauer SSP2
- Today (2025)
- 19,125 people
- By 2030
- 18,912 · -1.1%
- By 2040
- 18,239 · -4.6%
- By 2050
- 17,402 · -9.0%
- By 2075
- 15,420 · -19.4%
- By 2100
- 11,987 · -37.3%
Race, ethnicity, and origin ACS 2023
- Neighborhood character
- Predominantly White (94%)
- Race & ethnicity
- White 94% Two or more races 3% Hispanic / Latino 1% Asian 1%
- Common ancestry
- Lithuanian 3% Italian 1% English 1%
- Foreign-born
- 1% · Canada
- Languages at home
- 98% English-only · Other Asian/Pacific 1% Spanish 1% German/W. Germanic 1%
Political lean MEDSL · Perry
- 2024 margin
- Strong R (+29.8) · D 34.3% · R 64.0% · Other 1.7%
- 2008→2024 swing
- -52.6pp toward R · 2008: 22.8pp · 2024: -29.8pp
- All cycles
- 2024: R+29.8 2020: R+24.6 2016: R+18.6 2012: D+11.6 2008: D+22.8
Not yet ingested
- Civics
- —
Market trends
- HPI YoY
- ▼ -56.86%
- Current HPI
- 196.1925
- Rent YoY
- —
- Metro
- —
- State GDP YoY
- ▲ 2.90%
- F500 in state
- 18
Industry mix (Fortune 500 HQ in IN)
| Industry | F500 HQs | Revenue |
|---|---|---|
| Industrial Machinery | 2 | $37B |
|
||
| Healthcare | 1 | $177B |
|
||
| Pharmaceuticals | 1 | $45B |
|
||
| Metals / Steel | 1 | $18B |
|
||
| Agriculture | 1 | $17B |
|
||
| Packaging | 1 | $12B |
|
||
Price history
+32.8% since first listed4 events — show timeline
- 2026-06-11 Listed $91,000 IRMLS
- 2016-12-28 Listed $76,900 IRMLS
- 2014-09-16 Listed $79,900 IRMLS
- 2009-07-31 Sold (Public Records) $68,500 Public Records
Property tax history
+18.4%/yrLatest (2024): $1,155 · +14.0% YoY. Source: county tax records.
Cash-flow waterfall
monthlySold comps — $/sqft
last 12 mo · ≤1 miLoading sold comps…