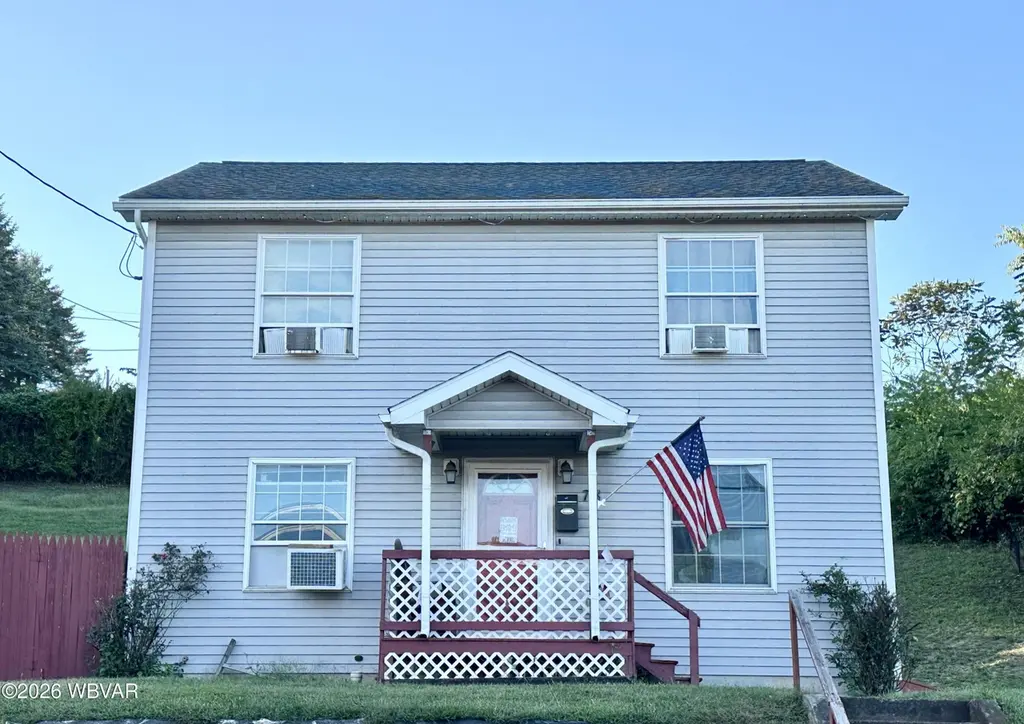
78 Montgomery St · Montgomery, PA
Flood risk 1/10 · Minimal
- FEMA flood zone
- X (unshaded)
- Chance of flooding over 30 yrs
- 0.0%
- Est. flood insurance / yr
- $473 – $860
Fire risk 1/10 · Minimal
- Est. fire insurance / yr
- $511 – $949
Heat risk 4/10 · Minor
- Hot days now (above 97°F)
- 8 days/yr
- Hot days in 30 yrs
- 17 days/yr
Wind risk 2/10 · Minimal
- Chance of severe wind over 30 yrs
- 2.0%
Air-quality risk 2/10 · Minimal
- Unhealthy air days now
- 1 days/yr
- Unhealthy air days in 30 yrs
- 1 days/yr
Risk factors via First Street. Map © Google.
Why this score? — see what drove the F grade
The composite is a weighted blend of 9 inputs, each scored 0–100. Each bar is that input's sub-score; the figure is the points it added to the 100-point composite (weight × sub-score).
- Appreciation +6.9/10.0
- Cash flow +5.7/30.0
- Schools +4.3/10.0
- Livability +3.6/5.0
- Rent growth +2.5/5.0
- Condition / age +2.5/5.0
- 1% rule +1.1/10.0
- DSCR +0.1/10.0
- ARV discount +0.0/15.0
$229,900
🖨 Deal sheet 📄 Offer letter ✓ Due diligence
Listing remarks
Discover the perfect balance of contemporary design and effortless living in this beautiful 2-story home. Built in 2013, this property offers a fresh, ''move-in-ready'' feel within the Montgomery School District. The heart of the home is an expansive open-concept main floor, where a stunning natural wood breakfast bar serves as the centerpiece and provides seamless flow from the kitchen to the dining and living areas. The finished lower level is a true ''multihyphenate'' space--perfectly suited for a cozy family media room, a dedicated home office, or guest quarters. 2nd Floor laundry, 3 bedrooms and 1.5 baths. Enjoy the convenience of off-street parking and a central Boro location that put
Key facts
- Off-street parking
- Finished lower level
- 8,276 sq ft lot
Tags
Property features AI
Exterior
- Parking: Off-street parking on gravel; No designated garage
- Utilities: Public water; 200+ amp electrical service
- Home design: Residential property
- Construction: Frame construction with vinyl siding; Block foundation; Shingle roof; Built area includes finished above- and below-grade space
- Exterior features: Porch; Level to sloped lot with steep slope areas
Interior
- Kitchen: Dishwasher; Refrigerator; Range
- Bedrooms: Upper level laundry (bedroom count not provided)
- Flooring: Laminate; Vinyl; Carpet
- Bathrooms: 1 full bathroom; 1 half bathroom
- Heating & cooling: Electric baseboard heating; Ceiling fan(s)
- Interior features: Bar; Ceiling fans; Walk-in closet(s); Full basement with exterior entry
- Laundry & utility: Laundry located on upper level
Neighborhood map
What this means for you Summary
Snapshot
- This is a 3-bed/1.5-bath single-family listed at $230k.
Deal economics
- At list price, monthly cash flow is $-469 ($-6k/yr) — negative.
- To cash-flow at today's rent, offer at most $147k (36.0% below list).
- To meet the 1% rule (rent ≥ 1% of price), the offer needs to be $140k (39.1% below list).
- Recommended offer: $140k (39.1% below list) — sets the bar for 1% rule.
Location & tenants
- Location reads 71/100 on livability (#727 in PA) — a middle-class / working-renter tenant base. Strengths: crime A+, cost of living A+, housing A+; Watch: health & safety D, amenities F, commute F.
- Montgomery Area SD (town): math 46% / reading 54% proficiency, ranked #180 of 539 in PA (top 33%) — acceptable for families but not a draw, mixed tenant base, ~2y average lease.
- Market conditions: 20 active listings in the ZIP; 3 comparable units currently listed for rent nearby; rentals at typical pace (median 15d on market — plan ~3-4 weeks tenant-placement turnaround); 73 units permitted in Lycoming County in 2024 (15 in 5+ unit buildings).
Forward outlook
- In year one you build about $10k of equity ($2k loan paydown + $9k appreciation (3.8% local appreciation)).
- Lycoming County population projected to shrink 10% by 2050 — rents likely to lag national; underwrite the cash flow, not the appreciation.
- By year 4, paydown + projected appreciation supports a ~$35k cash-out refi (75% LTV) — recoverable capital for the next deal without selling this one.
Negotiation context
- Only 4 days on market — expect competitive offers; lowballing is unlikely to land.
- 3 sale attempts since 8y ago with the ask held roughly flat each time — persistent listings suggest the price (not the market) is what's stuck; bring a comps-based counter.
- Current owner paid $170k; 35% above their basis — modest negotiation headroom, anchor on the comps not their cost.
Questions for the listing agent
- What do current leases actually rent for vs. the listed asking? Can we see a recent rent roll and the last 12 months of T-12 income?
- Is there a deadline driving the sale (1031 exchange, divorce, estate, relocation)? That informs how much negotiation room exists.
- Schools are B-rated — typically a magnet for longer-tenancy family renters. What's the average tenant stay here, and is there a school-zone premium baked into asking?
- The area grade is low — what's the realistic commute time and amenity access for the typical tenant pool here? Any planned neighborhood developments (good or bad) we should know about?
- What's the average days-on-market for RENTAL listings here right now (not sales)? A rising rental-DOM trend means longer vacancies and softer asking-rent achievability than the comps imply.
- What's the recent tenant-quality profile in this submarket — average credit score on applications, eviction rate, late-payment / NSF rate, and stable-employment percentage? A property-management company in the area should have these aggregated.
- How much new for-sale + rental construction is in the pipeline within 1–3 miles? Heavy new supply typically softens prices + rents 12–24 months out; constrained supply supports both.
Investment metrics
- 1% rule
- 0.61% ✗
- Cap rate
- 3.85%
- Cash-on-cash
- -8.74%
- DSCR
- 0.61
- GRM
- 13.7
CMA / ARV
- ARV (on-the-fly)
- $157,248
- Comps found
- 10
Show comp detail 10 sales within ~0.75 mi
| Address | Dist | Beds/Ba | Sqft | Sold | Price | $/sf | Match |
|---|---|---|---|---|---|---|---|
| 47 N Main St | 0.26mi | 3/1.5 | 1,448 (-0%) | 4mo | $97,500 | $67 | 84 |
| 65 E Houston Ave | 0.07mi | 3/1.5 | 1,632 (+12%) | 5mo | $176,000 | $108 | 72 |
| 82 Broad St | 0.10mi | 3/1.0 | 1,280 (-12%) | 2mo | $134,000 | $105 | 71 |
| 54 Broad St | 0.15mi | 3/1.5 | 1,344 (-8%) | 12mo | $165,000 | $123 | 70 |
| 200 Eagle Ln | 0.68mi | 3/1.5 | 1,500 (+3%) | 4mo | $189,900 | $127 | 60 |
| 48 Old Rd | 0.50mi | 3/2.0 | 1,492 (+2%) | 13mo | $160,000 | $107 | 60 |
| 1934 Pinchtown Rd | 0.48mi | 3/3.0 | 1,456 (0%) | 18mo | $131,000 | $90 | 57 |
| 20 Brook St | 0.30mi | 3/1.5 | 1,344 (-8%) | 20mo | $135,000 | $100 | 57 |
| 15 Brook St | 0.32mi | 3/1.5 | 1,326 (-9%) | 23mo | $153,000 | $115 | 51 |
| 130 W Houston Ave | 0.60mi | 3/1.0 | 1,513 (+4%) | 19mo | $207,500 | $137 | 48 |
Match score weights: distance 35% · size 25% · config 20% · recency 20%. Top-matched comps best support the ARV.
Projected returns pro-forma
3.83% appreciation · 3.0% rent growth · sell at horizon
- IRR
- 2.1%
- Equity multiple
- 1.13×
- Total profit
- $8,095
- Equity at exit
- $114,260
- IRR
- 5.4%
- Equity multiple
- 1.91×
- Total profit
- $58,481
- Equity at exit
- $185,069
Cash invested: $64,372 (down + closing). Projections, not guarantees.
Landlord ↔ Tenant lean methodology
- Overall (STATE)
- 62 Landlord-Friendly
- State Pennsylvania
- 62 Landlord-Friendly · EVEN
- County
- — inherits STATE
- City
- — inherits STATE
ZIP-level market 17752
- Home prices YoY
- 1.6%
- Active inventory
- 20
- Price-to-rent
- 13.7×
Monthly cashflow live
- Estimated rent
- $1,401 medium interval (Pro) →
- Mortgage (P&I)
- −$1,206
- Tax from tax record
- −$274 /mo · $3,290/yr
- Insurance
- −$96
- HOA
- −$0
- Vacancy / Maint / Mgmt
- −$294
- Net cashflow
- $-469
Break-even live
UW: 25.0% down · 7.5% · 30yr · 1.5% tax · 5.0% vac · 8.0% maint · 8.0% mgmt
Financing live
Cash to close
- Down payment
- $57,475
- Closing costs
- $6,897
- Reserves months
- —
- Total cash needed
- —
Loan-product check · same deal, 3 products live
Conventional
25% down · 7.5% · 30yr
- Down + closing
- —
- Monthly P&I
- —
- Monthly cashflow
- —
- DSCR
- —
- Eligible?
- —
Personal DTI + credit; lowest rate.
DSCR
20% down · 8.5% · 30yr
- Down + closing
- —
- Monthly P&I
- —
- Monthly cashflow
- —
- DSCR
- —
- Eligible?
- —
No personal income docs; deal must DSCR.
Hard money
10% down · 12.0% · 12mo
- Down + closing
- —
- Monthly P&I
- —
- Monthly cashflow
- —
- DSCR
- —
- Eligible?
- —
Short-term bridge; refi at stabilization.
Rent comps 3 comps
| Address | Beds | Baths | Sqft | Rent | $/sqft | DOM | Units | Dist |
|---|---|---|---|---|---|---|---|---|
| 69 Broad St Montgomery, PA | 3.0 | 1.5 | 1448 | $1,665 | $1.15 | 14d | 1 | 0.11mi |
| 56 Penn St Unit 58 Montgomery, PA | 3.0 | 1.0 | 1070 | $1,195 | $1.12 | 43d | 1 | 0.18mi |
| 25 N Main St Montgomery, PA | 2.0 | 1.0 | 1200 | $865 | $0.72 | 14d | 1 | 0.29mi |
Listing history 9 events
-
2026-05-13status Pending
-
2026-05-09$229,900 Active
-
2025-10-20price $215,000
-
2022-04-18soldstatus $170,000
-
2022-04-14soldstatus
-
2022-03-05$144,900
-
2020-10-01soldstatus $128,000
-
2018-03-08$139,900
-
2014-06-20soldstatus $132,900
ⓘ Source: listings_history table (triggers on properties + properties_extension) + one-shot
backfill from property_details.listing_events for pre-trigger history.
Tax reassessment forecast PA · Partial reset (capped growth)
- Current annual tax
- $3,290 · $274/mo
- Projected year-2 tax
- $3,461 · $288/mo
- Expected delta
- +$171/yr (+$14/mo · 5.2%)
ⓘ Screening estimate from a state-policy table — verify with the county assessor before closing.
Climate risk First Street
- Flood 1/10 Low FEMA zone X (unshaded) · 0% chance over 30 yrs
- Wildfire 1/10 Low
- Heat 4/10 Moderate 8 d/yr ≥97°F today · 17 d/yr by 30 yrs out
- Wind 2/10 Low 2% chance of damaging wind over 30 yrs
- Air quality 2/10 Low 1 unhealthy d/yr today · 1 by 30 yrs out
Nearby sold comps map
Loading sold comps map…
Walkable amenities ~0.75 mi
Loading nearby amenities…
Taxation est. · year 1
- Rental income
- $16,814
- − Mortgage interest
- −$12,878
- − Property taxes
- −$3,290
- − Insurance
- −$1,150
- − Repairs & maintenance
- −$1,345
- − Management
- −$1,345
- − Depreciation
- −$6,688
- Taxable loss
- −$9,881
- Est. tax savings @ 24.0%
- +$2,372
- After-tax cash flow
- $-3,252/yr
For passive investors: Depreciation is non-cash, so a rental often shows a tax loss while cash-flowing — sheltering income. Rental losses are passive: they offset passive income freely, and up to $25,000/yr can offset ordinary (W-2) income if you actively participate and your MAGI is under $100k (phasing out to $0 by $150k); unused losses carry forward. On sale, claimed depreciation is recaptured at up to 25%, and gains may owe capital-gains tax (a 1031 exchange can defer both). Figures are a year-1 estimate at your 24.0% rate — not tax advice; consult a CPA.
Schools (NCES district)
- District
- Montgomery Area SD
- NCES district ID
- 4215660
- Math proficiency
- 46% ▼ -16.00%
- Reading proficiency
- 54% ▼ -17.00%
- Median HH income
- $49,345
- Composite
- 42.69/100
- National rank
- #3172
- State rank
- #180 of 539 in PA
Livability — Montgomery
- Score
- 71/100
- State rank
- #727
- US rank
- #7279
Category grades
Schools grade is shown separately in the Schools card above.
Census & demographics
- Census place
- Montgomery, PA
- Population (ZIP)
- 4,867
Population outlook (Lycoming County) Hauer SSP2
- Today (2025)
- 114,164 people
- By 2030
- 112,221 · -1.7%
- By 2040
- 107,613 · -5.7%
- By 2050
- 102,950 · -9.8%
- By 2075
- 92,987 · -18.5%
- By 2100
- 80,924 · -29.1%
Race, ethnicity, and origin ACS 2023
- Neighborhood character
- Predominantly White (93%)
- Race & ethnicity
- White 93% Two or more races 5% Hispanic / Latino 2%
- Common ancestry
- Iranian 2% Romanian 2% Lithuanian 1%
- Foreign-born
- 1% · Vietnam
- Languages at home
- 93% English-only · German/W. Germanic 6% Spanish 1%
Political lean MEDSL · Lycoming
- 2024 margin
- Solid R (+41.5) · D 28.8% · R 70.3%
- 2008→2024 swing
- -17.3pp toward R · 2008: -24.2pp · 2024: -41.5pp
- All cycles
- 2024: R+41.5 2020: R+41.3 2016: R+44.8 2012: R+33.3 2008: R+24.2
Not yet ingested
- Civics
- —
Market trends
- HPI YoY
- ▲ 3.83%
- Current HPI
- 241.8799
- Rent YoY
- —
- Metro
- —
- State GDP YoY
- ▲ 1.68%
- F500 in state
- 34
Industry mix (Fortune 500 HQ in PA)
| Industry | F500 HQs | Revenue |
|---|---|---|
| Healthcare | 2 | $309B |
|
||
| Insurance | 2 | $27B |
|
||
| Telecommunications / Media | 1 | $124B |
|
||
| Industrial Distribution | 1 | $22B |
|
||
| Financial Services | 1 | $20B |
|
||
| Chemicals / Materials | 1 | $18B |
|
||
Price history
+73.0% since first listed9 events — show timeline
- 2026-05-13 Pending — WBVAR
- 2026-05-09 Listed $229,900 WBVAR
- 2025-10-20 Price Changed $215,000 WBVAR
- 2022-04-18 Sold (Public Records) $170,000 Public Records
- 2022-04-14 Sold (MLS) — WBVAR
- 2022-03-05 Listed $144,900 WBVAR
- 2020-10-01 Sold (Public Records) $128,000 Public Records
- 2018-03-08 Listed $139,900 CSVBR
- 2014-06-20 Sold (Public Records) $132,900 Public Records
Property tax history
+2.9%/yrLatest (2026): $3,290 · +4.1% YoY. Source: county tax records.
Cash-flow waterfall
monthlySold comps — $/sqft
last 12 mo · ≤1 miLoading sold comps…