F9 Bradley Cir Unit F9 · Hazardville, CT
Flood risk 1/10 · Minimal
- FEMA flood zone
- X (unshaded)
- Chance of flooding over 30 yrs
- 0.0%
- Est. flood insurance / yr
- $507 – $1,088
Fire risk 1/10 · Minimal
- Est. fire insurance / yr
- $829 – $1,539
Heat risk 4/10 · Minor
- Hot days now (above 98°F)
- 7 days/yr
- Hot days in 30 yrs
- 15 days/yr
Wind risk 6/10 · Moderate
- Chance of severe wind over 30 yrs
- 27.0%
Air-quality risk 3/10 · Minor
- Unhealthy air days now
- 2 days/yr
- Unhealthy air days in 30 yrs
- 3 days/yr
Risk factors via First Street. Map © Google.
Why this score? — see what drove the C- grade
The composite is a weighted blend of 9 inputs, each scored 0–100. Each bar is that input's sub-score; the figure is the points it added to the 100-point composite (weight × sub-score).
- Cash flow +17.9/30.0
- ARV discount +7.5/15.0
- 1% rule +6.7/10.0
- DSCR +5.6/10.0
- Condition / age +3.8/5.0
- Livability +3.6/5.0
- Rent growth +3.5/5.0
- Schools +3.0/10.0
- Appreciation +0.0/10.0
$175,000
🖨 Deal sheet 📄 Offer letter ✓ Due diligence
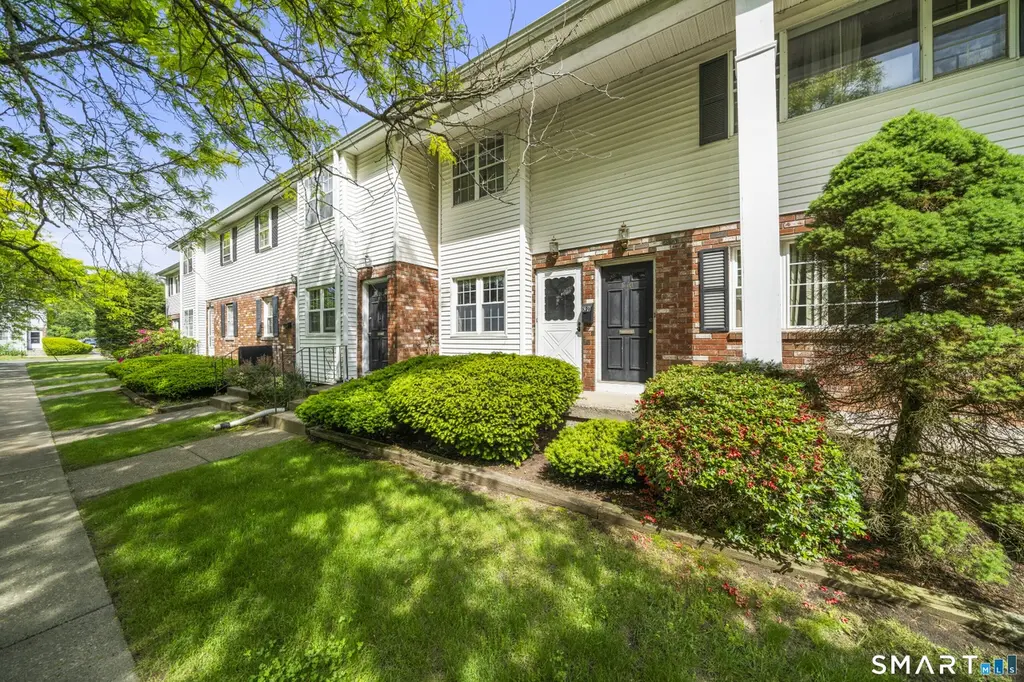
Listing remarks
Welcome to this ranch style condo with 2 bedrooms 2 baths, featuring a bright living room with sliding glass doors that open to private fenced in patio area perfect for relaxing and entertaining. The eat in kitchen offers plenty of space with good countertop space and plenty of cabinets. Primary bedroom with full bath and an additional bedroom with full bath in hallway. Downstairs there is a full basement with laundry area and a finished room and plenty of storage. Enjoy summer days at the community swimming pool, which just opened for the season and is ready for the months ahead. Multiple offers best and final by 6/2/26 12pm.
Key facts
- Eat in kitchen
- Full basement
- Ranch style condo
Tags
Property features AI
Finance
- Other: Complex contains 154 units; Nearby amenities: golf course, health club, library, park
- HOA & community: Monthly HOA fee of $266; HOA covers grounds maintenance, trash pickup, snow removal, heat, and water; Community amenities include a pool; Professional off-site property management; Pets allowed (cats allowed; dogs by permission)
Exterior
- Utilities: Public water; Public sewer; Storm doors; Thermopane windows
- Home design: Condominium (Condo/Co-Op); Unit on first floor of the building; Part of Georgetown at Enfield community
- Construction: Frame construction
- Exterior features: Vinyl siding; Porch; Patio; Lightly wooded, level lot; In-ground swimming pool (community)
Interior
- Kitchen: Oven/Range; Refrigerator; Dishwasher
- Bedrooms: 2 bedrooms (unit spans 2 levels)
- Bathrooms: 2 full bathrooms
- Heating & cooling: Central air; Hot air heat fueled by natural gas; Natural gas domestic hot water
- Interior features: Cable available; Full, partially finished basement
- Laundry & utility: Washer and dryer in lower level
Neighborhood map
What this means for you Summary
Snapshot
- This is a 2-bed/2.0-bath condo listed at $175k. Condition is rated good.
Deal economics
- At list price, monthly cash flow is $146 ($2k/yr) — positive.
- The deal already cash-flows at list — no discount required.
- Meets the 1% rule at list price ($2k rent vs $175k).
- Cap rate 7.3% vs local median 3.7% in Hazardville — top-decile yield for the area; either an underpriced asset or a hidden risk that comps aren't pricing in. Stress-test before assuming the spread holds.
Location & tenants
- Location reads 72/100 on livability (#82 in CT) — a middle-class / working-renter tenant base. Strengths: employment A+, housing A+, crime A; Watch: amenities F, commute F.
- Enfield School District (suburban): math 25% / reading 41% proficiency, ranked #114 of 153 in CT (top 74%) — families likely to look elsewhere, expect single-tenant / working-renter base with shorter leases.
- Zoned schools: Enfield High School (math 29% / reading 54%, grade F, #102 of 194 statewide, top 53%, 1,490 students, 40% FRL).
- Market conditions: Rents rising (+3.9%/yr); 182 active listings in the ZIP; 3 comparable units currently listed for rent nearby; rentals lingering (median 44d on market — plan ~5-8 weeks vacancy on turnover, expect pricing pressure); 67% of comp listings sitting > 30 days — soft ceiling on asking rent; solid renter incomes; 1,867 units permitted in Capitol Planning Region in 2024 (1,399 in 5+ unit buildings).
Forward outlook
- Local home prices are declining (-3.0%/yr); year-one equity from $1k of loan paydown is wiped out by about $5k of value loss. Plan a longer hold.
Negotiation context
- Only 5 days on market — expect competitive offers; lowballing is unlikely to land.
Risks & watch-outs
- Climate carrying-cost: major wind risk, 27% chance of damaging wind over 30y — expect insurance premiums to compound above CPI over the hold.
Questions for the listing agent
- Built in 1969 — when were the roof, HVAC, electrical panel, plumbing, and water heater last replaced?
- What does the HOA fee cover, when was the last increase, and are there any pending special assessments or reserve-fund shortfalls?
- Any open or pending special assessments — roof, HVAC, plumbing, elevator, façade? What's the per-unit balance and payoff schedule, and is the seller paying it off at close or rolling it to the buyer?
- Is there a deadline driving the sale (1031 exchange, divorce, estate, relocation)? That informs how much negotiation room exists.
- What's the average days-on-market for RENTAL listings here right now (not sales)? A rising rental-DOM trend means longer vacancies and softer asking-rent achievability than the comps imply.
- What's the recent tenant-quality profile in this submarket — average credit score on applications, eviction rate, late-payment / NSF rate, and stable-employment percentage? A property-management company in the area should have these aggregated.
- How much new apartment / multifamily construction is in the pipeline within 1–3 miles? Heavy new supply (>2% of stock underway) typically softens rents 12–24 months out; light construction supports rent growth.
Investment metrics
- 1% rule
- 1.17% ✓
- Cap rate
- 7.29%
- Cash-on-cash
- 3.58%
- DSCR
- 1.16
- GRM
- 7.1
CMA / ARV
No comps found within radius.
Projected returns pro-forma
-3.0% appreciation · 3.9% rent growth · sell at horizon
- IRR
- -9.4%
- Equity multiple
- 0.65×
- Total profit
- $-16,985
- Equity at exit
- $26,093
- IRR
- 1.6%
- Equity multiple
- 1.12×
- Total profit
- $5,816
- Equity at exit
- $15,131
Cash invested: $49,000 (down + closing). Projections, not guarantees.
Landlord ↔ Tenant lean methodology
- Overall (STATE)
- 27 Tenant-Leaning
- State Connecticut
- 27 Tenant-Leaning · D+7
- County
- — inherits STATE
- City
- — inherits STATE
ZIP-level market 06082
- Rents YoY
- 3.9%
- Active inventory
- 182
- Price-to-rent
- 7.1×
Monthly cashflow live
- Estimated rent
- $2,052 medium interval (Pro) →
- Mortgage (P&I)
- −$918
- Tax est. 1.5%
- −$219 /mo · $2,625/yr
- Insurance
- −$73
- HOA
- −$266
- Vacancy / Maint / Mgmt
- −$431
- Net cashflow
- $146
Break-even live
UW: 25.0% down · 7.5% · 30yr · 1.5% tax · 5.0% vac · 8.0% maint · 8.0% mgmt
Financing live
Cash to close
- Down payment
- $43,750
- Closing costs
- $5,250
- Reserves months
- —
- Total cash needed
- —
Loan-product check · same deal, 3 products live
Conventional
25% down · 7.5% · 30yr
- Down + closing
- —
- Monthly P&I
- —
- Monthly cashflow
- —
- DSCR
- —
- Eligible?
- —
Personal DTI + credit; lowest rate.
DSCR
20% down · 8.5% · 30yr
- Down + closing
- —
- Monthly P&I
- —
- Monthly cashflow
- —
- DSCR
- —
- Eligible?
- —
No personal income docs; deal must DSCR.
Hard money
10% down · 12.0% · 12mo
- Down + closing
- —
- Monthly P&I
- —
- Monthly cashflow
- —
- DSCR
- —
- Eligible?
- —
Short-term bridge; refi at stabilization.
Rent comps 3 comps
| Address | Beds | Baths | Sqft | Rent | $/sqft | DOM | Units | Dist |
|---|---|---|---|---|---|---|---|---|
| 168 Fox Hill Ln Enfield, CT | 1.0 | 1.0 | 720 | $1,995 | $2.77 | 1d | 1 | 0.16mi |
| 44 Saint James Ave Enfield, CT | 3.0 | 2.0 | 1500 | $2,700 | $1.80 | 43d | 1 | 0.82mi |
| 22 Ohear Ave Enfield, CT | 3.0 | 2.0 | 1148 | $2,000 | $1.74 | 43d | 1 | 1.26mi |
HOA detail condo
- Monthly dues
- $266 · $3,192/yr
- Likely covers
- pool
- Assessments
- None detected in remarks — confirm with the listing agent.
Listing history 7 events
-
2026-06-03status $175,000 Under Contract 5 DOM
-
2026-06-02days on market $175,000 Active 5 DOM
-
2026-06-01days on market $175,000 Active 4 DOM
-
2026-06-01remarks 634-char remark
-
2026-05-31days on market $175,000 Active 3 DOM
-
2026-05-29price $175,000
-
2026-05-28$75,000 Active
ⓘ Source: listings_history table (triggers on properties + properties_extension) + one-shot
backfill from property_details.listing_events for pre-trigger history.
Climate risk First Street
- Flood 1/10 Low FEMA zone X (unshaded) · 0% chance over 30 yrs
- Wildfire 1/10 Low
- Heat 4/10 Moderate 7 d/yr ≥98°F today · 15 d/yr by 30 yrs out
- Wind 6/10 Major 27% chance of damaging wind over 30 yrs
- Air quality 3/10 Moderate 2 unhealthy d/yr today · 3 by 30 yrs out
Nearby sold comps map
Loading sold comps map…
Walkable amenities ~0.75 mi
Loading nearby amenities…
Taxation est. · year 1
- Rental income
- $24,630
- − Mortgage interest
- −$9,803
- − Property taxes
- −$2,625
- − Insurance
- −$875
- − Repairs & maintenance
- −$1,970
- − Management
- −$1,970
- − HOA
- −$3,192
- − Depreciation
- −$5,091
- Taxable loss
- −$897
- Est. tax savings @ 24.0%
- +$215
- After-tax cash flow
- $1,968/yr
For passive investors: Depreciation is non-cash, so a rental often shows a tax loss while cash-flowing — sheltering income. Rental losses are passive: they offset passive income freely, and up to $25,000/yr can offset ordinary (W-2) income if you actively participate and your MAGI is under $100k (phasing out to $0 by $150k); unused losses carry forward. On sale, claimed depreciation is recaptured at up to 25%, and gains may owe capital-gains tax (a 1031 exchange can defer both). Figures are a year-1 estimate at your 24.0% rate — not tax advice; consult a CPA.
Condition & rehab AI · 12 photos
This well-maintained condo is in good condition with a good condition score of 75. It has a good exterior, good interior walls and paint, and good flooring. The kitchen and bathrooms need some updates to increase their value. The home is move-in ready and has a good curb appeal.
Value-add opportunities
- Both painting the kitchen cabinets — Fresh paint can make the kitchen look more modern and appealing
- Both upgrading the kitchen appliances — Modern appliances can increase the home's appeal and value
- Both landscaping improvements — A well-maintained yard can enhance curb appeal and property value
Renovation cost estimate screening
Value-add ROI direction
- Both painting the kitchen cabinets — Fresh paint can make the kitchen look more modern and appealing ↑
- Both upgrading the kitchen appliances — Modern appliances can increase the home's appeal and value ↑
- Both landscaping improvements — A well-maintained yard can enhance curb appeal and property value ↑
ⓘ Cost ranges are severity-bucket heuristics (US national rule-of-thumb). Get contractor quotes + a written scope before underwriting a rehab budget.
Schools (NCES district)
- District
- Enfield School District
- NCES district ID
- 0901470
- Math proficiency
- 25% ▼ -14.00%
- Reading proficiency
- 41% ▼ -10.00%
- Median HH income
- $68,750
- Composite
- 30.42/100
- National rank
- #6238
- State rank
- #114 of 153 in CT
Livability — Hazardville
- Score
- 72/100
- State rank
- #82
- US rank
- #6039
Category grades
Schools grade is shown separately in the Schools card above.
Census & demographics
- Census place
- Hazardville, CT
- County
- Hartford County · 754,208 people
- City population
- 41,100
- Metro
- Hartford-East Hartford-Middletown, CT
- Population (ZIP)
- 41,090
- Household income
- $90,404
- Rent vs Own
- Severe rent burden
- 954.0
Population outlook (Capitol County) Hauer SSP2
- By 2040
- 1,063,519
Race, ethnicity, and origin ACS 2023
- Neighborhood character
- Predominantly White (76%)
- Race & ethnicity
- White 76% Hispanic / Latino 11% Two or more races 9% Black 5% Asian 2%
- Hispanic origin (detail)
- Mexican 1% Puerto Rican 7%
- Common ancestry
- Romanian 10% Lithuanian 9% Slovak 2%
- Foreign-born
- 6% · Canada, Jamaica
- Languages at home
- 89% English-only · Spanish 5% Other Indo-European 2% Russian/Polish/Slavic 1%
Political lean MEDSL · Capitol
- 2024 margin
- Strong D (+21.9) · D 60.1% · R 38.2% · Other 1.7%
- All cycles
- 2024: D+21.9
Not yet ingested
- Civics
- —
Market trends
- HPI YoY
- ▼ -494.72%
- Current HPI
- 192.4011
- Rent YoY
- ▲ 3.90%
- Metro
- Hartford-East Hartford-Middletown, CT
- State GDP YoY
- ▲ 1.06%
- F500 in state
- 38
Industry mix (Fortune 500 HQ in CT)
| Industry | F500 HQs | Revenue |
|---|---|---|
| Industrial Machinery | 4 | $38B |
|
||
| Insurance | 3 | $71B |
|
||
| Financial Services | 2 | $25B |
|
||
| Transportation / Logistics | 2 | $18B |
|
||
| Healthcare | 1 | $247B |
|
||
| Telecommunications | 1 | $55B |
|
||
Price history
+133.3% since first listed2 events — show timeline
- 2026-05-29 Price Changed $175,000 Smart MLS
- 2026-05-28 Listed $75,000 Smart MLS
Cash-flow waterfall
monthlySold comps — $/sqft
last 12 mo · ≤1 miLoading sold comps…