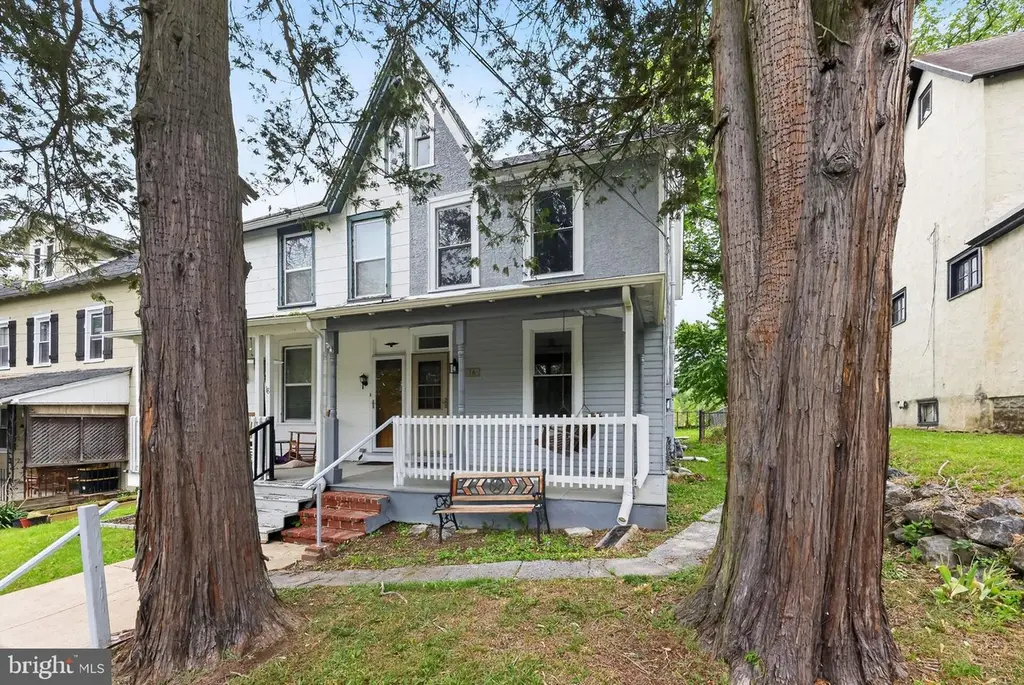
16 Convent Rd · Chester Heights, PA
Flood risk 1/10 · Minimal
- FEMA flood zone
- X (unshaded)
- Chance of flooding over 30 yrs
- 0.0%
- Est. flood insurance / yr
- $473 – $860
Fire risk 1/10 · Minimal
- Est. fire insurance / yr
- $511 – $949
Heat risk 7/10 · Major
- Hot days now (above 103°F)
- 7 days/yr
- Hot days in 30 yrs
- 16 days/yr
Wind risk 6/10 · Moderate
- Chance of severe wind over 30 yrs
- 27.0%
Air-quality risk 3/10 · Minor
- Unhealthy air days now
- 2 days/yr
- Unhealthy air days in 30 yrs
- 4 days/yr
Risk factors via First Street. Map © Google.
Why this score? — see what drove the C- grade
The composite is a weighted blend of 9 inputs, each scored 0–100. Each bar is that input's sub-score; the figure is the points it added to the 100-point composite (weight × sub-score).
- Cash flow +19.6/30.0
- ARV discount +9.1/15.0
- DSCR +6.2/10.0
- Schools +4.3/10.0
- 1% rule +4.0/10.0
- Livability +3.4/5.0
- Rent growth +2.5/5.0
- Condition / age +2.5/5.0
- Appreciation +0.0/10.0
$254,900
🖨 Deal sheet 📄 Offer letter ✓ Due diligence
Listing remarks
Welcome to 16 Convent Rd in Aston — a charming and thoughtfully updated home offering comfort, convenience, and plenty of functional living space. Featuring brand new flooring throughout and a newly finished third floor, this home provides flexible space such as bedroom, office, playroom, or bonus area. The main level offers the ease of first-floor laundry, an inviting eat-in kitchen, and a comfortable layout designed for everyday living. Step outside to enjoy the fenced-in backyard, ideal for entertaining, pets, or relaxing evenings at home. The property also includes two-car driveway parking conveniently located in the rear of the home, right next to the walking trail for easy outd
Key facts
- New flooring
- Fenced-in backyard
- First-floor laundry
Tags
Property features AI
Finance
- Other: Fee simple ownership
Exterior
- Utilities: Public water; Public sewer
- Home design: Semi-detached home
- Construction: Shingle siding; Asbestos siding; Other foundation
- Exterior features: Shed; Lot approximately 25 x 122
Interior
- Kitchen: Kitchen
- Bedrooms: Two bedrooms on the first upper level; One bedroom on the second upper level; Master bedroom
- Bathrooms: One full bathroom (total)
- Heating & cooling: Hot water heating; Oil-fired heating; Electric hot water
- Interior features: Full basement; Living room; Dining room
- Laundry & utility: Laundry hookups
Neighborhood map
What this means for you Summary
Snapshot
- This is a 2-bed/1.0-bath townhouse listed at $255k.
Deal economics
- At list price, monthly cash flow is $294 ($4k/yr) — positive.
- The deal already cash-flows at list — no discount required.
- To meet the 1% rule (rent ≥ 1% of price), the offer needs to be $231k (9.5% below list).
- Recommended offer: $231k (9.5% below list) — sets the bar for 1% rule.
- Cap rate 7.7% vs local median 2.6% in Chester Heights — top-decile yield for the area; either an underpriced asset or a hidden risk that comps aren't pricing in. Stress-test before assuming the spread holds.
Location & tenants
- Location reads 67/100 on livability (#994 in PA) — a middle-class / working-renter tenant base. Strengths: crime A+, employment A+, housing A+; Watch: schools C-, amenities F, commute F.
- Penn-Delco SD (suburban): math 37% / reading 59% proficiency, ranked #174 of 539 in PA (top 32%) — families likely to look elsewhere, expect single-tenant / working-renter base with shorter leases; only 16% free/reduced lunch — higher-income household profile.
- Market conditions: 71 active listings in the ZIP; 6 comparable units currently listed for rent nearby; rentals lingering (median 44d on market — plan ~5-8 weeks vacancy on turnover, expect pricing pressure); 50% of comp listings sitting > 30 days — soft ceiling on asking rent; solid renter incomes; 299 units permitted in Delaware County in 2024 (5 in 5+ unit buildings).
Forward outlook
- Local home prices are declining (-3.0%/yr); year-one equity from $2k of loan paydown is wiped out by about $8k of value loss. Plan a longer hold.
Negotiation context
- It's been on market 41 days — a 3% lower offer ($247k) is reasonable based on typical stale-listing flexibility.
- 6 sale attempts since 32y ago with the ask held roughly flat each time — persistent listings suggest the price (not the market) is what's stuck; bring a comps-based counter.
- Current owner paid $96k; list at $255k implies a 166% gain — meaningful room to come down on a strong offer.
Risks & watch-outs
- Watch-outs: built in 1900 — expect roof / HVAC / electrical / plumbing capex.
- Climate carrying-cost: major wind risk, 27% chance of damaging wind over 30y; extreme-heat days projected 7→16/yr by 2055 (HVAC capex compounding) — expect insurance premiums to compound above CPI over the hold.
Questions for the listing agent
- It's been on market 41 days. Have you received any prior offers? Is the seller open to a 10% concession, seller financing, or rate buy-down credit?
- Built in 1900 — when were the roof, HVAC, electrical panel, plumbing, and water heater last replaced?
- Is there a deadline driving the sale (1031 exchange, divorce, estate, relocation)? That informs how much negotiation room exists.
- What's the average days-on-market for RENTAL listings here right now (not sales)? A rising rental-DOM trend means longer vacancies and softer asking-rent achievability than the comps imply.
- What's the recent tenant-quality profile in this submarket — average credit score on applications, eviction rate, late-payment / NSF rate, and stable-employment percentage? A property-management company in the area should have these aggregated.
- How much new for-sale + rental construction is in the pipeline within 1–3 miles? Heavy new supply typically softens prices + rents 12–24 months out; constrained supply supports both.
Investment metrics
- 1% rule
- 0.90% ✗
- Cap rate
- 7.68%
- Cash-on-cash
- 4.94%
- DSCR
- 1.22
- GRM
- 9.2
CMA / ARV
- ARV (median comp)
- $264,096
- List price
- $254,900
- Delta
- -3.48%
- Verdict
- FAIR
- Comps
- 20 within 1.0 mi
Show comp detail 9 sales within ~0.75 mi
| Address | Dist | Beds/Ba | Sqft | Sold | Price | $/sf | Match |
|---|---|---|---|---|---|---|---|
| 16 New Rd | 0.17mi | 3/1.5 (+1) | 1,358 (+3%) | 11mo | $185,000 | $136 | 71 |
| 18 New Rd | 0.17mi | 3/1.0 (+1) | 1,178 (-11%) | 12mo | $230,000 | $195 | 59 |
| 440 Derry Dr #440 | 0.66mi | 2/2.0 | 1,434 (+8%) | 6mo | $270,000 | $188 | 46 |
| 374 Derry Dr #374 | 0.62mi | 2/2.0 | 1,434 (+8%) | 13mo | $279,000 | $195 | 42 |
| 129 Knollwood Ct | 0.72mi | 2/2.5 | 1,415 (+7%) | 8mo | $380,000 | $269 | 42 |
| 408 Derry Dr #408 | 0.70mi | 2/2.0 | 1,406 (+6%) | 18mo | $269,900 | $192 | 38 |
| 366 Cashel Ct #366 | 0.60mi | 2/2.0 | 1,184 (-10%) | 18mo | $250,000 | $211 | 36 |
| 161 Nottingham Ct | 0.67mi | 3/2.5 (+1) | 1,400 (+6%) | 20mo | $350,000 | $250 | 32 |
| 162 Nottingham Ct | 0.66mi | 3/2.5 (+1) | 1,504 (+14%) | 12mo | $348,000 | $231 | 25 |
Match score weights: distance 35% · size 25% · config 20% · recency 20%. Top-matched comps best support the ARV.
Projected returns pro-forma
-3.0% appreciation · 3.0% rent growth · sell at horizon
- IRR
- -8.7%
- Equity multiple
- 0.68×
- Total profit
- $-22,688
- Equity at exit
- $38,006
- IRR
- 0.8%
- Equity multiple
- 1.05×
- Total profit
- $3,913
- Equity at exit
- $22,039
Cash invested: $71,372 (down + closing). Projections, not guarantees.
Landlord ↔ Tenant lean methodology
- Overall (STATE)
- 62 Landlord-Friendly
- State Pennsylvania
- 62 Landlord-Friendly · EVEN
- County
- — inherits STATE
- City
- — inherits STATE
ZIP-level market 19014
- Active inventory
- 71
- Price-to-rent
- 9.2×
Monthly cashflow live
- Estimated rent
- $2,306 high interval (Pro) →
- Mortgage (P&I)
- −$1,337
- Tax from tax record
- −$85 /mo · $1,018/yr
- Insurance
- −$106
- HOA
- −$0
- Vacancy / Maint / Mgmt
- −$484
- Net cashflow
- $294
Break-even live
UW: 25.0% down · 7.5% · 30yr · 1.5% tax · 5.0% vac · 8.0% maint · 8.0% mgmt
Financing live
Cash to close
- Down payment
- $63,725
- Closing costs
- $7,647
- Reserves months
- —
- Total cash needed
- —
Loan-product check · same deal, 3 products live
Conventional
25% down · 7.5% · 30yr
- Down + closing
- —
- Monthly P&I
- —
- Monthly cashflow
- —
- DSCR
- —
- Eligible?
- —
Personal DTI + credit; lowest rate.
DSCR
20% down · 8.5% · 30yr
- Down + closing
- —
- Monthly P&I
- —
- Monthly cashflow
- —
- DSCR
- —
- Eligible?
- —
No personal income docs; deal must DSCR.
Hard money
10% down · 12.0% · 12mo
- Down + closing
- —
- Monthly P&I
- —
- Monthly cashflow
- —
- DSCR
- —
- Eligible?
- —
Short-term bridge; refi at stabilization.
Rent comps 6 comps
| Address | Beds | Baths | Sqft | Rent | $/sqft | DOM | Units | Dist |
|---|---|---|---|---|---|---|---|---|
| 275 Glen Riddle Rd Apt I31 Media, PA | 2.0 | 2.0 | 999 | $2,350 | $2.35 | 43d | 1 | 0.52mi |
| 274 Glen Riddle Rd Unit C203 Media, PA | 2.0 | 1.0 | 880 | $2,160 | $2.45 | 43d | 1 | 0.55mi |
| 117 Woodcrest Ave Aston, PA | 3.0 | 2.0 | 1536 | $2,750 | $1.79 | 19d | 1 | 0.89mi |
| 25 Abel Pl Media, PA | 2.0 | 1.5 | 1331 | $3,200 | $2.40 | 2d | 1 | 1.11mi |
| 4040 Concord Rd Aston Township, PA | 3.0 | 1.0 | 1200 | $2,200 | $1.83 | 1d | 1 | 1.36mi |
| 317 Mount Alverno Rd Media, PA | 2.0 | 1.0 | 1000 | $1,750 | $1.75 | 43d | 1 | 1.41mi |
Listing history 30 events
-
2026-06-18days on market $254,900 Active 41 DOM
-
2026-06-17days on market $254,900 Active 40 DOM
-
2026-06-16days on market $254,900 Active 39 DOM
-
2026-06-15days on market $254,900 Active 38 DOM
-
2026-06-13days on market $254,900 Active 36 DOM
-
2026-06-13days on market $254,900 Active 35 DOM
-
2026-06-09days on market $254,900 Active 32 DOM
-
2026-06-08days on market $254,900 Active 31 DOM
-
2026-06-07days on market $254,900 Active 30 DOM
-
2026-06-04days on market $254,900 Active 27 DOM
-
2026-06-03days on market $254,900 Active 26 DOM
-
2026-06-02days on market $254,900 Active 25 DOM
-
2026-06-01pricedays on market $254,900 Active 24 DOM
-
2026-05-31days on market $259,900 Active 23 DOM
-
2026-05-08$259,900 Active 915-char remark
-
2009-12-30historical
-
2009-03-06$60,000
-
2008-08-14historical
-
2008-04-10historical
-
2008-04-09$149,900
-
2007-07-25$159,900
-
2003-04-22soldstatus $96,000
-
2003-04-17soldstatus $96,000
-
2003-03-03historical
-
2003-02-05$96,000
-
1994-09-08soldstatus $72,500
-
1994-08-26soldstatus $72,500
-
1994-07-06historical
-
1994-03-17$72,500
-
1986-06-16soldstatus $46,900
ⓘ Source: listings_history table (triggers on properties + properties_extension) + one-shot
backfill from property_details.listing_events for pre-trigger history.
Tax reassessment forecast PA · Partial reset (capped growth)
- Current annual tax
- $1,018 · $85/mo
- Projected year-2 tax
- $2,523 · $210/mo
- Expected delta
- +$1,505/yr (+$125/mo · 147.9%)
ⓘ Screening estimate from a state-policy table — verify with the county assessor before closing.
Climate risk First Street
- Flood 1/10 Low FEMA zone X (unshaded) · 0% chance over 30 yrs
- Wildfire 1/10 Low
- Heat 7/10 Severe 7 d/yr ≥103°F today · 16 d/yr by 30 yrs out
- Wind 6/10 Major 27% chance of damaging wind over 30 yrs
- Air quality 3/10 Moderate 2 unhealthy d/yr today · 4 by 30 yrs out
Nearby sold comps map
Loading sold comps map…
Walkable amenities ~0.75 mi
Loading nearby amenities…
Taxation est. · year 1
- Rental income
- $27,672
- − Mortgage interest
- −$14,278
- − Property taxes
- −$1,018
- − Insurance
- −$1,274
- − Repairs & maintenance
- −$2,214
- − Management
- −$2,214
- − Depreciation
- −$7,415
- Taxable loss
- −$741
- Est. tax savings @ 24.0%
- +$178
- After-tax cash flow
- $3,706/yr
For passive investors: Depreciation is non-cash, so a rental often shows a tax loss while cash-flowing — sheltering income. Rental losses are passive: they offset passive income freely, and up to $25,000/yr can offset ordinary (W-2) income if you actively participate and your MAGI is under $100k (phasing out to $0 by $150k); unused losses carry forward. On sale, claimed depreciation is recaptured at up to 25%, and gains may owe capital-gains tax (a 1031 exchange can defer both). Figures are a year-1 estimate at your 24.0% rate — not tax advice; consult a CPA.
Schools (NCES district)
- District
- Penn-Delco SD
- NCES district ID
- 4218580
- Math proficiency
- 37% ▼ -18.00%
- Reading proficiency
- 59% ▼ -13.00%
- Median HH income
- $71,673
- Composite
- 43.11/100
- National rank
- #3083
- State rank
- #174 of 539 in PA
Livability — Chester Heights
- Score
- 67/100
- State rank
- #994
- US rank
- #10966
Category grades
Schools grade is shown separately in the Schools card above.
Census & demographics
- County
- Delaware County · 399,863 people
- City population
- 297
- Metro
- Philadelphia-Camden-Wilmington, PA-NJ-DE-MD
- Population (ZIP)
- 21,427
- Household income
- $96,781
- Rent vs Own
- Severe rent burden
- 276.0
Population outlook (Delaware County) Hauer SSP2
- Today (2025)
- 577,490 people
- By 2030
- 581,243 · +0.6%
- By 2040
- 584,700 · +1.2%
- By 2050
- 586,581 · +1.6%
- By 2075
- 598,706 · +3.7%
- By 2100
- 590,823 · +2.3%
Race, ethnicity, and origin ACS 2023
- Neighborhood character
- Predominantly White (86%)
- Race & ethnicity
- White 86% Black 9% Two or more races 2% Asian 2% Hispanic / Latino 2%
- Common ancestry
- Romanian 9% Italian 2% Iranian 1%
- Foreign-born
- 4% · South Korea, Canada
- Languages at home
- 95% English-only · Russian/Polish/Slavic 1% Other Indo-European 1% Spanish 1%
Political lean MEDSL · Delaware
- 2024 margin
- Strong D (+23.7) · D 61.4% · R 37.6% · Other 1.0%
- 2008→2024 swing
- +2.3pp toward D · 2008: 21.4pp · 2024: 23.7pp
- All cycles
- 2024: D+23.7 2020: D+26.7 2016: D+22.0 2012: D+21.8 2008: D+21.4
Not yet ingested
- Civics
- —
Market trends
- HPI YoY
- ▼ -260.34%
- Current HPI
- 262.8409
- Rent YoY
- —
- Metro
- Philadelphia-Camden-Wilmington, PA-NJ-DE-MD
- State GDP YoY
- ▲ 1.68%
- F500 in state
- 34
Industry mix (Fortune 500 HQ in PA)
| Industry | F500 HQs | Revenue |
|---|---|---|
| Healthcare | 2 | $309B |
|
||
| Insurance | 2 | $27B |
|
||
| Telecommunications / Media | 1 | $124B |
|
||
| Industrial Distribution | 1 | $22B |
|
||
| Financial Services | 1 | $20B |
|
||
| Chemicals / Materials | 1 | $18B |
|
||
Price history
+443.5% since first listed17 events — show timeline
- 2026-06-01 Price Changed $254,900 BRIGHT MLS
- 2026-05-08 Listed $259,900 BRIGHT MLS
- 2009-12-30 Listing Removed — BRIGHT MLS
- 2009-03-06 Listed $60,000 BRIGHT MLS
- 2008-08-14 Listing Removed — BRIGHT MLS
- 2008-04-10 Listing Removed — BRIGHT MLS
- 2008-04-09 Listed $149,900 BRIGHT MLS
- 2007-07-25 Listed $159,900 BRIGHT MLS
- 2003-04-22 Sold (Public Records) $96,000 Public Records
- 2003-04-17 Sold (MLS) $96,000 BRIGHT MLS
- 2003-03-03 Listing Removed — BRIGHT MLS
- 2003-02-05 Listed $96,000 BRIGHT MLS
- 1994-09-08 Sold (Public Records) $72,500 Public Records
- 1994-08-26 Sold (MLS) $72,500 BRIGHT MLS
- 1994-07-06 Listing Removed — BRIGHT MLS
- 1994-03-17 Listed $72,500 BRIGHT MLS
- 1986-06-16 Sold (Public Records) $46,900 Public Records
Property tax history
-5.6%/yrLatest (2026): $1,018 · -76.1% YoY. Source: county tax records.
Cash-flow waterfall
monthlySold comps — $/sqft
last 12 mo · ≤1 miLoading sold comps…