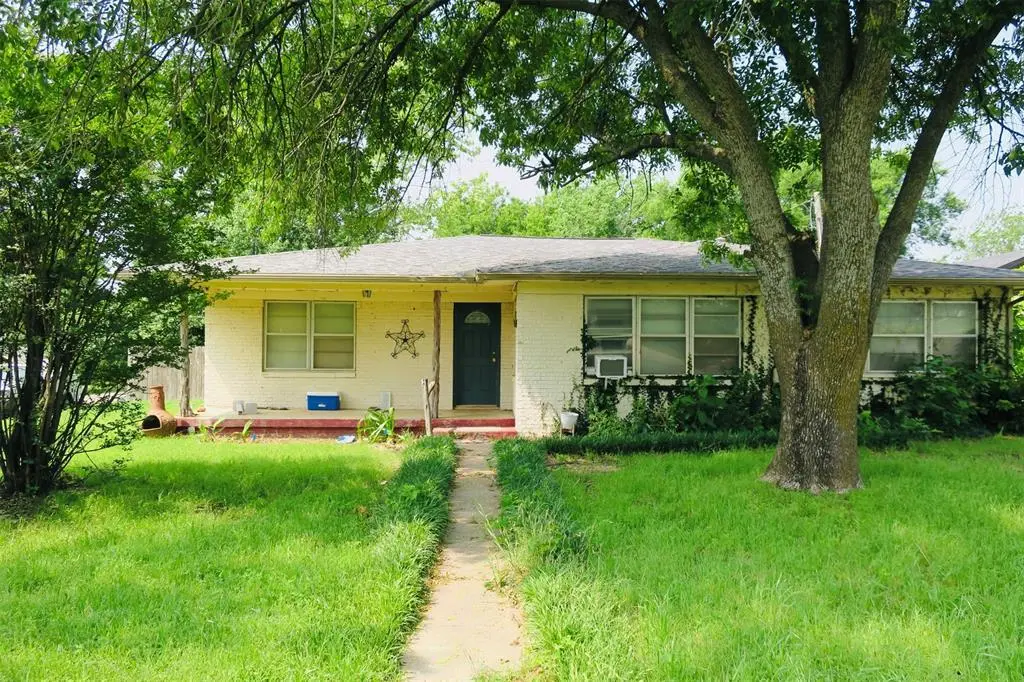
1689 N Highway 81 N · Bowie, TX
Flood risk 1/10 · Minimal
- FEMA flood zone
- X (unshaded)
- Chance of flooding over 30 yrs
- 0.0%
- Est. flood insurance / yr
- $507 – $1,088
Fire risk 7/10 · Major
- Est. fire insurance / yr
- $1,222 – $2,270
Heat risk 6/10 · Moderate
- Hot days now (above 108°F)
- 7 days/yr
- Hot days in 30 yrs
- 20 days/yr
Wind risk 4/10 · Minor
- Chance of severe wind over 30 yrs
- 13.0%
Air-quality risk 1/10 · Minimal
- Unhealthy air days now
- 0 days/yr
- Unhealthy air days in 30 yrs
- 0 days/yr
Risk factors via First Street. Map © Google.
Why this score? — see what drove the B- grade
The composite is a weighted blend of 9 inputs, each scored 0–100. Each bar is that input's sub-score; the figure is the points it added to the 100-point composite (weight × sub-score).
- Cash flow +29.2/30.0
- DSCR +10.0/10.0
- 1% rule +7.9/10.0
- ARV discount +7.5/15.0
- Schools +3.2/10.0
- Livability +3.2/5.0
- Rent growth +2.5/5.0
- Condition / age +2.5/5.0
- Appreciation +0.0/10.0
$105,000
🖨 Deal sheet 📄 Offer letter ✓ Due diligence
Listing remarks
* * Investor opportunity. Situated on a spacious corner lot just outside city limits, this traditional brick home offers the perfect blend of convenience and opportunity. The property features a carport, additional storage and shop space, and a large fenced backyard. Inside, some areas have already been renovated, while others are ready for your personal touch. This home is being sold as-is and will need updates and repairs, making it a great prospect for buyers looking to customize, restore, and build equity. With solid bones and great potential, this property is perfect for those ready to make it their own.
Key facts
- 7,362 sq ft lot
- Parking
- Built 1955
Property features AI
Finance
- Other: Possession at closing/funding; Standard special listing conditions; Transaction type: For Sale
- Financial info: Listing terms include Cash and Conventional; Treat as clear loan type; No second mortgage reported
- HOA & community: No association
Exterior
- Parking: Detached carport; 1 covered parking space; 1 carport space; Additional parking and storage
- Security: No surveillance devices reported
- Utilities: City water; City sewer; Co-op electric; Outside city limits
- Home design: Single family residence; Residential property; Attached: Yes; Built in 1955
- Construction: Brick construction; Shingle roof; Pillar/post/pier foundation
- Exterior features: Front porch; Back yard with chain link and wood fencing; Corner lot
Interior
- Kitchen: Dishwasher; Kitchen on the main level
- Bedrooms: 3 bedrooms (all on the main level); Primary bedroom on the main level
- Flooring: Carpet; Linoleum
- Bathrooms: 1 full bathroom
- Heating & cooling: Central heating; Window unit(s) for cooling
- Interior features: 6 total rooms; One-level layout; Other interior features
- Laundry & utility: No specific laundry appliances listed
Neighborhood map
What this means for you Summary
Snapshot
- This is a 3-bed/1.0-bath single-family listed at $105k.
Deal economics
- At list price, monthly cash flow is $366 ($4k/yr) — positive.
- The deal already cash-flows at list — no discount required.
- Meets the 1% rule at list price ($1k rent vs $105k).
- Recommended offer: $102k (3.0% below list) — sets the bar for market timing.
- Cap rate 10.5% vs local median 3.1% in Bowie — top-decile yield for the area; either an underpriced asset or a hidden risk that comps aren't pricing in. Stress-test before assuming the spread holds.
Location & tenants
- Location reads 64/100 on livability (#796 in TX) — a middle-class / working-renter tenant base. Strengths: cost of living A+, housing A+; Watch: health & safety C-, amenities F, commute F.
- Bowie ISD (town): math 34% / reading 41% proficiency, ranked #469 of 826 in TX (top 57%) — families likely to look elsewhere, expect single-tenant / working-renter base with shorter leases.
- Zoned schools: Bowie El (422 students, 65% FRL) — zoned schools average 65% FRL vs 42% district-wide (24 pts higher); higher-poverty schools than district average — tighter screening recommended.
- Market conditions: 238 active listings in the ZIP; 1 comparable units currently listed for rent nearby; 23 units permitted in Montague County in 2024 (0 in 5+ unit buildings).
Forward outlook
- Local home prices are declining (-3.0%/yr); year-one equity from $726 of loan paydown is wiped out by about $3k of value loss. Plan a longer hold.
- Montague County population projected at -15% by 2050 — secular population decline; favor cash flow + early exit over multi-decade hold.
- At projected returns (-3.0% appreciation + 3.0% rent growth), your $29k cash investment doubles in ~8 years — after that, you're playing with house money.
Negotiation context
- It's been on market 50 days — a 3% lower offer ($102k) is reasonable based on typical stale-listing flexibility.
Risks & watch-outs
- Watch-outs: built in 1955 — expect roof / HVAC / electrical / plumbing capex.
- Climate carrying-cost: major wildfire risk; extreme-heat days projected 7→20/yr by 2055 (HVAC capex compounding) — expect insurance premiums to compound above CPI over the hold.
Questions for the listing agent
- It's been on market 50 days. Have you received any prior offers? Is the seller open to a 3% concession, seller financing, or rate buy-down credit?
- Built in 1955 — when were the roof, HVAC, electrical panel, plumbing, and water heater last replaced?
- Is there a deadline driving the sale (1031 exchange, divorce, estate, relocation)? That informs how much negotiation room exists.
- Schools are D-rated, which usually means shorter tenancies and higher turnover. Who's the typical renter profile here, and what's been the actual vacancy rate?
- What's the average days-on-market for RENTAL listings here right now (not sales)? A rising rental-DOM trend means longer vacancies and softer asking-rent achievability than the comps imply.
- What's the recent tenant-quality profile in this submarket — average credit score on applications, eviction rate, late-payment / NSF rate, and stable-employment percentage? A property-management company in the area should have these aggregated.
- How much new for-sale + rental construction is in the pipeline within 1–3 miles? Heavy new supply typically softens prices + rents 12–24 months out; constrained supply supports both.
Investment metrics
- 1% rule
- 1.29% ✓
- Cap rate
- 10.48%
- Cash-on-cash
- 14.95%
- DSCR
- 1.67
- GRM
- 6.5
CMA / ARV
- ARV (median comp)
- $223,234
- List price
- $105,000
- Delta
- -52.96%
- Verdict
- UNDERPRICED
- Comps
- 20 within 1.0 mi
Show comp detail 6 sales within ~0.75 mi
| Address | Dist | Beds/Ba | Sqft | Sold | Price | $/sf | Match |
|---|---|---|---|---|---|---|---|
| 408 Theater Rd | 0.30mi | 3/2.0 | 1,624 (-1%) | 16mo | $280,000 | $172 | 67 |
| 1453 N Highway 81 | 0.24mi | 3/2.0 | 1,768 (+8%) | 10mo | $155,000 | $88 | 64 |
| 142 Edwards Dr | 0.25mi | 3/2.0 | 1,516 (-8%) | 23mo | $242,500 | $160 | 53 |
| 173 Edwards Dr | 0.22mi | 3/1.5 | 1,472 (-10%) | 22mo | $155,000 | $105 | 53 |
| 1016 Polk Rd | 0.44mi | 3/1.0 | 1,500 (-8%) | 22mo | $149,900 | $100 | 47 |
| 171 Reaves Rd | 0.66mi | 3/2.0 | 1,429 (-13%) | 22mo | $149,900 | $105 | 25 |
Match score weights: distance 35% · size 25% · config 20% · recency 20%. Top-matched comps best support the ARV.
Projected returns pro-forma
-3.0% appreciation · 3.0% rent growth · sell at horizon
- IRR
- 5.5%
- Equity multiple
- 1.21×
- Total profit
- $6,316
- Equity at exit
- $15,656
- IRR
- 15.0%
- Equity multiple
- 2.21×
- Total profit
- $35,555
- Equity at exit
- $9,078
Cash invested: $29,400 (down + closing). Projections, not guarantees.
Landlord ↔ Tenant lean methodology
- Overall (STATE)
- 87 Strongly Landlord-Friendly
- State Texas
- 87 Strongly Landlord-Friendly · R+5
- County
- — inherits STATE
- City
- — inherits STATE
ZIP-level market 76230
- Home prices YoY
- -27.1%
- Active inventory
- 238
- Price-to-rent
- 6.5×
Monthly cashflow live
- Estimated rent
- $1,350 medium interval (Pro) →
- Mortgage (P&I)
- −$551
- Tax from tax record
- −$106 /mo · $1,271/yr
- Insurance
- −$44
- HOA
- −$0
- Vacancy / Maint / Mgmt
- −$284
- Net cashflow
- $366
Break-even live
UW: 25.0% down · 7.5% · 30yr · 1.5% tax · 5.0% vac · 8.0% maint · 8.0% mgmt
Financing live
Cash to close
- Down payment
- $26,250
- Closing costs
- $3,150
- Reserves months
- —
- Total cash needed
- —
Loan-product check · same deal, 3 products live
Conventional
25% down · 7.5% · 30yr
- Down + closing
- —
- Monthly P&I
- —
- Monthly cashflow
- —
- DSCR
- —
- Eligible?
- —
Personal DTI + credit; lowest rate.
DSCR
20% down · 8.5% · 30yr
- Down + closing
- —
- Monthly P&I
- —
- Monthly cashflow
- —
- DSCR
- —
- Eligible?
- —
No personal income docs; deal must DSCR.
Hard money
10% down · 12.0% · 12mo
- Down + closing
- —
- Monthly P&I
- —
- Monthly cashflow
- —
- DSCR
- —
- Eligible?
- —
Short-term bridge; refi at stabilization.
Rent comps 1 comps
| Address | Beds | Baths | Sqft | Rent | $/sqft | DOM | Units | Dist |
|---|---|---|---|---|---|---|---|---|
| 911 U.S. 81 Unit D Bowie, TX | 3.0 | 2.0 | 1200 | $1,350 | $1.12 | 1d | 1 | 0.86mi |
Listing history 18 events
-
2026-06-18days on market $105,000 Active 50 DOM
-
2026-06-17days on market $105,000 Active 49 DOM
-
2026-06-16days on market $105,000 Active 48 DOM
-
2026-06-15days on market $105,000 Active 47 DOM
-
2026-06-13days on market $105,000 Active 45 DOM
-
2026-06-12days on market $105,000 Active 44 DOM
-
2026-06-09days on market $105,000 Active 41 DOM
-
2026-06-08days on market $105,000 Active 40 DOM
-
2026-06-08days on market $105,000 Active 39 DOM
-
2026-06-07days on market $105,000 Active 38 DOM
-
2026-06-03days on market $105,000 Active 35 DOM
-
2026-06-02days on market $105,000 Active 34 DOM
-
2026-06-01days on market $105,000 Active 33 DOM
-
2026-05-31days on market $105,000 Active 32 DOM
-
2026-04-29$105,000 Active 614-char remark
-
2006-05-30soldstatus
-
2002-02-28soldstatus
-
2002-02-25soldstatus
ⓘ Source: listings_history table (triggers on properties + properties_extension) + one-shot
backfill from property_details.listing_events for pre-trigger history.
Tax reassessment forecast TX · Resets to sale price
- Current annual tax
- $1,271 · $106/mo
- Projected year-2 tax
- $1,922 · $160/mo
- Expected delta
- +$651/yr (+$54/mo · 51.2%)
ⓘ Screening estimate from a state-policy table — verify with the county assessor before closing.
Climate risk First Street
- Flood 1/10 Low FEMA zone X (unshaded) · 0% chance over 30 yrs
- Wildfire 7/10 Severe
- Heat 6/10 Major 7 d/yr ≥108°F today · 20 d/yr by 30 yrs out
- Wind 4/10 Moderate 13% chance of damaging wind over 30 yrs
- Air quality 1/10 Low 0 unhealthy d/yr today · 0 by 30 yrs out
Nearby sold comps map
Loading sold comps map…
Walkable amenities ~0.75 mi
Loading nearby amenities…
Taxation est. · year 1
- Rental income
- $16,200
- − Mortgage interest
- −$5,882
- − Property taxes
- −$1,271
- − Insurance
- −$525
- − Repairs & maintenance
- −$1,296
- − Management
- −$1,296
- − Depreciation
- −$3,055
- Taxable income
- $2,876
- Est. tax owed @ 24.0%
- −$690
- After-tax cash flow
- $3,705/yr
For passive investors: Depreciation is non-cash, so a rental often shows a tax loss while cash-flowing — sheltering income. Rental losses are passive: they offset passive income freely, and up to $25,000/yr can offset ordinary (W-2) income if you actively participate and your MAGI is under $100k (phasing out to $0 by $150k); unused losses carry forward. On sale, claimed depreciation is recaptured at up to 25%, and gains may owe capital-gains tax (a 1031 exchange can defer both). Figures are a year-1 estimate at your 24.0% rate — not tax advice; consult a CPA.
Schools (NCES district)
- District
- Bowie ISD
- NCES district ID
- 4810990
- Math proficiency
- 34% ▼ -8.00%
- Reading proficiency
- 41% ▼ -2.00%
- Median HH income
- $45,720
- Composite
- 31.99/100
- National rank
- #5836
- State rank
- #469 of 826 in TX
Livability — Bowie
- Score
- 64/100
- State rank
- #796
- US rank
- #14499
Category grades
Schools grade is shown separately in the Schools card above.
Census & demographics
- Population (ZIP)
- 9,885
Population outlook (Montague County) Hauer SSP2
- Today (2025)
- 18,216 people
- By 2030
- 17,603 · -3.4%
- By 2040
- 16,451 · -9.7%
- By 2050
- 15,424 · -15.3%
- By 2075
- 13,365 · -26.6%
- By 2100
- 10,998 · -39.6%
Race, ethnicity, and origin ACS 2023
- Neighborhood character
- Predominantly White (83%)
- Race & ethnicity
- White 83% Hispanic / Latino 12% Two or more races 7%
- Hispanic origin (detail)
- Mexican 12%
- Common ancestry
- Serbian 2% Romanian 2% Slovak 1%
- Foreign-born
- 4% · Canada
- Languages at home
- 89% English-only · Spanish 10% Other Indo-European 1%
Political lean MEDSL · Montague
- 2024 margin
- Solid R (+77.7) · D 10.9% · R 88.5%
- 2008→2024 swing
- -19.2pp toward R · 2008: -58.5pp · 2024: -77.7pp
- All cycles
- 2024: R+77.7 2020: R+76.6 2016: R+77.2 2012: R+70.1 2008: R+58.5
Not yet ingested
- Civics
- —
Market trends
- HPI YoY
- ▼ -75.69%
- Current HPI
- 204.0919
- Rent YoY
- —
- Metro
- —
- State GDP YoY
- ▲ 3.95%
- F500 in state
- 110
Industry mix (Fortune 500 HQ in TX)
| Industry | F500 HQs | Revenue |
|---|---|---|
| Energy | 16 | $1,198B |
|
||
| Technology | 5 | $198B |
|
||
| Engineering / Construction | 4 | $72B |
|
||
| Energy Services | 3 | $60B |
|
||
| Utilities | 3 | $41B |
|
||
| Healthcare | 2 | $330B |
|
||
Price history
4 events — show timeline
- 2026-04-29 Listed $105,000 NTREIS
- 2006-05-30 Sold (Public Records) — Public Records
- 2002-02-28 Sold (Public Records) — Public Records
- 2002-02-25 Sold (Public Records) — Public Records
Property tax history
+2.4%/yrLatest (2025): $1,271 · +0.0% YoY. Source: county tax records.
Cash-flow waterfall
monthlySold comps — $/sqft
last 12 mo · ≤1 miLoading sold comps…