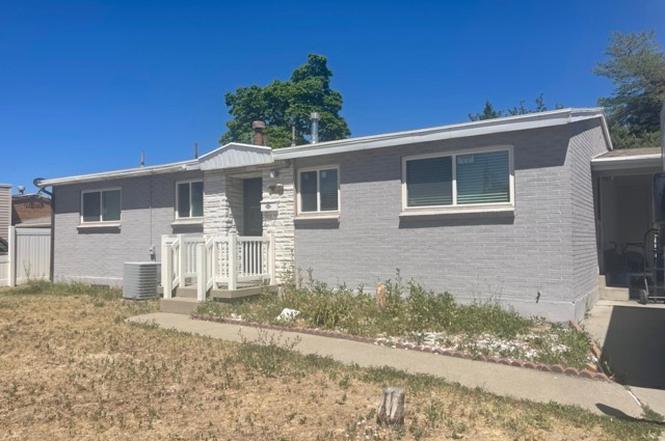
4213 S 3720 W · West Valley City, UT
Flood risk 1/10 · Minimal
- FEMA flood zone
- X (unshaded)
- Chance of flooding over 30 yrs
- 0.0%
- Est. flood insurance / yr
- $473 – $860
Fire risk 1/10 · Minimal
- Est. fire insurance / yr
- $453 – $841
Heat risk 4/10 · Minor
- Hot days now (above 95°F)
- 7 days/yr
- Hot days in 30 yrs
- 19 days/yr
Wind risk 1/10 · Minimal
- Chance of severe wind over 30 yrs
- —
Air-quality risk 3/10 · Minor
- Unhealthy air days now
- 3 days/yr
- Unhealthy air days in 30 yrs
- 4 days/yr
Risk factors via First Street. Map © Google.
Why this score? — see what drove the D grade
The composite is a weighted blend of 9 inputs, each scored 0–100. Each bar is that input's sub-score; the figure is the points it added to the 100-point composite (weight × sub-score).
- Cash flow +16.6/30.0
- ARV discount +7.5/15.0
- DSCR +5.1/10.0
- 1% rule +3.9/10.0
- Livability +3.8/5.0
- Schools +2.6/10.0
- Condition / age +2.5/5.0
- Rent growth +2.3/5.0
- Appreciation +0.0/10.0
$330,000
🖨 Deal sheet 📄 Offer letter ✓ Due diligence
Listing remarks MLS
There are no remarks available.
Key facts
- 7,405 sq ft lot
- 4 parking spots
- Built 1960
Neighborhood map
What this means for you Summary
Snapshot
- This is a 5-bed/3.5-bath single-family listed at $330k.
Deal economics
- At list price, monthly cash flow is $197 ($2k/yr) — positive.
- The deal already cash-flows at list — no discount required.
- To meet the 1% rule (rent ≥ 1% of price), the offer needs to be $292k (11.5% below list).
- Recommended offer: $292k (11.5% below list) — sets the bar for 1% rule.
Location & tenants
- Location reads 76/100 on livability (#55 in UT, #3,285 nationally) — a middle-class / working-renter tenant base. Strengths: commute A+, housing A+, employment A-; Watch: crime D-, amenities F, health & safety D-.
- Granite District (suburban): math 26% / reading 32% proficiency, ranked #69 of 80 in UT (top 86%) — low school quality limits family demand, transient renter base, plan for 1-2y turnover.
- Zoned schools: Robert Frost School (math 42% / reading 32%, grade F, #355 of 585 statewide, top 63%, 355 students, 60% FRL); Valley Jr High (math 17% / reading 22%, grade F, #130 of 138 statewide, top 94%, 639 students, 66% FRL); Granger High (math 7% / reading 22%, grade F, #167 of 171 statewide, top 98%, 3,481 students, 63% FRL) — zoned schools average 63% FRL vs 45% district-wide (18 pts higher); higher-poverty schools than district average — tighter screening recommended.
- Market conditions: Rents soft (-0.8%/yr); 149 active listings in the ZIP; 5 comparable units currently listed for rent nearby; rentals at typical pace (median 24d on market — plan ~3-4 weeks tenant-placement turnaround); solid renter incomes; 4,970 units permitted in Salt Lake County in 2024 (1,963 in 5+ unit buildings).
- This rent runs 37% of the median local income ($94k/yr) — at the standard rent-burdened threshold; future hikes will face affordability resistance.
Forward outlook
- Local home prices are declining (-3.0%/yr); year-one equity from $2k of loan paydown is wiped out by about $10k of value loss. Plan a longer hold.
- Salt Lake County population projected at +37% by 2050 — long-run rental-demand tailwind backs the buy-and-hold thesis.
Negotiation context
- Only 0 days on market — expect competitive offers; lowballing is unlikely to land.
- 4 sale attempts since 11y ago with the ask held roughly flat each time — persistent listings suggest the price (not the market) is what's stuck; bring a comps-based counter.
Questions for the listing agent
- Built in 1960 — when were the roof, HVAC, electrical panel, plumbing, and water heater last replaced?
- Is there a deadline driving the sale (1031 exchange, divorce, estate, relocation)? That informs how much negotiation room exists.
- Schools are F-rated, which usually means shorter tenancies and higher turnover. Who's the typical renter profile here, and what's been the actual vacancy rate?
- Crime grade is D in this area — have there been break-ins, vandalism, or insurance claims at this property in the last 3 years? What carrier currently insures it and at what premium?
- The area grade is low — what's the realistic commute time and amenity access for the typical tenant pool here? Any planned neighborhood developments (good or bad) we should know about?
- What's the average days-on-market for RENTAL listings here right now (not sales)? A rising rental-DOM trend means longer vacancies and softer asking-rent achievability than the comps imply.
- What's the recent tenant-quality profile in this submarket — average credit score on applications, eviction rate, late-payment / NSF rate, and stable-employment percentage? A property-management company in the area should have these aggregated.
- How much new for-sale + rental construction is in the pipeline within 1–3 miles? Heavy new supply typically softens prices + rents 12–24 months out; constrained supply supports both.
Investment metrics
- 1% rule
- 0.89% ✗
- Cap rate
- 7.01%
- Cash-on-cash
- 2.55%
- DSCR
- 1.11
- GRM
- 9.4
CMA / ARV
No comps found within radius.
Projected returns pro-forma
-3.0% appreciation · 0.0% rent growth · sell at horizon
- IRR
- -15.5%
- Equity multiple
- 0.46×
- Total profit
- $-49,575
- Equity at exit
- $49,204
- IRR
- -12.7%
- Equity multiple
- 0.35×
- Total profit
- $-60,379
- Equity at exit
- $28,532
Cash invested: $92,400 (down + closing). Projections, not guarantees.
Landlord ↔ Tenant lean methodology
- Overall (STATE)
- 86 Strongly Landlord-Friendly
- State Utah
- 86 Strongly Landlord-Friendly · R+15
- County
- — inherits STATE
- City
- — inherits STATE
ZIP-level market 84120
- Rents YoY
- -0.8%
- Active inventory
- 149
- Price-to-rent
- 9.4×
Monthly cashflow live
- Estimated rent
- $2,922 medium interval (Pro) →
- Mortgage (P&I)
- −$1,731
- Tax from tax record
- −$243 /mo · $2,921/yr
- Insurance
- −$138
- HOA
- −$0
- Vacancy / Maint / Mgmt
- −$614
- Net cashflow
- $197
Break-even live
UW: 25.0% down · 7.5% · 30yr · 1.5% tax · 5.0% vac · 8.0% maint · 8.0% mgmt
Financing live
Cash to close
- Down payment
- $82,500
- Closing costs
- $9,900
- Reserves months
- —
- Total cash needed
- —
Loan-product check · same deal, 3 products live
Conventional
25% down · 7.5% · 30yr
- Down + closing
- —
- Monthly P&I
- —
- Monthly cashflow
- —
- DSCR
- —
- Eligible?
- —
Personal DTI + credit; lowest rate.
DSCR
20% down · 8.5% · 30yr
- Down + closing
- —
- Monthly P&I
- —
- Monthly cashflow
- —
- DSCR
- —
- Eligible?
- —
No personal income docs; deal must DSCR.
Hard money
10% down · 12.0% · 12mo
- Down + closing
- —
- Monthly P&I
- —
- Monthly cashflow
- —
- DSCR
- —
- Eligible?
- —
Short-term bridge; refi at stabilization.
Rent comps 5 comps
| Address | Beds | Baths | Sqft | Rent | $/sqft | DOM | Units | Dist |
|---|---|---|---|---|---|---|---|---|
| 3550 W Franco Ct Unit 1 Taylorsville, UT | 4.0 | 3.5 | 2800 | $2,695 | $0.96 | 10d | 1 | 0.78mi |
| 4438 W Losee Dr West Valley City, UT | 4.0 | 2.0 | 2100 | $3,000 | $1.43 | 23d | 1 | 0.92mi |
| 4157 S 2785 W West Valley City, UT | 4.0 | 2.0 | 1726 | $2,400 | $1.39 | 23d | 1 | 1.09mi |
| 4074 W 4865 S Salt Lake City, UT | 4.0 | 2.0 | 1800 | $600 | $0.33 | 23d | 1 | 1.13mi |
| 4905 W 4100 S West Valley City, UT | 5.0 | 2.0 | 1830 | $2,800 | $1.53 | 4d | 1 | 1.49mi |
Listing history 1 events
-
2026-06-19$330,000 Under Contract
ⓘ Source: listings_history table (triggers on properties + properties_extension) + one-shot
backfill from property_details.listing_events for pre-trigger history.
Tax reassessment forecast UT · Resets to sale price
- Current annual tax
- $2,921 · $243/mo
- Projected year-2 tax
- $2,921 · $243/mo
- Expected delta
- $0/yr ($0/mo · 0.0%)
ⓘ Screening estimate from a state-policy table — verify with the county assessor before closing.
Climate risk First Street
- Flood 1/10 Low FEMA zone X (unshaded) · 0% chance over 30 yrs
- Wildfire 1/10 Low
- Heat 4/10 Moderate 7 d/yr ≥95°F today · 19 d/yr by 30 yrs out
- Wind 1/10 Low
- Air quality 3/10 Moderate 3 unhealthy d/yr today · 4 by 30 yrs out
Nearby sold comps map
Loading sold comps map…
Walkable amenities ~0.75 mi
Loading nearby amenities…
Taxation est. · year 1
- Rental income
- $35,059
- − Mortgage interest
- −$18,485
- − Property taxes
- −$2,921
- − Insurance
- −$1,650
- − Repairs & maintenance
- −$2,805
- − Management
- −$2,805
- − Depreciation
- −$9,600
- Taxable loss
- −$3,206
- Est. tax savings @ 24.0%
- +$770
- After-tax cash flow
- $3,129/yr
For passive investors: Depreciation is non-cash, so a rental often shows a tax loss while cash-flowing — sheltering income. Rental losses are passive: they offset passive income freely, and up to $25,000/yr can offset ordinary (W-2) income if you actively participate and your MAGI is under $100k (phasing out to $0 by $150k); unused losses carry forward. On sale, claimed depreciation is recaptured at up to 25%, and gains may owe capital-gains tax (a 1031 exchange can defer both). Figures are a year-1 estimate at your 24.0% rate — not tax advice; consult a CPA.
Schools (NCES district)
- District
- Granite District
- NCES district ID
- 4900360
- Math proficiency
- 26% ▼ -8.00%
- Reading proficiency
- 32% ▼ -3.00%
- Median HH income
- $55,971
- Composite
- 25.93/100
- National rank
- #7336
- State rank
- #69 of 80 in UT
Livability — West Valley City
- Score
- 76/100
- State rank
- #55
- US rank
- #3285
Category grades
Schools grade is shown separately in the Schools card above.
Census & demographics
- Census place
- West Valley City, UT
- County
- Salt Lake County · 1,195,750 people
- City population
- 132,995
- Metro
- Salt Lake City, UT
- Population (ZIP)
- 50,799
- Household income
- $94,306
- Rent vs Own
- Severe rent burden
- 551.0
Population outlook (Salt Lake County) Hauer SSP2
- Today (2025)
- 1,305,860 people
- By 2030
- 1,402,611 · +7.4%
- By 2040
- 1,594,533 · +22.1%
- By 2050
- 1,787,244 · +36.9%
- By 2075
- 2,224,138 · +70.3%
- By 2100
- 2,551,390 · +95.4%
Race, ethnicity, and origin ACS 2023
- Neighborhood character
- Diverse neighborhood (Simpson 0.66)
- Race & ethnicity
- White 42% Hispanic / Latino 40% Two or more races 11% Asian 6% Pacific Islander 5% Black 2% Native American 1%
- Hispanic origin (detail)
- Mexican 31%
- Common ancestry
- Slovak 2% Iranian 1% Italian 1%
- Foreign-born
- 24% · Canada, Vietnam, Jamaica
- Languages at home
- 59% English-only · Spanish 29% Other Asian/Pacific 5% Vietnamese 3%
Political lean MEDSL · Salt Lake
- 2024 margin
- D (+10.2) · D 53.7% · R 43.5% · Other 2.8%
- 2008→2024 swing
- +10.1pp toward D · 2008: 0.1pp · 2024: 10.2pp
- All cycles
- 2024: D+10.2 2020: D+11.0 2016: D+10.2 2012: R+19.3 2008: D+0.1
Not yet ingested
- Civics
- —
Market trends
- HPI YoY
- ▼ -364.74%
- Current HPI
- 313.9459
- Rent YoY
- ▼ -0.82%
- Metro
- Salt Lake City, UT
- State GDP YoY
- ▲ 3.54%
- F500 in state
- 2
Industry mix (Fortune 500 HQ in UT)
| Industry | F500 HQs | Revenue |
|---|---|---|
| Financial Services | 1 | $3B |
|
||
Price history
+83.4% since first listed14 events — show timeline
- 2026-06-18 Listing Removed — WFRMLS
- 2026-06-18 Listed $330,000 WFRMLS
- 2023-08-04 Sold (Public Records) — Public Records
- 2023-08-04 Sold (MLS) — WFRMLS
- 2023-06-26 Pending — WFRMLS
- 2023-06-26 Price Changed $445,000 WFRMLS
- 2023-06-16 Listed $409,900 WFRMLS
- 2019-05-07 Sold (Public Records) — Public Records
- 2019-05-07 Sold (MLS) — WFRMLS
- 2019-04-15 Contingent — WFRMLS
- 2019-04-11 Listed $269,900 WFRMLS
- 2016-01-15 Sold (Public Records) — Public Records
- 2016-01-14 Sold (MLS) — WFRMLS
- 2015-12-17 Listed $179,900 WFRMLS
Property tax history
+11.3%/yrLatest (2025): $2,921 · +3.0% YoY. Source: county tax records.
Cash-flow waterfall
monthlySold comps — $/sqft
last 12 mo · ≤1 miLoading sold comps…