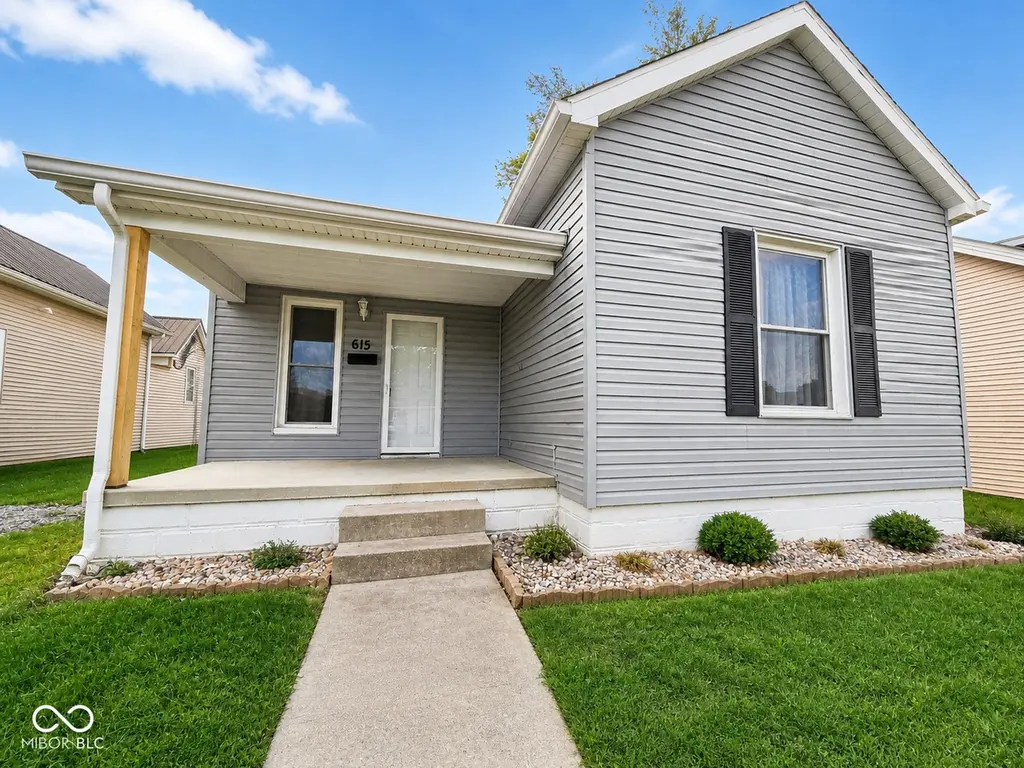
615 W Oak St · Seymour, IN
Flood risk 1/10 · Minimal
- FEMA flood zone
- X (unshaded)
- Chance of flooding over 30 yrs
- 0.0%
- Est. flood insurance / yr
- $507 – $1,088
Fire risk 1/10 · Minimal
- Est. fire insurance / yr
- $717 – $1,331
Heat risk 5/10 · Moderate
- Hot days now (above 103°F)
- 7 days/yr
- Hot days in 30 yrs
- 19 days/yr
Wind risk 2/10 · Minimal
- Chance of severe wind over 30 yrs
- 1.0%
Air-quality risk 1/10 · Minimal
- Unhealthy air days now
- 0 days/yr
- Unhealthy air days in 30 yrs
- 0 days/yr
Risk factors via First Street. Map © Google.
Why this score? — see what drove the C+ grade
The composite is a weighted blend of 9 inputs, each scored 0–100. Each bar is that input's sub-score; the figure is the points it added to the 100-point composite (weight × sub-score).
- Cash flow +24.4/30.0
- ARV discount +15.0/15.0
- DSCR +7.9/10.0
- 1% rule +5.4/10.0
- Livability +3.4/5.0
- Schools +2.6/10.0
- Rent growth +2.5/5.0
- Condition / age +2.5/5.0
- Appreciation +0.0/10.0
$135,000
🖨 Deal sheet 📄 Offer letter ✓ Due diligence
Listing remarks MLS
This house has had a total makeover. Roof, windows, doors, HVAC system, water heater, electrical, siding, concrete porch, walkway, patio, paint, floor coverings & much more!
Key facts
- Unfinished basement
- Concrete patio
- Storm shelter
Tags
Property features AI
Exterior
- Parking: Gravel parking; No garage
- Utilities: Public water; Municipal sewer connected
- Home design: Single-family residence; One story
- Construction: Vinyl siding exterior; Block foundation
- Exterior features: Approximately 0.26-acre lot (about 1/4–1/2 acre)
Interior
- Kitchen: Electric cooktop; Electric oven; Microwave; Dishwasher; Refrigerator
- Bedrooms: Three bedrooms on the main level (one 14x14, one 14x10, plus an additional 14x14 room listed on main level)
- Bathrooms: One full bathroom (on the main level)
- Heating & cooling: Forced air heating (natural gas); Central air conditioning
- Interior features: Eat-in kitchen; Unfinished basement
- Laundry & utility: Main-level laundry room (9x15.5); Gas water heater
Neighborhood map
What this means for you Summary
Snapshot
- This is a 3-bed/1.0-bath single-family listed at $135k.
Deal economics
- At list price, monthly cash flow is $274 ($3k/yr) — positive.
- The deal already cash-flows at list — no discount required.
- Meets the 1% rule at list price ($1k rent vs $135k).
- Recommended offer: $131k (3.0% below list) — sets the bar for market timing.
- Cap rate 8.7% vs local median 3.5% in Seymour — top-decile yield for the area; either an underpriced asset or a hidden risk that comps aren't pricing in. Stress-test before assuming the spread holds.
Location & tenants
- Location reads 68/100 on livability (#211 in IN) — a middle-class / working-renter tenant base. Strengths: crime A+, cost of living A+, housing A+; Watch: employment D+, health & safety D, amenities F.
- Seymour Community Schools (town): math 27% / reading 33% proficiency, ranked #239 of 301 in IN (top 79%) — families likely to look elsewhere, expect single-tenant / working-renter base with shorter leases.
- Zoned schools: Seymour Senior High School (math 29% / reading 55%, grade F, #197 of 369 statewide, top 57%, 1,690 students, 57% FRL).
- Zoned-school proficiency averages 42% at this address vs 30% district-wide (+12 pts) — the actual schools serving this property are materially stronger than the Seymour Community Schools average implies; a family-tenant draw the district grade alone would hide.
- Market conditions: 245 active listings in the ZIP; 101 units permitted in Jackson County in 2024 (0 in 5+ unit buildings).
Forward outlook
- Local home prices are declining (-3.0%/yr); year-one equity from $933 of loan paydown is wiped out by about $4k of value loss. Plan a longer hold.
- Jackson County population projected at +7% by 2050 — modest demand growth; plan on rents tracking national, not racing it.
Negotiation context
- It's been on market 46 days — a 3% lower offer ($131k) is reasonable based on typical stale-listing flexibility.
- 3 sale attempts since 13y ago with the ask held roughly flat each time — persistent listings suggest the price (not the market) is what's stuck; bring a comps-based counter.
- Current owner paid $82k; list at $135k implies a 65% gain — meaningful room to come down on a strong offer.
Risks & watch-outs
- Watch-outs: built in 1900 — expect roof / HVAC / electrical / plumbing capex.
- Climate carrying-cost: extreme-heat days projected 7→19/yr by 2055 (HVAC capex compounding) — expect insurance premiums to compound above CPI over the hold.
Questions for the listing agent
- It's been on market 46 days. Have you received any prior offers? Is the seller open to a 3% concession, seller financing, or rate buy-down credit?
- Built in 1900 — when were the roof, HVAC, electrical panel, plumbing, and water heater last replaced?
- Is there a deadline driving the sale (1031 exchange, divorce, estate, relocation)? That informs how much negotiation room exists.
- What's the average days-on-market for RENTAL listings here right now (not sales)? A rising rental-DOM trend means longer vacancies and softer asking-rent achievability than the comps imply.
- What's the recent tenant-quality profile in this submarket — average credit score on applications, eviction rate, late-payment / NSF rate, and stable-employment percentage? A property-management company in the area should have these aggregated.
- How much new for-sale + rental construction is in the pipeline within 1–3 miles? Heavy new supply typically softens prices + rents 12–24 months out; constrained supply supports both.
Investment metrics
- 1% rule
- 1.04% ✓
- Cap rate
- 8.73%
- Cash-on-cash
- 8.70%
- DSCR
- 1.39
- GRM
- 8.0
CMA / ARV
- ARV (median comp)
- $173,889
- List price
- $135,000
- Delta
- -22.36%
- Verdict
- UNDERPRICED
- Comps
- 20 within 1.0 mi
Show comp detail 12 sales within ~0.75 mi
| Address | Dist | Beds/Ba | Sqft | Sold | Price | $/sf | Match |
|---|---|---|---|---|---|---|---|
| 705 S Pine St | 0.09mi | 3/1.0 | 1,223 (+2%) | 3mo | $75,000 | $61 | 89 |
| 807 S Poplar St | 0.20mi | 3/2.0 | 1,220 (+2%) | 2mo | $209,900 | $172 | 81 |
| 519 S Beech St | 0.10mi | 2/1.0 (-1) | 1,113 (-7%) | 3mo | $179,900 | $162 | 77 |
| 722 Jackson St | 0.10mi | 2/1.0 (-1) | 1,280 (+7%) | 4mo | $163,000 | $127 | 75 |
| 815 Sarasota Dr | 0.22mi | 2/2.0 (-1) | 1,250 (+5%) | 2mo | $185,000 | $148 | 72 |
| 313 Jackson St | 0.25mi | 2/1.0 (-1) | 1,104 (-8%) | 2mo | $172,000 | $156 | 70 |
| 110 Windhorst Ct | 0.45mi | 3/1.5 | 1,152 (-4%) | 4mo | $65,000 | $56 | 68 |
| 818 Garden Ave | 0.41mi | 3/2.0 | 1,248 (+4%) | 2mo | $190,000 | $152 | 68 |
| 1000 Gaiser Dr | 0.49mi | 3/1.0 | 1,124 (-6%) | 2mo | $209,000 | $186 | 66 |
| 828 Phillips Ln | 0.53mi | 3/2.0 | 1,275 (+7%) | 4mo | $239,900 | $188 | 57 |
| 201 Lee Blvd | 0.48mi | 2/1.0 (-1) | 1,032 (-14%) | 3mo | $160,000 | $155 | 48 |
| 663 S Vine St | 0.61mi | 3/1.5 | 1,356 (+14%) | 1mo | $95,000 | $70 | 46 |
Match score weights: distance 35% · size 25% · config 20% · recency 20%. Top-matched comps best support the ARV.
Projected returns pro-forma
-3.0% appreciation · 3.0% rent growth · sell at horizon
- IRR
- -3.1%
- Equity multiple
- 0.88×
- Total profit
- $-4,468
- Equity at exit
- $20,129
- IRR
- 6.5%
- Equity multiple
- 1.49×
- Total profit
- $18,417
- Equity at exit
- $11,672
Cash invested: $37,800 (down + closing). Projections, not guarantees.
Landlord ↔ Tenant lean methodology
- Overall (STATE)
- 90 Strongly Landlord-Friendly
- State Indiana
- 90 Strongly Landlord-Friendly · R+11
- County
- — inherits STATE
- City
- — inherits STATE
ZIP-level market 47274
- Active inventory
- 245
- Price-to-rent
- 8.0×
Monthly cashflow live
- Estimated rent
- $1,404 medium interval (Pro) →
- Mortgage (P&I)
- −$708
- Tax from tax record
- −$71 /mo · $853/yr
- Insurance
- −$56
- HOA
- −$0
- Vacancy / Maint / Mgmt
- −$295
- Net cashflow
- $274
Break-even live
UW: 25.0% down · 7.5% · 30yr · 1.5% tax · 5.0% vac · 8.0% maint · 8.0% mgmt
Financing live
Cash to close
- Down payment
- $33,750
- Closing costs
- $4,050
- Reserves months
- —
- Total cash needed
- —
Loan-product check · same deal, 3 products live
Conventional
25% down · 7.5% · 30yr
- Down + closing
- —
- Monthly P&I
- —
- Monthly cashflow
- —
- DSCR
- —
- Eligible?
- —
Personal DTI + credit; lowest rate.
DSCR
20% down · 8.5% · 30yr
- Down + closing
- —
- Monthly P&I
- —
- Monthly cashflow
- —
- DSCR
- —
- Eligible?
- —
No personal income docs; deal must DSCR.
Hard money
10% down · 12.0% · 12mo
- Down + closing
- —
- Monthly P&I
- —
- Monthly cashflow
- —
- DSCR
- —
- Eligible?
- —
Short-term bridge; refi at stabilization.
Listing history 24 events
-
2026-06-19days on market $135,000 Active 46 DOM
-
2026-06-18days on market $135,000 Active 45 DOM
-
2026-06-17days on market $135,000 Active 44 DOM
-
2026-06-16days on market $135,000 Active 43 DOM
-
2026-06-15days on market $135,000 Active 42 DOM
-
2026-06-14days on market $135,000 Active 40 DOM
-
2026-06-13days on market $135,000 Active 39 DOM
-
2026-06-10days on market $135,000 Active 37 DOM
-
2026-06-09days on market $135,000 Active 36 DOM
-
2026-06-08days on market $135,000 Active 35 DOM
-
2026-06-07days on market $135,000 Active 34 DOM
-
2026-06-05days on market $135,000 Active 31 DOM
-
2026-06-03days on market $135,000 Active 30 DOM
-
2026-06-02days on market $135,000 Active 29 DOM
-
2026-06-01days on market $135,000 Active 28 DOM
-
2026-05-31days on market $135,000 Active 27 DOM
-
2026-05-30days on market $135,000 Active 26 DOM
-
2026-05-02$135,000 Active 943-char remark
-
2016-08-02soldstatus $82,000 177-char remark
Show marketing remark (177 chars)
This house has had a total makeover. Roof, windows, doors, HVAC system, water heater, electrical, siding, concrete porch, walkway, patio, paint, floor coverings & much more!
-
2016-03-24$86,500 177-char remark
Show marketing remark (177 chars)
This house has had a total makeover. Roof, windows, doors, HVAC system, water heater, electrical, siding, concrete porch, walkway, patio, paint, floor coverings & much more!
-
2013-05-08soldstatus $9,750
-
2013-05-02soldstatus $9,750
Show marketing remark (88 chars)
Single family home built in 1900 has 1162 SF and unfinished basement. Large 50x225 lot.
-
2013-02-05$15,000
Show marketing remark (88 chars)
Single family home built in 1900 has 1162 SF and unfinished basement. Large 50x225 lot.
-
2013-01-10soldstatus $26,145
ⓘ Source: listings_history table (triggers on properties + properties_extension) + one-shot
backfill from property_details.listing_events for pre-trigger history.
Tax reassessment forecast IN · Partial reset (capped growth)
- Current annual tax
- $853 · $71/mo
- Projected year-2 tax
- $1,000 · $83/mo
- Expected delta
- +$147/yr (+$12/mo · 17.3%)
ⓘ Screening estimate from a state-policy table — verify with the county assessor before closing.
Climate risk First Street
- Flood 1/10 Low FEMA zone X (unshaded) · 0% chance over 30 yrs
- Wildfire 1/10 Low
- Heat 5/10 Major 7 d/yr ≥103°F today · 19 d/yr by 30 yrs out
- Wind 2/10 Low 100% chance of damaging wind over 30 yrs
- Air quality 1/10 Low 0 unhealthy d/yr today · 0 by 30 yrs out
Nearby sold comps map
Loading sold comps map…
Walkable amenities ~0.75 mi
Loading nearby amenities…
Taxation est. · year 1
- Rental income
- $16,848
- − Mortgage interest
- −$7,562
- − Property taxes
- −$853
- − Insurance
- −$675
- − Repairs & maintenance
- −$1,348
- − Management
- −$1,348
- − Depreciation
- −$3,927
- Taxable income
- $1,136
- Est. tax owed @ 24.0%
- −$273
- After-tax cash flow
- $3,015/yr
For passive investors: Depreciation is non-cash, so a rental often shows a tax loss while cash-flowing — sheltering income. Rental losses are passive: they offset passive income freely, and up to $25,000/yr can offset ordinary (W-2) income if you actively participate and your MAGI is under $100k (phasing out to $0 by $150k); unused losses carry forward. On sale, claimed depreciation is recaptured at up to 25%, and gains may owe capital-gains tax (a 1031 exchange can defer both). Figures are a year-1 estimate at your 24.0% rate — not tax advice; consult a CPA.
Schools (NCES district)
- District
- Seymour Community Schools
- NCES district ID
- 1810080
- Math proficiency
- 27% ▼ -10.00%
- Reading proficiency
- 33% ▼ -9.00%
- Median HH income
- $46,122
- Composite
- 25.81/100
- National rank
- #7362
- State rank
- #239 of 301 in IN
Livability — Seymour
- Score
- 68/100
- State rank
- #211
- US rank
- #9328
Category grades
Schools grade is shown separately in the Schools card above.
Census & demographics
- Census place
- Seymour, IN
- County
- Jackson County · 33,068 people
- City population
- 33,068
- Metro
- Seymour, IN
- Population (ZIP)
- 33,068
- Household income
- $71,457
- Rent vs Own
- Severe rent burden
- 453.0
Population outlook (Jackson County) Hauer SSP2
- Today (2025)
- 46,376 people
- By 2030
- 47,344 · +2.1%
- By 2040
- 48,936 · +5.5%
- By 2050
- 49,738 · +7.2%
- By 2075
- 50,435 · +8.8%
- By 2100
- 46,321 · -0.1%
Race, ethnicity, and origin ACS 2023
- Neighborhood character
- Predominantly White (74%)
- Race & ethnicity
- White 74% Hispanic / Latino 18% Two or more races 12% Asian 3% Black 1% Native American 1%
- Hispanic origin (detail)
- Mexican 10% Puerto Rican 2%
- Common ancestry
- Slovak 2% Romanian 2% Iranian 1%
- Foreign-born
- 11% · Canada
- Languages at home
- 85% English-only · Spanish 12% Other Asian/Pacific 2% Other Indo-European 1%
Political lean MEDSL · Jackson
- 2024 margin
- Solid R (+55.3) · D 21.5% · R 76.8% · Other 1.7%
- 2008→2024 swing
- -41.6pp toward R · 2008: -13.7pp · 2024: -55.3pp
- All cycles
- 2024: R+55.3 2020: R+53.3 2016: R+51.4 2012: R+27.4 2008: R+13.7
Not yet ingested
- Civics
- —
Market trends
- HPI YoY
- ▼ -146.47%
- Current HPI
- 211.9507
- Rent YoY
- —
- Metro
- Seymour, IN
- State GDP YoY
- ▲ 2.90%
- F500 in state
- 18
Industry mix (Fortune 500 HQ in IN)
| Industry | F500 HQs | Revenue |
|---|---|---|
| Industrial Machinery | 2 | $37B |
|
||
| Healthcare | 1 | $177B |
|
||
| Pharmaceuticals | 1 | $45B |
|
||
| Metals / Steel | 1 | $18B |
|
||
| Agriculture | 1 | $17B |
|
||
| Packaging | 1 | $12B |
|
||
Price history
+416.4% since first listed7 events — show timeline
- 2026-05-02 Listed $135,000 MIBOR as Distributed by MLS Grid
- 2016-08-02 Sold (MLS) $82,000 MIBOR as Distributed by MLS Grid
- 2016-03-24 Listed $86,500 MIBOR as Distributed by MLS Grid
- 2013-05-08 Sold (Public Records) $9,750 Public Records
- 2013-05-02 Sold (MLS) $9,750 MIBOR as Distributed by MLS Grid
- 2013-02-05 Listed $15,000 MIBOR as Distributed by MLS Grid
- 2013-01-10 Sold (Public Records) $26,145 Public Records
Property tax history
+2.6%/yrLatest (2024): $853 · -12.4% YoY. Source: county tax records.
Cash-flow waterfall
monthlySold comps — $/sqft
last 12 mo · ≤1 miLoading sold comps…