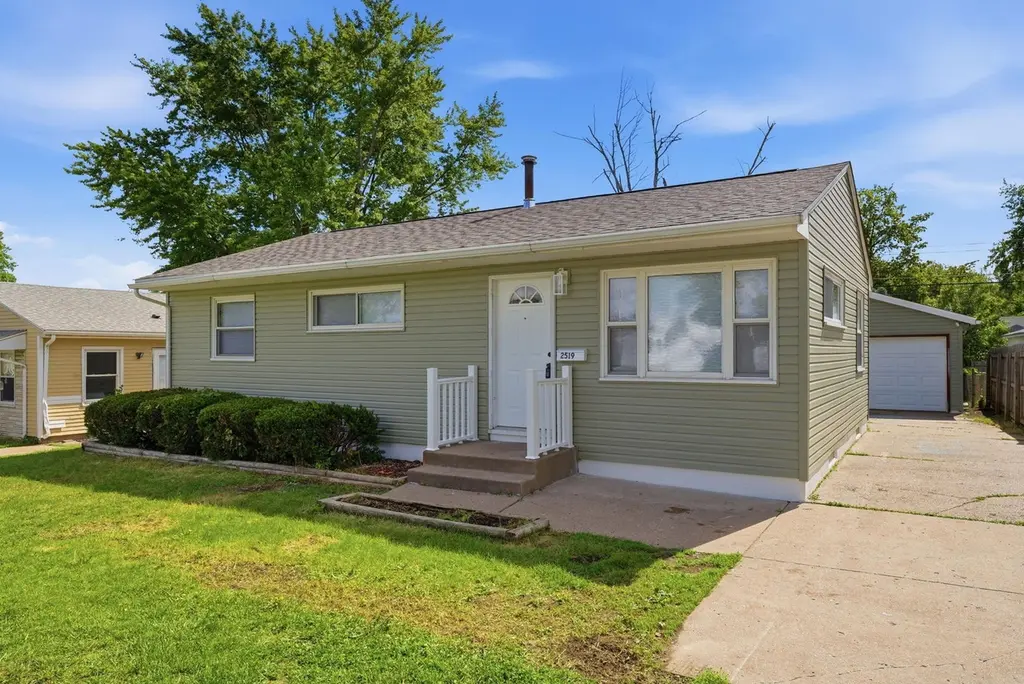
2519 N Fairmount St · Davenport, IA
Flood risk 1/10 · Minimal
- FEMA flood zone
- X (unshaded)
- Chance of flooding over 30 yrs
- 0.0%
- Est. flood insurance / yr
- $473 – $860
Fire risk 1/10 · Minimal
- Est. fire insurance / yr
- $902 – $1,676
Heat risk 3/10 · Minor
- Hot days now (above 103°F)
- 7 days/yr
- Hot days in 30 yrs
- 16 days/yr
Wind risk 2/10 · Minimal
- Chance of severe wind over 30 yrs
- —
Air-quality risk 3/10 · Minor
- Unhealthy air days now
- 2 days/yr
- Unhealthy air days in 30 yrs
- 3 days/yr
Risk factors via First Street. Map © Google.
Why this score? — see what drove the F grade
The composite is a weighted blend of 9 inputs, each scored 0–100. Each bar is that input's sub-score; the figure is the points it added to the 100-point composite (weight × sub-score).
- Appreciation +5.0/10.0
- Livability +4.0/5.0
- ARV discount +3.9/15.0
- Schools +3.9/10.0
- Cash flow +3.1/30.0
- Rent growth +2.5/5.0
- Condition / age +2.5/5.0
- 1% rule +0.0/10.0
- DSCR +0.0/10.0
$185,000
🖨 Deal sheet 📄 Offer letter ✓ Due diligence
Listing remarks
Well hello there, smart shopper. .. looking for a ranch that actually has the big-ticket stuff DONE? I've been waiting for you. Let me save you some scrolling: 3 bedrooms on the main level, beautifully remodeled bathroom, fresh paint everywhere, new vinyl plank flooring throughout, a 2-car garage, flat yard, and mechanical updates that make your wallet breathe a sigh of relief. My bathroom? Oh, she's fancy. Massive statement tiles give spa-like vibes without the spa-like price tag. Meanwhile, the rest of me keeps things practical and easy with one-level living where everyone actually wants it. .. on the main floor. Downstairs, I'm clean, fresh, and full of possibility. The newly epoxied bas
Key facts
- New siding
- Remodeled bathroom
- Mechanical updates
Tags
Property features AI
Finance
- HOA & community: No master association fee required
Exterior
- Parking: Detached garage (concrete) with 2 parking spaces; 2 total parking spaces
- Utilities: Public water; Public sewer
- Home design: Detached single-family home; One-story
- Construction: Vinyl siding; Asphalt roof; Block foundation; Built 71–80 years ago (built before 1978)
- Exterior features: Patio; Level lot (less than 0.25 acre)
Interior
- Kitchen: Range; Microwave; Refrigerator; Eat-in kitchen
- Bedrooms: Three bedrooms (all on main level); Master bedroom on main level, 11 x 10; Second bedroom on main level, 11 x 9; Third bedroom on main level, 8 x 10
- Flooring: Luxury vinyl flooring throughout main living areas
- Bathrooms: One full bathroom
- Heating & cooling: Natural gas heating; Central air conditioning
- Interior features: Six total rooms; Full, unfinished basement; Dining area combined with kitchen
- Laundry & utility: Laundry room; Sump pump
Neighborhood map
What this means for you Summary
Snapshot
- This is a 3-bed/1.5-bath single-family listed at $185k.
Deal economics
- At list price, monthly cash flow is $-592 ($-7k/yr) — negative.
- To cash-flow at today's rent, offer at most $80k (56.5% below list).
- To meet the 1% rule (rent ≥ 1% of price), the offer needs to be $88k (52.6% below list).
- Recommended offer: $80k (56.5% below list) — sets the bar for cash-flow.
- Cap rate 2.5% vs local median 4.4% in Davenport — below-typical yield; the buyer is paying a premium for something (appreciation thesis, condition, location) that the cap rate doesn't capture.
Location & tenants
- Location reads 79/100 on livability (#126 in IA, #2,312 nationally) — a middle-class / working-renter tenant base. Strengths: cost of living A+, housing A+, health & safety A+; Watch: employment C-, crime F.
- Davenport Community School District (urban): math 43% / reading 50% proficiency, ranked #288 of 289 in IA (top 100%) — families likely to look elsewhere, expect single-tenant / working-renter base with shorter leases.
- Zoned schools: Wilson Elementary School (math 47% / reading 43%, grade D-, #547 of 616 statewide, top 89%, 433 students, 57% FRL) — zoned schools at 57% FRL track the district average.
- Market conditions: 2 active listings in the ZIP; 5 comparable units currently listed for rent nearby; rentals leasing fast (median 14d on market — plan ~1-2 weeks tenant-placement turnaround); 805 units permitted in Scott County in 2024 (479 in 5+ unit buildings).
Forward outlook
- In year one you build about $7k of equity ($1k loan paydown + $6k appreciation (3.0% local appreciation)).
- Scott County population projected at +19% by 2050 — long-run rental-demand tailwind backs the buy-and-hold thesis.
- By year 6, paydown + projected appreciation supports a ~$36k cash-out refi (75% LTV) — recoverable capital for the next deal without selling this one.
Negotiation context
- Only 5 days on market — expect competitive offers; lowballing is unlikely to land.
Risks & watch-outs
- Watch-outs: built in 1954 — expect roof / HVAC / electrical / plumbing capex.
Questions for the listing agent
- What do current leases actually rent for vs. the listed asking? Can we see a recent rent roll and the last 12 months of T-12 income?
- Built in 1954 — when were the roof, HVAC, electrical panel, plumbing, and water heater last replaced?
- Is there a deadline driving the sale (1031 exchange, divorce, estate, relocation)? That informs how much negotiation room exists.
- Crime grade is F in this area — have there been break-ins, vandalism, or insurance claims at this property in the last 3 years? What carrier currently insures it and at what premium?
- The area grade is low — what's the realistic commute time and amenity access for the typical tenant pool here? Any planned neighborhood developments (good or bad) we should know about?
- What's the average days-on-market for RENTAL listings here right now (not sales)? A rising rental-DOM trend means longer vacancies and softer asking-rent achievability than the comps imply.
- What's the recent tenant-quality profile in this submarket — average credit score on applications, eviction rate, late-payment / NSF rate, and stable-employment percentage? A property-management company in the area should have these aggregated.
- How much new for-sale + rental construction is in the pipeline within 1–3 miles? Heavy new supply typically softens prices + rents 12–24 months out; constrained supply supports both.
Investment metrics
- 1% rule
- 0.47% ✗
- Cap rate
- 2.46%
- Cash-on-cash
- -13.71%
- DSCR
- 0.39
- GRM
- 17.6
CMA / ARV
- ARV (on-the-fly)
- $171,456
- Comps found
- 12
Show comp detail 12 sales within ~0.75 mi
| Address | Dist | Beds/Ba | Sqft | Sold | Price | $/sf | Match |
|---|---|---|---|---|---|---|---|
| 2410 N Michigan Ave | 0.12mi | 3/1.0 | 864 (-5%) | 1mo | $162,000 | $188 | 82 |
| 2104 N Ohio Ave | 0.34mi | 3/2.0 | 936 (+3%) | 2mo | $219,900 | $235 | 76 |
| 2123 N Gayman Ave | 0.28mi | 3/1.5 | 960 (+5%) | 3mo | $180,000 | $188 | 75 |
| 2704 Wood Dale Ave | 0.33mi | 3/2.0 | 975 (+7%) | 1mo | $160,000 | $164 | 70 |
| 2232 N Nevada Ave | 0.17mi | 3/1.0 | 816 (-10%) | 5mo | $151,000 | $185 | 68 |
| 2003 N Fairmount St | 0.39mi | 2/1.5 (-1) | 960 (+5%) | 3mo | $140,000 | $146 | 66 |
| 2027 N Michigan Ave | 0.36mi | 3/1.0 | 832 (-9%) | 2mo | $172,400 | $207 | 64 |
| 2103 N. Michigan Ave | 0.33mi | 3/1.0 | 832 (-9%) | 4mo | $137,500 | $165 | 64 |
| 2216 Jebens Ave | 0.74mi | 3/1.5 | 912 (0%) | 2mo | $165,000 | $181 | 64 |
| 2210 N Nevada Ave | 0.21mi | 2/1.0 (-1) | 816 (-10%) | 3mo | $160,000 | $196 | 63 |
| 2314 N Birchwood Ave | 0.58mi | 3/1.5 | 960 (+5%) | 6mo | $200,900 | $209 | 59 |
| 2926 W Lombard St | 0.54mi | 3/1.0 | 1,034 (+13%) | 4mo | $195,000 | $189 | 48 |
Match score weights: distance 35% · size 25% · config 20% · recency 20%. Top-matched comps best support the ARV.
Projected returns pro-forma
3.0% appreciation · 3.0% rent growth · sell at horizon
- IRR
- -5.1%
- Equity multiple
- 0.70×
- Total profit
- $-15,377
- Equity at exit
- $83,184
- IRR
- -0.2%
- Equity multiple
- 0.96×
- Total profit
- $-1,881
- Equity at exit
- $128,196
Cash invested: $51,800 (down + closing). Projections, not guarantees.
Landlord ↔ Tenant lean methodology
- Overall (STATE)
- 83 Strongly Landlord-Friendly
- State Iowa
- 83 Strongly Landlord-Friendly · R+6
- County
- — inherits STATE
- City
- — inherits STATE
ZIP-level market 50804
- Active inventory
- 2
- Price-to-rent
- 17.6×
Monthly cashflow live
- Estimated rent
- $878 high interval (Pro) →
- Mortgage (P&I)
- −$970
- Tax from tax record
- −$238 /mo · $2,854/yr
- Insurance
- −$77
- HOA
- −$0
- Vacancy / Maint / Mgmt
- −$184
- Net cashflow
- $-592
Break-even live
UW: 25.0% down · 7.5% · 30yr · 1.5% tax · 5.0% vac · 8.0% maint · 8.0% mgmt
Financing live
Cash to close
- Down payment
- $46,250
- Closing costs
- $5,550
- Reserves months
- —
- Total cash needed
- —
Loan-product check · same deal, 3 products live
Conventional
25% down · 7.5% · 30yr
- Down + closing
- —
- Monthly P&I
- —
- Monthly cashflow
- —
- DSCR
- —
- Eligible?
- —
Personal DTI + credit; lowest rate.
DSCR
20% down · 8.5% · 30yr
- Down + closing
- —
- Monthly P&I
- —
- Monthly cashflow
- —
- DSCR
- —
- Eligible?
- —
No personal income docs; deal must DSCR.
Hard money
10% down · 12.0% · 12mo
- Down + closing
- —
- Monthly P&I
- —
- Monthly cashflow
- —
- DSCR
- —
- Eligible?
- —
Short-term bridge; refi at stabilization.
Rent comps 5 comps
| Address | Beds | Baths | Sqft | Rent | $/sqft | DOM | Units | Dist |
|---|---|---|---|---|---|---|---|---|
| 2827 N Elsie Ave Unit 3 Davenport, IA | 2.0 | 1.0 | 610 | $900 | $1.48 | 13d | 1 | 0.39mi |
| 3553 Heatherton Dr Davenport, IA | 1.0–2.0 | 1.0 | 690 | $875 | $1.27 | 13d | 2 | 0.43mi |
| 3536 Heatherton Dr Unit 4 Davenport, IA | 2.0 | 1.0 | 700 | $825 | $1.18 | 13d | 1 | 0.43mi |
| 901 W 15th St Davenport, IA | 1.0–2.0 | 1.0–2.0 | 950 | $895 | $0.94 | 13d | 1 | 1.12mi |
| 2608 Wilkes Ave Davenport, IA | 2.0 | 1.0 | 755 | $950 | $1.26 | 21d | 1 | 1.33mi |
Listing history 1 events
-
2026-05-20$185,000 Active
ⓘ Source: listings_history table (triggers on properties + properties_extension) + one-shot
backfill from property_details.listing_events for pre-trigger history.
Tax reassessment forecast IA · Partial reset (capped growth)
- Current annual tax
- $2,854 · $238/mo
- Projected year-2 tax
- $2,879 · $240/mo
- Expected delta
- +$25/yr (+$2/mo · 0.9%)
ⓘ Screening estimate from a state-policy table — verify with the county assessor before closing.
Climate risk First Street
- Flood 1/10 Low FEMA zone X (unshaded) · 0% chance over 30 yrs
- Wildfire 1/10 Low
- Heat 3/10 Moderate 7 d/yr ≥103°F today · 16 d/yr by 30 yrs out
- Wind 2/10 Low
- Air quality 3/10 Moderate 2 unhealthy d/yr today · 3 by 30 yrs out
Nearby sold comps map
Loading sold comps map…
Walkable amenities ~0.75 mi
Loading nearby amenities…
Taxation est. · year 1
- Rental income
- $10,533
- − Mortgage interest
- −$10,363
- − Property taxes
- −$2,854
- − Insurance
- −$925
- − Repairs & maintenance
- −$843
- − Management
- −$843
- − Depreciation
- −$5,382
- Taxable loss
- −$10,676
- Est. tax savings @ 24.0%
- +$2,562
- After-tax cash flow
- $-4,537/yr
For passive investors: Depreciation is non-cash, so a rental often shows a tax loss while cash-flowing — sheltering income. Rental losses are passive: they offset passive income freely, and up to $25,000/yr can offset ordinary (W-2) income if you actively participate and your MAGI is under $100k (phasing out to $0 by $150k); unused losses carry forward. On sale, claimed depreciation is recaptured at up to 25%, and gains may owe capital-gains tax (a 1031 exchange can defer both). Figures are a year-1 estimate at your 24.0% rate — not tax advice; consult a CPA.
Schools (NCES district)
- District
- Davenport Community School District
- NCES district ID
- 1908580
- Math proficiency
- 43% ▼ -11.00%
- Reading proficiency
- 50% ▼ -3.00%
- Median HH income
- $46,157
- Composite
- 39.49/100
- National rank
- #3951
- State rank
- #288 of 289 in IA
Livability — Davenport
- Score
- 79/100
- State rank
- #126
- US rank
- #2312
Category grades
Schools grade is shown separately in the Schools card above.
Census & demographics
- Census place
- Davenport, IA
Population outlook (Scott County) Hauer SSP2
- Today (2025)
- 188,878 people
- By 2030
- 196,648 · +4.1%
- By 2040
- 210,860 · +11.6%
- By 2050
- 224,359 · +18.8%
- By 2075
- 258,884 · +37.1%
- By 2100
- 286,447 · +51.7%
Not yet ingested
- Political lean
- —
- Race & ethnicity
- —
- Common origin
- —
- Civics
- —
Market trends
- HPI YoY
- —
- Current HPI
- —
- Rent YoY
- —
- Metro
- —
- State GDP YoY
- ▲ 2.48%
- F500 in state
- 4
Industry mix (Fortune 500 HQ in IA)
| Industry | F500 HQs | Revenue |
|---|---|---|
| Financial Services | 1 | $16B |
|
||
| Retail / Convenience | 1 | $15B |
|
||
Price history
1 event — show timeline
- 2026-05-20 Listed $185,000 MRED as Distributed by MLS Grid
Property tax history
+4.5%/yrLatest (2025): $2,854 · +27.1% YoY. Source: county tax records.
Cash-flow waterfall
monthlySold comps — $/sqft
last 12 mo · ≤1 miLoading sold comps…