1209 N Cottonwood Dr · Midwest City, OK
Flood risk 1/10 · Minimal
- FEMA flood zone
- X (unshaded)
- Chance of flooding over 30 yrs
- 0.0%
- Est. flood insurance / yr
- $507 – $1,088
Fire risk 3/10 · Minor
- Est. fire insurance / yr
- $2,463 – $4,575
Heat risk 5/10 · Moderate
- Hot days now (above 107°F)
- 7 days/yr
- Hot days in 30 yrs
- 17 days/yr
Wind risk 3/10 · Minor
- Chance of severe wind over 30 yrs
- 5.0%
Air-quality risk 2/10 · Minimal
- Unhealthy air days now
- 1 days/yr
- Unhealthy air days in 30 yrs
- 2 days/yr
Risk factors via First Street. Map © Google.
Why this score? — see what drove the B- grade
The composite is a weighted blend of 9 inputs, each scored 0–100. Each bar is that input's sub-score; the figure is the points it added to the 100-point composite (weight × sub-score).
- Cash flow +26.3/30.0
- ARV discount +15.0/15.0
- DSCR +8.9/10.0
- 1% rule +6.3/10.0
- Rent growth +3.9/5.0
- Livability +3.6/5.0
- Condition / age +2.5/5.0
- Schools +0.7/10.0
- Appreciation +0.0/10.0
$125,000
🖨 Deal sheet 📄 Offer letter ✓ Due diligence
Listing remarks
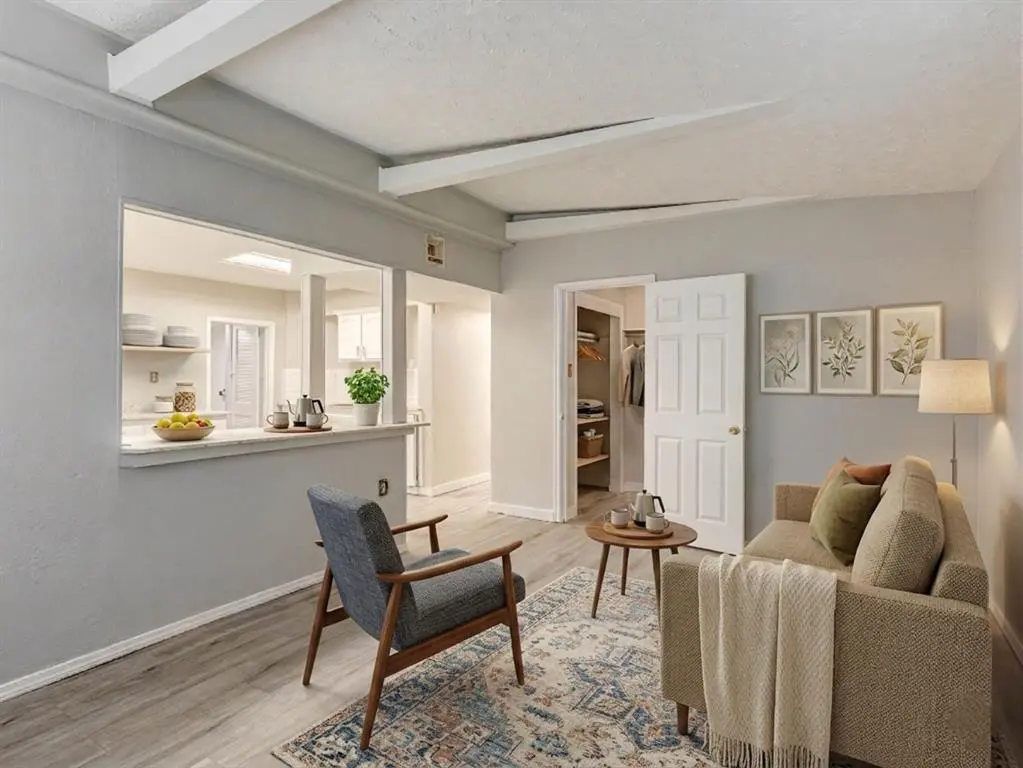
Charming 3-bedroom, 1-bath home in the heart of Midwest City! Recently updated with fresh interior paint and brand-new flooring throughout, this home is move-in ready. The HVAC system has been service, and the well and septic system has been recently inspected and cleaned by Irwin Septic Co. The living area flows into a spacious kitchen featuring ample cabinet space, generous countertops, and a breakfast bar. Enjoy an oversized bathroom and a functional, comfortable layout. Outside, the backyard is fully fenced with mature trees, a detached garage with power and storage, a storage shed, and a chicken coop. Conveniently located near Tinker Air Force Base, I-40, and I-35—ideal for first
Key facts
- Generous countertops
- New flooring
- Spacious kitchen
Tags
Property features AI
Finance
- Other: Homestead property; Livestock allowed
- Financial info: Financing available: Cash, Conventional, FHA or VA; Loan qualification possible; Not assumable
- HOA & community: No mandatory association dues
Exterior
- Parking: Gravel parking; Backyard parking; 2-car garage
- Utilities: Electricity available; High-speed internet available; Public water; Septic tank
- Home design: Single family residence; One level; East-facing
- Construction: Vinyl siding exterior; Metal roof (replaced 2018); Aluminum frame windows; Slab foundation; Built/existing property
- Exterior features: Open patio; Outbuildings; Exterior storage; Chain link fencing; Wooded lot
Interior
- Kitchen: Electric freestanding range/oven; Dishwasher; Disposal; Water heater
- Bedrooms: 3 bedrooms
- Flooring: Vinyl flooring
- Bathrooms: 1 full bathroom
- Heating & cooling: Electric heating
- Interior features: Open patio access; Outbuildings and exterior storage; Inside utility
- Laundry & utility: Utility room inside
Neighborhood map
What this means for you Summary
Snapshot
- This is a 3-bed/1.0-bath single-family listed at $125k.
Deal economics
- At list price, monthly cash flow is $321 ($4k/yr) — positive.
- The deal already cash-flows at list — no discount required.
- Meets the 1% rule at list price ($1k rent vs $125k).
- Recommended offer: $123k (1.5% below list) — sets the bar for market timing.
- Cap rate 9.4% vs local median 5.6% in Midwest City — top-decile yield for the area; either an underpriced asset or a hidden risk that comps aren't pricing in. Stress-test before assuming the spread holds.
Location & tenants
- Location reads 71/100 on livability (#30 in OK) — a middle-class / working-renter tenant base. Strengths: cost of living A+, housing A+, health & safety A; Watch: crime D+, schools D, employment D.
- Oklahoma City (urban): math 7% / reading 10% proficiency, ranked #254 of 270 in OK (top 94%) — low school quality limits family demand, transient renter base, plan for 1-2y turnover; 82% free/reduced lunch — lower-income household profile, screen leases tightly.
- Market conditions: Rents rising fast (+5.7%/yr); 160 active listings in the ZIP; 32 comparable units currently listed for rent nearby; rentals at typical pace (median 16d on market — plan ~3-4 weeks tenant-placement turnaround); 5,365 units permitted in Oklahoma County in 2024 (569 in 5+ unit buildings).
Forward outlook
- Local home prices are declining (-3.0%/yr); year-one equity from $864 of loan paydown is wiped out by about $4k of value loss. Plan a longer hold.
- Oklahoma County population projected at +41% by 2050 — long-run rental-demand tailwind backs the buy-and-hold thesis.
- At projected returns (-3.0% appreciation + 5.7% rent growth), your $35k cash investment doubles in ~8 years — after that, you're playing with house money.
Negotiation context
- It's been on market 15 days — a 2% lower offer ($123k) is reasonable based on typical stale-listing flexibility.
- 8 sale attempts since 20y ago with the ask held roughly flat each time — persistent listings suggest the price (not the market) is what's stuck; bring a comps-based counter.
- Current owner paid $88k; 42% above their basis — modest negotiation headroom, anchor on the comps not their cost.
Risks & watch-outs
- Climate carrying-cost: extreme-heat days projected 7→17/yr by 2055 (HVAC capex compounding) — expect insurance premiums to compound above CPI over the hold.
Questions for the listing agent
- Built in 1960 — when were the roof, HVAC, electrical panel, plumbing, and water heater last replaced?
- Is there a deadline driving the sale (1031 exchange, divorce, estate, relocation)? That informs how much negotiation room exists.
- Schools are D-rated, which usually means shorter tenancies and higher turnover. Who's the typical renter profile here, and what's been the actual vacancy rate?
- Crime grade is D in this area — have there been break-ins, vandalism, or insurance claims at this property in the last 3 years? What carrier currently insures it and at what premium?
- What's the average days-on-market for RENTAL listings here right now (not sales)? A rising rental-DOM trend means longer vacancies and softer asking-rent achievability than the comps imply.
- What's the recent tenant-quality profile in this submarket — average credit score on applications, eviction rate, late-payment / NSF rate, and stable-employment percentage? A property-management company in the area should have these aggregated.
- How much new for-sale + rental construction is in the pipeline within 1–3 miles? Heavy new supply typically softens prices + rents 12–24 months out; constrained supply supports both.
Investment metrics
- 1% rule
- 1.13% ✓
- Cap rate
- 9.37%
- Cash-on-cash
- 11.00%
- DSCR
- 1.49
- GRM
- 7.4
CMA / ARV
- ARV (median comp)
- $154,753
- List price
- $125,000
- Delta
- -19.23%
- Verdict
- UNDERPRICED
- Comps
- 20 within 1.0 mi
Show comp detail 12 sales within ~0.75 mi
| Address | Dist | Beds/Ba | Sqft | Sold | Price | $/sf | Match |
|---|---|---|---|---|---|---|---|
| 10015 Isaac Dr | 0.24mi | 3/1.5 | 1,142 (-1%) | 1mo | $164,000 | $144 | 84 |
| 10014 Caton Pl | 0.26mi | 3/1.5 | 1,076 (-6%) | 2mo | $145,000 | $135 | 74 |
| 9925 NE 7th St | 0.30mi | 3/1.5 | 1,206 (+5%) | 4mo | $157,000 | $130 | 72 |
| 808 Moraine Ave | 0.47mi | 4/1.5 (+1) | 1,135 (-1%) | 1mo | $150,000 | $132 | 68 |
| 712 N Cedar Dr | 0.66mi | 3/1.0 | 1,119 (-3%) | 0mo | $159,900 | $143 | 64 |
| 645 Lloyd Ave | 0.45mi | 4/1.5 (+1) | 1,186 (+3%) | 3mo | $147,000 | $124 | 64 |
| 9904 Mark Trl | 0.52mi | 3/2.0 | 1,105 (-4%) | 5mo | $175,000 | $158 | 61 |
| 1816 Michell Dr | 0.59mi | 3/2.0 | 1,108 (-4%) | 5mo | $130,000 | $117 | 58 |
| 800 Lotus Ave | 0.40mi | 3/1.0 | 1,000 (-13%) | 3mo | $164,000 | $164 | 57 |
| 701 Royal Ave | 0.45mi | 3/1.5 | 1,006 (-12%) | 2mo | $155,000 | $154 | 55 |
| 1617 Mcgregor Dr | 0.62mi | 3/1.5 | 1,012 (-12%) | 5mo | $105,000 | $104 | 45 |
| 1116 N Timber Rd | 0.68mi | 2/2.0 (-1) | 1,015 (-12%) | 0mo | $310,000 | $305 | 39 |
Match score weights: distance 35% · size 25% · config 20% · recency 20%. Top-matched comps best support the ARV.
Projected returns pro-forma
-3.0% appreciation · 5.73% rent growth · sell at horizon
- IRR
- 3.0%
- Equity multiple
- 1.12×
- Total profit
- $4,148
- Equity at exit
- $18,638
- IRR
- 14.9%
- Equity multiple
- 2.35×
- Total profit
- $47,144
- Equity at exit
- $10,808
Cash invested: $35,000 (down + closing). Projections, not guarantees.
Landlord ↔ Tenant lean methodology
- Overall (STATE)
- 83 Strongly Landlord-Friendly
- State Oklahoma
- 83 Strongly Landlord-Friendly · R+20
- County
- — inherits STATE
- City
- — inherits STATE
ZIP-level market 73130
- Home prices YoY
- -21.0%
- Rents YoY
- 5.7%
- Active inventory
- 160
- Price-to-rent
- 7.4×
Monthly cashflow live
- Estimated rent
- $1,413 high interval (Pro) →
- Mortgage (P&I)
- −$656
- Tax from tax record
- −$87 /mo · $1,049/yr
- Insurance
- −$52
- HOA
- −$0
- Vacancy / Maint / Mgmt
- −$297
- Net cashflow
- $321
Break-even live
UW: 25.0% down · 7.5% · 30yr · 1.5% tax · 5.0% vac · 8.0% maint · 8.0% mgmt
Financing live
Cash to close
- Down payment
- $31,250
- Closing costs
- $3,750
- Reserves months
- —
- Total cash needed
- —
Loan-product check · same deal, 3 products live
Conventional
25% down · 7.5% · 30yr
- Down + closing
- —
- Monthly P&I
- —
- Monthly cashflow
- —
- DSCR
- —
- Eligible?
- —
Personal DTI + credit; lowest rate.
DSCR
20% down · 8.5% · 30yr
- Down + closing
- —
- Monthly P&I
- —
- Monthly cashflow
- —
- DSCR
- —
- Eligible?
- —
No personal income docs; deal must DSCR.
Hard money
10% down · 12.0% · 12mo
- Down + closing
- —
- Monthly P&I
- —
- Monthly cashflow
- —
- DSCR
- —
- Eligible?
- —
Short-term bridge; refi at stabilization.
Rent comps 32 comps
| Address | Beds | Baths | Sqft | Rent | $/sqft | DOM | Units | Dist |
|---|---|---|---|---|---|---|---|---|
| 801 Royal Ave Oklahoma City, OK | 3.0 | 1.0 | 951 | $1,200 | $1.26 | 16d | 1 | 0.32mi |
| 10220 Isaac Dr Oklahoma City, OK | 3.0 | 1.0 | 1106 | $1,250 | $1.13 | 43d | 1 | 0.32mi |
| 9604 NE 11th St Oklahoma City, OK | 4.0 | 1.0 | 1280 | $1,795 | $1.40 | 1d | 1 | 0.41mi |
| 645 Lloyd Ave Oklahoma City, OK | 4.0 | 1.5 | 1186 | $1,650 | $1.39 | 1d | 1 | 0.42mi |
| 10400 Caton Pl Oklahoma City, OK | 3.0 | 2.0 | 1164 | $1,280 | $1.10 | 23d | 1 | 0.43mi |
| 629 Lloyd Ave Oklahoma City, OK | 4.0 | 1.5 | 1213 | $1,095 | $0.90 | 3d | 1 | 0.46mi |
| 9528 McIntosh Ave Oklahoma City, OK | 3.0 | 2.0 | 1164 | $1,195 | $1.03 | 43d | 1 | 0.47mi |
| 1216 McGregor Dr Oklahoma City, OK | 4.0 | 1.5 | 1212 | $1,495 | $1.23 | 2d | 1 | 0.48mi |
| 633 Lotus Ave Oklahoma City, OK | 3.0 | 1.0 | 1038 | $1,300 | $1.25 | 10d | 1 | 0.49mi |
| 1520 Patricia Dr Oklahoma City, OK | 3.0 | 1.0 | 1040 | $1,200 | $1.15 | 43d | 1 | 0.51mi |
| 1525 N Christine Dr Oklahoma City, OK | 3.0 | 1.5 | 1264 | $1,035 | $0.82 | 2d | 1 | 0.56mi |
| 1617 N Christine Dr Oklahoma City, OK | 2.0 | 2.0 | 962 | $1,050 | $1.09 | 23d | 1 | 0.59mi |
| 1400 Alan Ln Oklahoma City, OK | 3.0 | 2.0 | 1288 | $1,495 | $1.16 | 43d | 1 | 0.60mi |
| 1525 McGregor Dr Oklahoma City, OK | 3.0 | 1.5 | 1012 | $1,275 | $1.26 | 1d | 1 | 0.60mi |
| 1817 Tim Dr Oklahoma City, OK | 3.0 | 2.0 | 1373 | $1,399 | $1.02 | 1d | 1 | 0.60mi |
| 1809 Michell Dr Oklahoma City, OK | 3.0 | 1.0 | 1125 | $1,095 | $0.97 | 2d | 1 | 0.61mi |
| 604 Moraine Ave Oklahoma City, OK | 3.0 | 1.5 | 1181 | $1,395 | $1.18 | 1d | 1 | 0.62mi |
| 10601 Tumilty Ter Oklahoma City, OK | 4.0 | 2.0 | 1377 | $1,820 | $1.32 | 23d | 1 | 0.63mi |
| 405 Lotus Ave Oklahoma City, OK | 3.0 | 2.0 | 1300 | $1,611 | $1.24 | 1d | 1 | 0.71mi |
| 1400 Marydale Ave Oklahoma City, OK | 3.0 | 1.0 | 1082 | $1,150 | $1.06 | 15d | 1 | 0.78mi |
| 9212 Jennifer Pl Oklahoma City, OK | 3.0 | 2.0 | 960 | $1,250 | $1.30 | 43d | 1 | 0.88mi |
| 9705 Oak Tree Ter Oklahoma City, OK | 3.0 | 2.0 | 1100 | $1,410 | $1.28 | 10d | 1 | 0.90mi |
| 1620 Cynthia Dr Oklahoma City, OK | 4.0 | 1.0 | 1203 | $1,450 | $1.21 | 43d | 1 | 0.97mi |
| 1617 Cynthia Dr Oklahoma City, OK | 4.0 | 1.0 | 1161 | $1,450 | $1.25 | 43d | 1 | 0.99mi |
| 1168 N Douglas Blvd Oklahoma City, OK | 1.0–2.0 | 1.0 | 725 | $1,020 | $1.41 | 16d | 1 | 1.00mi |
| 217 Saint Charles Way Oklahoma City, OK | 4.0 | 2.0 | 1448 | $1,525 | $1.05 | 23d | 1 | 1.06mi |
| 1619 N Douglas Blvd Oklahoma City, OK | 3.0 | 2.0 | 1152 | $1,129 | $0.98 | 1d | 1 | 1.20mi |
| 8910 Oak Valley Dr Oklahoma City, OK | 2.0 | 2.0 | 935 | $1,000 | $1.07 | 20d | 1 | 1.22mi |
| 910 N Oakview Dr Oklahoma City, OK | 3.0 | 2.0 | 1512 | $1,239 | $0.82 | 1d | 1 | 1.26mi |
| 2008 Midridge Dr Oklahoma City, OK | 3.0 | 2.0 | 1232 | $1,325 | $1.08 | 14d | 1 | 1.42mi |
| 8741 Hillridge Dr Oklahoma City, OK | 3.0 | 2.0 | 1182 | $1,495 | $1.26 | 1d | 1 | 1.46mi |
| 8741 Hillridge Dr Oklahoma City, OK | 3.0 | 2.0 | 1182 | $1,495 | $1.26 | 43d | 1 | 1.46mi |
Listing history 25 events
-
2026-05-08status Pending 809-char remark
-
2026-04-23$125,000 Active 809-char remark
-
2018-05-17soldstatus $88,000
-
2017-11-27soldstatus $42,000
-
2017-03-15soldstatus $170,000
-
2016-07-15historical
-
2016-04-19price $50,800
-
2016-03-02price $50,900
-
2016-02-03price $55,900
-
2016-02-03price $59,800
-
2016-01-13$59,900 Active
-
2014-08-25historical
-
2014-03-17$57,000
-
2013-10-03historical
-
2012-03-05$63,000
-
2012-03-01historical
-
2011-10-18$47,500
-
2011-09-24historical
-
2010-10-19$53,900
-
2010-10-02historical
-
2009-10-14$69,000
-
2006-11-27soldstatus $40,000
-
2006-11-17soldstatus $40,000
-
2006-09-04$49,900
-
1993-04-27soldstatus $15,000
ⓘ Source: listings_history table (triggers on properties + properties_extension) + one-shot
backfill from property_details.listing_events for pre-trigger history.
Tax reassessment forecast OK · Resets to sale price
- Current annual tax
- $1,049 · $87/mo
- Projected year-2 tax
- $1,125 · $94/mo
- Expected delta
- +$76/yr (+$6/mo · 7.2%)
ⓘ Screening estimate from a state-policy table — verify with the county assessor before closing.
Climate risk First Street
- Flood 1/10 Low FEMA zone X (unshaded) · 0% chance over 30 yrs
- Wildfire 3/10 Moderate
- Heat 5/10 Major 7 d/yr ≥107°F today · 17 d/yr by 30 yrs out
- Wind 3/10 Moderate 5% chance of damaging wind over 30 yrs
- Air quality 2/10 Low 1 unhealthy d/yr today · 2 by 30 yrs out
Nearby sold comps map
Loading sold comps map…
Walkable amenities ~0.75 mi
Loading nearby amenities…
Taxation est. · year 1
- Rental income
- $16,951
- − Mortgage interest
- −$7,002
- − Property taxes
- −$1,049
- − Insurance
- −$625
- − Repairs & maintenance
- −$1,356
- − Management
- −$1,356
- − Depreciation
- −$3,636
- Taxable income
- $1,926
- Est. tax owed @ 24.0%
- −$462
- After-tax cash flow
- $3,389/yr
For passive investors: Depreciation is non-cash, so a rental often shows a tax loss while cash-flowing — sheltering income. Rental losses are passive: they offset passive income freely, and up to $25,000/yr can offset ordinary (W-2) income if you actively participate and your MAGI is under $100k (phasing out to $0 by $150k); unused losses carry forward. On sale, claimed depreciation is recaptured at up to 25%, and gains may owe capital-gains tax (a 1031 exchange can defer both). Figures are a year-1 estimate at your 24.0% rate — not tax advice; consult a CPA.
Schools (NCES district)
- District
- Oklahoma City
- NCES district ID
- 4022770
- Math proficiency
- 7% ▼ -5.00%
- Reading proficiency
- 10% ▼ -6.00%
- Median HH income
- $35,606
- Composite
- 7.0/100
- National rank
- #9970
- State rank
- #254 of 270 in OK
Livability — Midwest City
- Score
- 71/100
- State rank
- #30
- US rank
- #6637
Category grades
Schools grade is shown separately in the Schools card above.
Census & demographics
- Census place
- Midwest City, OK
- County
- Oklahoma County · 771,644 people
- City population
- 57,386
- Metro
- Oklahoma City, OK
- Population (ZIP)
- 21,476
- Household income
- $71,189
- Rent vs Own
- Severe rent burden
- 378.0
Population outlook (Oklahoma County) Hauer SSP2
- Today (2025)
- 911,875 people
- By 2030
- 982,413 · +7.7%
- By 2040
- 1,130,468 · +24.0%
- By 2050
- 1,288,422 · +41.3%
- By 2075
- 1,711,482 · +87.7%
- By 2100
- 2,088,448 · +129.0%
Race, ethnicity, and origin ACS 2023
- Neighborhood character
- Diverse neighborhood (Simpson 0.60)
- Race & ethnicity
- White 60% Black 18% Two or more races 14% Hispanic / Latino 7% Asian 2% Native American 2%
- Hispanic origin (detail)
- Mexican 6%
- Common ancestry
- Lithuanian 2% Slovak 2% Italian 2%
- Foreign-born
- 3% · Canada
- Languages at home
- 95% English-only · Spanish 3% Tagalog/Filipino 1%
Political lean MEDSL · Oklahoma
- 2024 margin
- Toss-up / Even · D 48.0% · R 49.7% · Other 2.3%
- 2008→2024 swing
- +15.1pp toward D · 2008: -16.8pp · 2024: -1.7pp
- All cycles
- 2024: R+1.7 2020: R+1.1 2016: R+10.5 2012: R+16.7 2008: R+16.8
Not yet ingested
- Civics
- —
Market trends
- HPI YoY
- ▼ -65.22%
- Current HPI
- 245.8385
- Rent YoY
- ▲ 5.73%
- Metro
- Oklahoma City, OK
- State GDP YoY
- ▲ 1.55%
- F500 in state
- 6
Industry mix (Fortune 500 HQ in OK)
| Industry | F500 HQs | Revenue |
|---|---|---|
| Energy | 3 | $48B |
|
||
Price history
+733.3% since first listed25 events — show timeline
- 2026-05-08 Pending — MLSOK
- 2026-04-23 Listed $125,000 MLSOK
- 2018-05-17 Sold (Public Records) $88,000 Public Records
- 2017-11-27 Sold (Public Records) $42,000 Public Records
- 2017-03-15 Sold (Public Records) $170,000 Public Records
- 2016-07-15 Listing Removed — MLSOK
- 2016-04-19 Price Changed $50,800 MLSOK
- 2016-03-02 Price Changed $50,900 MLSOK
- 2016-02-03 Price Changed $55,900 MLSOK
- 2016-02-03 Price Changed $59,800 MLSOK
- 2016-01-13 Listed $59,900 MLSOK
- 2014-08-25 Listing Removed — MLSOK
- 2014-03-17 Listed $57,000 MLSOK
- 2013-10-03 Listing Removed — MLSOK
- 2012-03-05 Listed $63,000 MLSOK
- 2012-03-01 Listing Removed — MLSOK
- 2011-10-18 Listed $47,500 MLSOK
- 2011-09-24 Listing Removed — MLSOK
- 2010-10-19 Listed $53,900 MLSOK
- 2010-10-02 Listing Removed — MLSOK
- 2009-10-14 Listed $69,000 MLSOK
- 2006-11-27 Sold (Public Records) $40,000 Public Records
- 2006-11-17 Sold (MLS) $40,000 MLSOK
- 2006-09-04 Listed $49,900 MLSOK
- 1993-04-27 Sold (Public Records) $15,000 Public Records
Property tax history
+6.8%/yrLatest (2025): $1,049 · -0.7% YoY. Source: county tax records.
Cash-flow waterfall
monthlySold comps — $/sqft
last 12 mo · ≤1 miLoading sold comps…