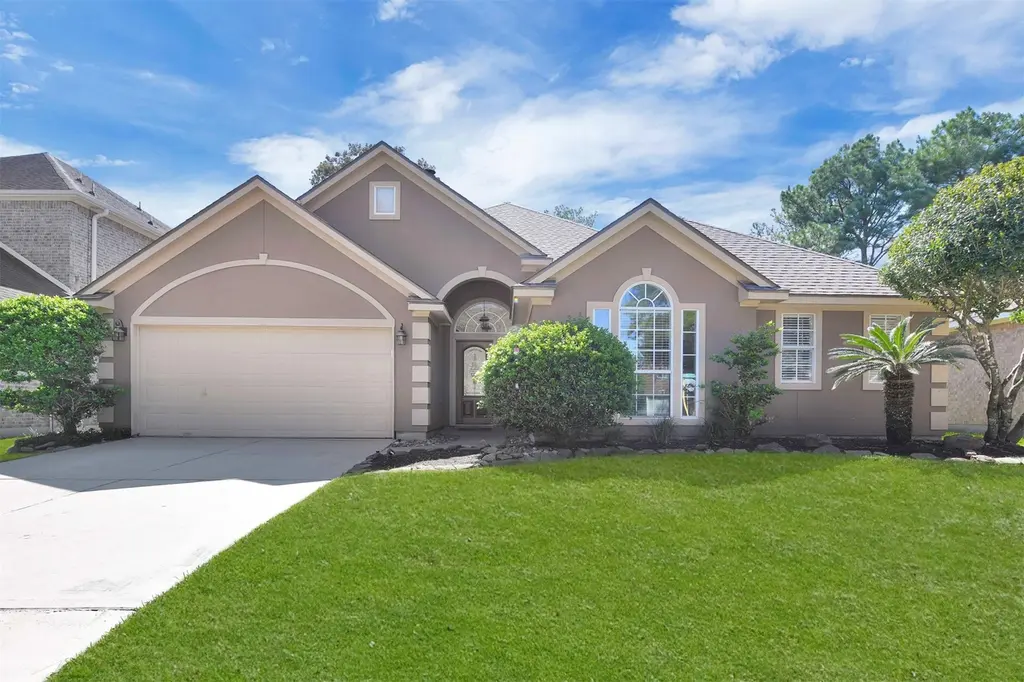
8506 Hunters Village Dr · Atascocita, TX
Flood risk 1/10 · Minimal
- FEMA flood zone
- X (unshaded)
- Chance of flooding over 30 yrs
- 0.0%
- Est. flood insurance / yr
- $507 – $1,088
Fire risk 1/10 · Minimal
- Est. fire insurance / yr
- $1,222 – $2,270
Heat risk 9/10 · Severe
- Hot days now (above 110°F)
- 7 days/yr
- Hot days in 30 yrs
- 24 days/yr
Wind risk 9/10 · Severe
- Chance of severe wind over 30 yrs
- 99.0%
Air-quality risk 2/10 · Minimal
- Unhealthy air days now
- 2 days/yr
- Unhealthy air days in 30 yrs
- 2 days/yr
Risk factors via First Street. Map © Google.
Why this score? — see what drove the D grade
The composite is a weighted blend of 9 inputs, each scored 0–100. Each bar is that input's sub-score; the figure is the points it added to the 100-point composite (weight × sub-score).
- Cash flow +9.0/30.0
- ARV discount +8.7/15.0
- Appreciation +4.5/10.0
- Schools +3.9/10.0
- 1% rule +3.7/10.0
- Livability +3.5/5.0
- DSCR +2.5/10.0
- Rent growth +2.5/5.0
- Condition / age +2.5/5.0
$329,000
🖨 Deal sheet (PDF) 📄 Offer letter ✓ Due diligence
Listing remarks
An upgraded Halligan Home nestled on a prime golf course lot (tee box). One-Story treasure boasts an open/split floor plan, 4 spacious bedrooms with walk-in closets & 2 updated bathrooms. Dedicated home office/study is a plus. Expansive master suite & living area, designed with relaxation & family time in mind. The chefs island kitchen is a culinary dream, complete with NEWER SS APPLIANCES, updated QUARTZ countertops & ample space for hosting memorable gatherings. Updated fixtures, NEWER WATER HEATER, recessed lighting, LVP & tile flooring throughout the home ensure durability & ease of maintenance, making this home pet/child ready. The architectural char
Key facts
- Golf course lot
- Stamped concrete
- Chefs island kitchen
Tags
Property features AI
Finance
- HOA & community: Community association: SPECTRUM; Annual association fee; Association amenities include clubhouse, pool, fitness center, playground, tennis courts, pickleball, trails, dog park, boat ramp, guard; Association fee covers common areas and recreation facilities
Exterior
- Parking: Attached 2-car garage; Driveway; Garage with garage door opener
- Security: Owned security system; Smoke detectors
- Utilities: Public water; Public sewer
- Home design: Residential property; Slab foundation; Composition roof; Built in 2000; Living area approximately 2,550
- Construction: Cement siding; Stucco; Wood siding
- Exterior features: Covered patio; Deck; Patio; Fully fenced backyard; Private yard; Sprinkler/irrigation; Tennis court(s); On/near golf course; Subdivision; Side yard
Interior
- Kitchen: Dishwasher; Disposal; Gas oven; Gas range; Microwave
- Bedrooms: Primary bedroom on first floor (22 x 14); Additional bedrooms on first floor (13 x 11; 11 x 11; 11 x 11) — up to 4 bedrooms possible
- Flooring: Plank flooring; Tile; Vinyl
- Bathrooms: 2 full bathrooms; Primary bathroom on first floor (15 x 9)
- Heating & cooling: Central heating (gas); Central air conditioning (electric)
- Interior features: Crown molding; Double vanity; Entrance foyer; High ceilings; Jetted tub; Kitchen island; Kitchen/family room combo; Pantry; Quartz counters; Separate shower; Tub/shower; Window treatments; Ceiling fans; Gas fireplace (1)
- Laundry & utility: Washer hookup; Electric dryer hookup; Gas dryer hookup; Utility room on first floor (7 x 6)
Neighborhood map
What this means for you Summary
Snapshot
- This is a 4-bed/2.0-bath single-family listed at $329k.
Deal economics
- At list price, monthly cash flow is $-257 ($-3k/yr) — negative.
- To cash-flow at today's rent, offer at most $284k (13.8% below list).
- To meet the 1% rule (rent ≥ 1% of price), the offer needs to be $286k (13.1% below list).
- Recommended offer: $284k (13.8% below list) — sets the bar for cash-flow.
- Cap rate 5.4% vs local median 4.0% in Atascocita — top-decile yield for the area; either an underpriced asset or a hidden risk that comps aren't pricing in. Stress-test before assuming the spread holds.
Location & tenants
- Location reads 70/100 on livability (#346 in TX) — a middle-class / working-renter tenant base. Strengths: employment A+, cost of living A+, housing A+; Watch: amenities F, commute F, health & safety F.
- Humble ISD (urban): math 38% / reading 44% proficiency, ranked #262 of 826 in TX (top 32%) — families likely to look elsewhere, expect single-tenant / working-renter base with shorter leases.
- Zoned schools: Maplebrook El (math 19% / reading 30%, grade F, #3,052 of 4,322 statewide, top 74%, 592 students, 52% FRL); Atascocita Middle (math 35% / reading 40%, grade F, #736 of 1,662 statewide, top 45%, 1,027 students, 50% FRL); Humble H S (math 15% / reading 31%, grade F, #1,348 of 1,632 statewide, top 83%, 2,867 students, 77% FRL) — zoned schools average 60% FRL vs 32% district-wide (28 pts higher); higher-poverty schools than district average — tighter screening recommended.
- Zoned-school proficiency averages 28% at this address vs 41% district-wide (-13 pts) — the specific schools serving this property underperform the Humble ISD average; the district grade overstates school quality for this exact location.
- Market conditions: Rents flat; 682 active listings in the ZIP; 6 comparable units currently listed for rent nearby; rentals at typical pace (median 24d on market — plan ~3-4 weeks tenant-placement turnaround); high-income renter base; 29,883 units permitted in Harris County in 2024 (8,621 in 5+ unit buildings).
Forward outlook
- Local home prices are declining (-0.9%/yr); year-one equity from $2k of loan paydown is wiped out by about $3k of value loss. Plan a longer hold.
- Harris County population projected at +47% by 2050 — long-run rental-demand tailwind backs the buy-and-hold thesis.
Negotiation context
- It's been on market 30 days — a 2% lower offer ($324k) is reasonable based on typical stale-listing flexibility.
- 6 sale attempts since 17y ago with the ask held roughly flat each time — persistent listings suggest the price (not the market) is what's stuck; bring a comps-based counter.
Risks & watch-outs
- Climate carrying-cost: severe wind risk, 99% chance of damaging wind over 30y; extreme-heat days projected 7→24/yr by 2055 (HVAC capex compounding) — expect insurance premiums to compound above CPI over the hold.
Questions for the listing agent
- What do current leases actually rent for vs. the listed asking? Can we see a recent rent roll and the last 12 months of T-12 income?
- What does the HOA fee cover, when was the last increase, and are there any pending special assessments or reserve-fund shortfalls?
- Is there a deadline driving the sale (1031 exchange, divorce, estate, relocation)? That informs how much negotiation room exists.
- The area grade is low — what's the realistic commute time and amenity access for the typical tenant pool here? Any planned neighborhood developments (good or bad) we should know about?
- What's the average days-on-market for RENTAL listings here right now (not sales)? A rising rental-DOM trend means longer vacancies and softer asking-rent achievability than the comps imply.
- What's the recent tenant-quality profile in this submarket — average credit score on applications, eviction rate, late-payment / NSF rate, and stable-employment percentage? A property-management company in the area should have these aggregated.
- How much new for-sale + rental construction is in the pipeline within 1–3 miles? Heavy new supply typically softens prices + rents 12–24 months out; constrained supply supports both.
Investment metrics
- 1% rule
- 0.87% ✗
- Cap rate
- 5.36%
- Cash-on-cash
- -3.35%
- DSCR
- 0.85
- GRM
- 9.6
CMA / ARV
- ARV (median comp)
- $338,230
- List price
- $329,000
- Delta
- 0.23%
- Verdict
- FAIR
- Comps
- 20 within 2.0 mi
Show comp detail 12 sales within ~0.75 mi
| Address | Dist | Beds/Ba | Sqft | Sold | Price | $/sf | Match |
|---|---|---|---|---|---|---|---|
| 18503 Pheasant Field Dr | 0.08mi | 3/3.0 (-1) | 2,629 (+4%) | 0mo | $328,000 | $125 | 80 |
| 8015 Silver Lure Dr | 0.41mi | 4/2.5 | 2,624 (+4%) | 0mo | $389,000 | $148 | 72 |
| 18811 Polo Meadow Dr | 0.72mi | 4/2.0 | 2,532 (+1%) | 0mo | $360,000 | $142 | 65 |
| 8122 Silver Lure Dr | 0.33mi | 4/2.5 | 2,808 (+12%) | 2mo | $298,999 | $106 | 62 |
| 18906 Tranquility Dr | 0.47mi | 4/3.0 | 2,709 (+8%) | 2mo | $429,000 | $158 | 60 |
| 18003 Svensson Slade Ln | 0.43mi | 4/2.5 | 2,800 (+11%) | 2mo | $285,000 | $102 | 58 |
| 18130 Millau Viaduct Way | 0.40mi | 3/2.5 (-1) | 2,285 (-9%) | 2mo | $349,999 | $153 | 58 |
| 18910 Hikers Trail Dr | 0.51mi | 4/2.5 | 2,806 (+11%) | 0mo | $440,000 | $157 | 55 |
| 18711 Leisure Place Dr | 0.54mi | 4/2.5 | 2,790 (+11%) | 1mo | $459,900 | $165 | 54 |
| 7803 Deerwood Lake Dr | 0.52mi | 5/3.5 (+1) | 2,684 (+7%) | 1mo | $309,900 | $115 | 53 |
| 8214 Bosphorus St | 0.51mi | 5/2.5 (+1) | 2,750 (+9%) | 1mo | $369,990 | $135 | 53 |
| 19142 Sprinters Dr | 0.75mi | 3/2.5 (-1) | 2,756 (+10%) | 2mo | $315,000 | $114 | 40 |
Match score weights: distance 35% · size 25% · config 20% · recency 20%. Top-matched comps best support the ARV.
Projected returns pro-forma
-0.95% appreciation · 0.09% rent growth · sell at horizon
- IRR
- -12.5%
- Equity multiple
- 0.47×
- Total profit
- $-48,393
- Equity at exit
- $80,141
- IRR
- -8.6%
- Equity multiple
- 0.28×
- Total profit
- $-66,415
- Equity at exit
- $84,773
Cash invested: $92,120 (down + closing). Projections, not guarantees.
Landlord ↔ Tenant lean methodology
- Overall (STATE)
- 87 Strongly Landlord-Friendly
- State Texas
- 87 Strongly Landlord-Friendly · R+5
- County
- — inherits STATE
- City
- — inherits STATE
ZIP-level market 77346
- Home prices YoY
- -0.4%
- Rents YoY
- 0.1%
- Active inventory
- 682
- Price-to-rent
- 9.6×
Monthly cashflow live
- Estimated rent
- $2,859 high interval (Pro) →
- Mortgage (P&I)
- −$1,725
- Tax from tax record
- −$614 /mo · $7,366/yr
- Insurance
- −$137
- HOA
- −$39
- Vacancy / Maint / Mgmt
- −$600
- Net cashflow
- $-257
Break-even live
Sensitivity live
| Price | -10% $-71 | -5% $-164 | +0% $-257 | +5% $-350 | +10% $-443 |
|---|---|---|---|---|---|
| Rent | -10% $-483 | -5% $-370 | +0% $-257 | +5% $-144 | +10% $-31 |
| Rate | -1.0pp $-91 | -0.5pp $-173 | base $-257 | +0.5pp $-342 | +1.0pp $-429 |
UW: 25.0% down · 7.5% · 30yr · 1.5% tax · 5.0% vac · 8.0% maint · 8.0% mgmt
Financing live
Cash to close
- Down payment
- $82,250
- Closing costs
- $9,870
- Reserves months
- —
- Total cash needed
- —
Loan-product check · same deal, 3 products live
Conventional
25% down · 7.5% · 30yr
- Down + closing
- —
- Monthly P&I
- —
- Monthly cashflow
- —
- DSCR
- —
- Eligible?
- —
Personal DTI + credit; lowest rate.
DSCR
20% down · 8.5% · 30yr
- Down + closing
- —
- Monthly P&I
- —
- Monthly cashflow
- —
- DSCR
- —
- Eligible?
- —
No personal income docs; deal must DSCR.
Hard money
10% down · 12.0% · 12mo
- Down + closing
- —
- Monthly P&I
- —
- Monthly cashflow
- —
- DSCR
- —
- Eligible?
- —
Short-term bridge; refi at stabilization.
Rent comps 6 comps
| Address | Beds | Baths | Sqft | Rent | $/sqft | DOM | Units | Dist |
|---|---|---|---|---|---|---|---|---|
| 19119 Sprintwood Ct Humble, TX | 4.0 | 2.5 | 2487 | $2,425 | $0.98 | 24d | 1 | 0.65mi |
| 18431 Sailfish Cove Dr Humble, TX | 4.0 | 3.0 | 3264 | $2,445 | $0.75 | 12d | 1 | 0.69mi |
| 18718 Walden Forest Dr Humble, TX | 4.0 | 2.0 | 2224 | $2,600 | $1.17 | 4d | 1 | 0.76mi |
| 19603 Fairway Island Dr Humble, TX | 5.0 | 2.5 | 3329 | $6,500 | $1.95 | 26d | 1 | 1.29mi |
| 7131 Maple Walk Dr Humble, TX | 3.0 | 2.0 | 1808 | $1,895 | $1.05 | 7d | 1 | 1.35mi |
| 13513 Northline Lake Dr Houston, TX | 3.0 | 3.0 | 2034 | $2,800 | $1.38 | 45d | 1 | 1.35mi |
HOA detail
- Monthly dues
- $39 · $468/yr
- Likely covers
- water
Listing history 30 events
-
2026-06-21days on market $329,000 Active 30 DOM
-
2026-06-18days on market $329,000 Active 27 DOM
-
2026-06-17days on market $329,000 Active 26 DOM
-
2026-06-16days on market $329,000 Active 25 DOM
-
2026-06-15days on market $329,000 Active 24 DOM
-
2026-06-13days on market $329,000 Active 22 DOM
-
2026-06-13days on market $329,000 Active 21 DOM
-
2026-06-09days on market $329,000 Active 18 DOM
-
2026-06-08days on market $329,000 Active 17 DOM
-
2026-06-07days on market $329,000 Active 16 DOM
-
2026-06-04days on market $329,000 Active 13 DOM
-
2026-06-03days on market $329,000 Active 12 DOM
-
2026-06-02days on market $329,000 Active 11 DOM
-
2026-06-01days on market $329,000 Active 10 DOM
-
2026-05-31days on market $329,000 Active 9 DOM
-
2026-02-02$339,000 Active 1029-char remark
-
2024-08-13historical
-
2024-08-01price $345,000
-
2024-06-18price $354,000
-
2024-05-05status Active
-
2024-05-01status Option Pending
-
2024-02-25$369,000 Active
-
2024-02-23historical $2,400
-
2023-12-13price $2,400
-
2023-11-28price $2,500
-
2023-11-16price $2,600
-
2023-10-20$2,700
-
2010-04-26historical
-
2009-09-08$214,900
-
1998-04-09soldstatus
ⓘ Source: listings_history table (triggers on properties + properties_extension) + one-shot
backfill from property_details.listing_events for pre-trigger history.
Tax reassessment forecast TX · Resets to sale price
- Current annual tax
- $7,366 · $614/mo
- Projected year-2 tax
- $7,366 · $614/mo
- Expected delta
- $0/yr ($0/mo · 0.0%)
ⓘ Screening estimate from a state-policy table — verify with the county assessor before closing.
Climate risk First Street
- Flood 1/10 Low FEMA zone X (unshaded) · 0% chance over 30 yrs
- Wildfire 1/10 Low
- Heat 9/10 Extreme 7 d/yr ≥110°F today · 24 d/yr by 30 yrs out
- Wind 9/10 Extreme 99% chance of damaging wind over 30 yrs
- Air quality 2/10 Low 2 unhealthy d/yr today · 2 by 30 yrs out
Nearby sold comps map
Loading sold comps map…
Walkable amenities ~0.75 mi
Loading nearby amenities…
Taxation est. · year 1
- Rental income
- $34,304
- − Mortgage interest
- −$18,429
- − Property taxes
- −$7,366
- − Insurance
- −$1,645
- − Repairs & maintenance
- −$2,744
- − Management
- −$2,744
- − HOA
- −$468
- − Depreciation
- −$9,571
- Taxable loss
- −$8,664
- Est. tax savings @ 24.0%
- +$2,079
- After-tax cash flow
- $-1,003/yr
For passive investors: Depreciation is non-cash, so a rental often shows a tax loss while cash-flowing — sheltering income. Rental losses are passive: they offset passive income freely, and up to $25,000/yr can offset ordinary (W-2) income if you actively participate and your MAGI is under $100k (phasing out to $0 by $150k); unused losses carry forward. On sale, claimed depreciation is recaptured at up to 25%, and gains may owe capital-gains tax (a 1031 exchange can defer both). Figures are a year-1 estimate at your 24.0% rate — not tax advice; consult a CPA.
Schools (NCES district)
- District
- Humble ISD
- NCES district ID
- 4823910
- Math proficiency
- 38% ▼ -11.00%
- Reading proficiency
- 44% ▼ -7.00%
- Median HH income
- $83,946
- Composite
- 38.55/100
- National rank
- #4171
- State rank
- #262 of 826 in TX
Livability — Atascocita
- Score
- 70/100
- State rank
- #346
- US rank
- #7586
Category grades
Schools grade is shown separately in the Schools card above.
Census & demographics
- Census place
- Atascocita, TX
- County
- Harris County · 4,702,590 people
- City population
- 79,538
- Metro
- Houston-The Woodlands-Sugar Land, TX
- Population (ZIP)
- 79,538
- Household income
- $122,241
- Rent vs Own
- Severe rent burden
- 1072.0
Population outlook (Harris County) Hauer SSP2
- Today (2025)
- 5,571,493 people
- By 2030
- 6,089,821 · +9.3%
- By 2040
- 7,142,806 · +28.2%
- By 2050
- 8,185,864 · +46.9%
- By 2075
- 10,574,329 · +89.8%
- By 2100
- 12,109,958 · +117.4%
Race, ethnicity, and origin ACS 2023
- Neighborhood character
- Diverse neighborhood (Simpson 0.70)
- Race & ethnicity
- White 42% Hispanic / Latino 28% Black 21% Two or more races 18% Asian 4%
- Hispanic origin (detail)
- Mexican 20% Puerto Rican 2%
- Common ancestry
- Lithuanian 4% Slovak 1% Italian 1%
- Foreign-born
- 10% · Canada, Vietnam, China
- Languages at home
- 78% English-only · Spanish 17% Other Indo-European 1% German/W. Germanic 1%
Political lean MEDSL · Harris
- 2024 margin
- Lean D (+5.5) · D 52.0% · R 46.4% · Other 1.6%
- 2008→2024 swing
- +3.9pp toward D · 2008: 1.6pp · 2024: 5.5pp
- All cycles
- 2024: D+5.5 2020: D+13.3 2016: D+12.4 2012: D+0.1 2008: D+1.6
Not yet ingested
- Civics
- —
Market trends
- HPI YoY
- ▼ -0.95%
- Current HPI
- 218.0478
- Rent YoY
- ▲ 0.09%
- Metro
- Houston-The Woodlands-Sugar Land, TX
- State GDP YoY
- ▲ 3.95%
- F500 in state
- 110
Industry mix (Fortune 500 HQ in TX)
| Industry | F500 HQs | Revenue |
|---|---|---|
| Energy | 16 | $1,198B |
|
||
| Technology | 5 | $198B |
|
||
| Engineering / Construction | 4 | $72B |
|
||
| Energy Services | 3 | $60B |
|
||
| Utilities | 3 | $41B |
|
||
| Healthcare | 2 | $330B |
|
||
Price history
+53.1% since first listed17 events — show timeline
- 2026-05-22 Listing Removed — HARMLS
- 2026-05-22 Listed $329,000 HARMLS
- 2026-02-02 Listed $339,000 HARMLS
- 2024-08-13 Listing Removed — HARMLS
- 2024-08-01 Price Changed $345,000 HARMLS
- 2024-06-18 Price Changed $354,000 HARMLS
- 2024-05-05 Relisted — HARMLS
- 2024-05-01 Pending — HARMLS
- 2024-02-25 Listed $369,000 HARMLS
- 2024-02-23 Rental Removed $2,400 HARMLS
- 2023-12-13 Price Changed $2,400 HARMLS
- 2023-11-28 Price Changed $2,500 HARMLS
- 2023-11-16 Price Changed $2,600 HARMLS
- 2023-10-20 Listed for Rent $2,700 HARMLS
- 2010-04-26 Listing Removed — HARMLS
- 2009-09-08 Listed $214,900 HARMLS
- 1998-04-09 Sold (Public Records) — Public Records
Property tax history
+6.3%/yrLatest (2025): $7,366 · -0.3% YoY. Source: county tax records.
Cash-flow waterfall
monthlySold comps — $/sqft
last 12 mo · ≤1 miLoading sold comps…