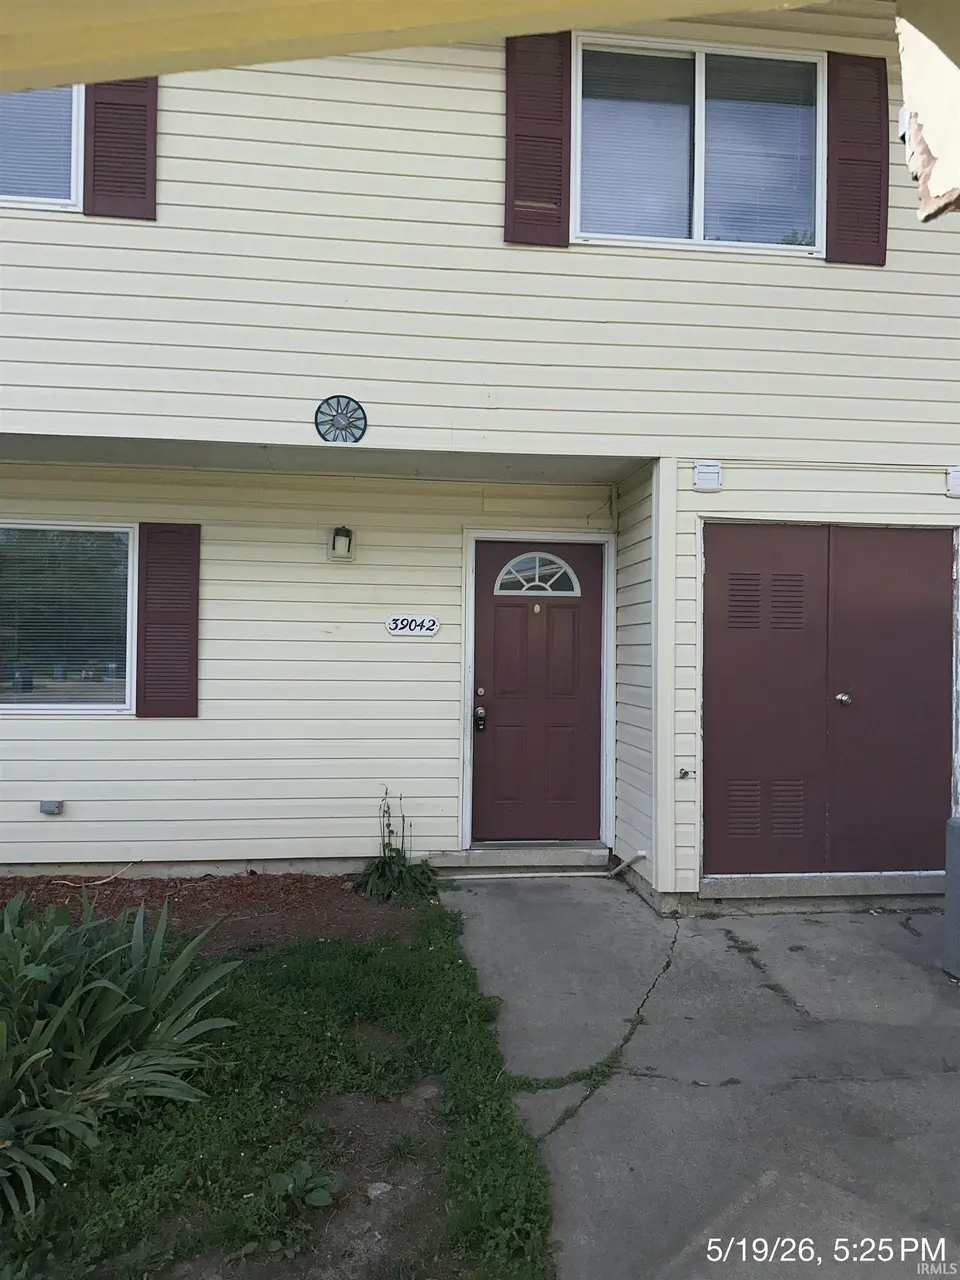
39042 Edwards Ct · Grissom AFB, IN
Flood risk 1/10 · Minimal
- FEMA flood zone
- X (unshaded)
- Chance of flooding over 30 yrs
- 0.0%
- Est. flood insurance / yr
- $507 – $1,088
Fire risk 1/10 · Minimal
- Est. fire insurance / yr
- $717 – $1,331
Heat risk 3/10 · Minor
- Hot days now (above 101°F)
- 7 days/yr
- Hot days in 30 yrs
- 17 days/yr
Wind risk 2/10 · Minimal
- Chance of severe wind over 30 yrs
- —
Air-quality risk 3/10 · Minor
- Unhealthy air days now
- 2 days/yr
- Unhealthy air days in 30 yrs
- 3 days/yr
Risk factors via First Street. Map © Google.
Why this score? — see what drove the B+ grade
The composite is a weighted blend of 9 inputs, each scored 0–100. Each bar is that input's sub-score; the figure is the points it added to the 100-point composite (weight × sub-score).
- Cash flow +30.0/30.0
- ARV discount +15.0/15.0
- DSCR +10.0/10.0
- 1% rule +9.6/10.0
- Livability +3.2/5.0
- Schools +2.8/10.0
- Rent growth +2.5/5.0
- Condition / age +2.5/5.0
- Appreciation +0.0/10.0
$85,000
🖨 Deal sheet 📄 Offer letter ✓ Due diligence
Listing remarks
Very spacious four bedroom home with two full bathrooms and on half bath. This home has a large living room. The kitchen has eat in area also a walk in pantry. The stove, washer, dryer and dishwasher provided . This unit has a carport, extra storage area and a 8 x 10 metal shed. New furnace and AC unit. New water heater.
Key facts
- New furnace
- Metal shed
- Extra storage area
Tags
Property features AI
Finance
- Other: Private pool (association); Subdivision: Estates at Eagle Pointe
- HOA & community: Homeowners association (monthly fee); Association amenities: playground, fitness center, pool; Association fee $65
Exterior
- Parking: Has garage; 1-car garage; Concrete parking; Off-street parking; Carport
- Utilities: Public water; Public sewer
- Home design: Single-family residence; Site-built home
- Construction: Vinyl siding; Wood siding; Asphalt roof
- Exterior features: Patio; Cul-de-sac lot
Interior
- Kitchen: Dishwasher; Refrigerator; Gas range
- Flooring: Carpet; Tile; Vinyl
- Bathrooms: 2 full bathrooms; 1 half bathroom; One main-level bathroom
- Heating & cooling: Forced air heating (natural gas); Central air conditioning
- Interior features: Pantry; Eat-in kitchen; Laminate counters; One fireplace
- Laundry & utility: Main-level laundry; Gas water heater; Water heater
Neighborhood map
What this means for you Summary
Snapshot
- This is a 4-bed/2.5-bath single-family listed at $85k.
Deal economics
- At list price, monthly cash flow is $415 ($5k/yr) — positive.
- The deal already cash-flows at list — no discount required.
- Meets the 1% rule at list price ($1k rent vs $85k).
- Recommended offer: $84k (1.5% below list) — sets the bar for market timing.
Location & tenants
- Location reads 65/100 on livability (#359 in IN) — a middle-class / working-renter tenant base. Strengths: cost of living A+, housing A+, crime A; Watch: amenities F, commute F, health & safety D-.
- Maconaquah School Corporation (rural): math 25% / reading 40% proficiency, ranked #213 of 301 in IN (top 71%) — families likely to look elsewhere, expect single-tenant / working-renter base with shorter leases.
- Zoned schools: Maconaquah Middle School (math 14% / reading 36%, grade F, #247 of 330 statewide, top 76%, 435 students, 63% FRL); Maconaquah High School (math 37% / reading 72%, grade C-, #79 of 369 statewide, top 26%, 594 students, 52% FRL).
- Market conditions: 129 active listings in the ZIP; 5 comparable units currently listed for rent nearby; rentals lingering (median 44d on market — plan ~5-8 weeks vacancy on turnover, expect pricing pressure); 100% of comp listings sitting > 30 days — soft ceiling on asking rent; 35 units permitted in Miami County in 2024 (0 in 5+ unit buildings).
Forward outlook
- Local home prices are declining (-3.0%/yr); year-one equity from $588 of loan paydown is wiped out by about $3k of value loss. Plan a longer hold.
- Miami County population projected at -12% by 2050 — secular population decline; favor cash flow + early exit over multi-decade hold.
- At projected returns (-3.0% appreciation + 3.0% rent growth), your $24k cash investment doubles in ~6 years — after that, you're playing with house money.
Negotiation context
- It's been on market 15 days — a 2% lower offer ($84k) is reasonable based on typical stale-listing flexibility.
- 2 sale attempts; this cycle's ask has dropped $10k (11%) from the opening price — seller is motivated, your offer sets the floor, not the list.
Questions for the listing agent
- Built in 1970 — when were the roof, HVAC, electrical panel, plumbing, and water heater last replaced?
- What does the HOA fee cover, when was the last increase, and are there any pending special assessments or reserve-fund shortfalls?
- Is there a deadline driving the sale (1031 exchange, divorce, estate, relocation)? That informs how much negotiation room exists.
- Schools are F-rated, which usually means shorter tenancies and higher turnover. Who's the typical renter profile here, and what's been the actual vacancy rate?
- What's the average days-on-market for RENTAL listings here right now (not sales)? A rising rental-DOM trend means longer vacancies and softer asking-rent achievability than the comps imply.
- What's the recent tenant-quality profile in this submarket — average credit score on applications, eviction rate, late-payment / NSF rate, and stable-employment percentage? A property-management company in the area should have these aggregated.
- How much new for-sale + rental construction is in the pipeline within 1–3 miles? Heavy new supply typically softens prices + rents 12–24 months out; constrained supply supports both.
Investment metrics
- 1% rule
- 1.46% ✓
- Cap rate
- 12.15%
- Cash-on-cash
- 20.91%
- DSCR
- 1.93
- GRM
- 5.7
CMA / ARV
- ARV (on-the-fly)
- $117,000
- Comps found
- 10
Show comp detail 10 sales within ~0.75 mi
| Address | Dist | Beds/Ba | Sqft | Sold | Price | $/sf | Match |
|---|---|---|---|---|---|---|---|
| 2102 Cannon Cir | 0.53mi | 3/2.0 (-1) | 1,466 (-2%) | 2mo | $149,900 | $102 | 63 |
| 2670 Capehart Ave | 0.45mi | 3/2.0 (-1) | 1,446 (-4%) | 12mo | $145,000 | $100 | 56 |
| 2805 Castle Ct | 0.36mi | 3/1.0 (-1) | 1,540 (+3%) | 15mo | $123,500 | $80 | 55 |
| 1831 Norton Ave | 0.56mi | 3/2.0 (-1) | 1,466 (-2%) | 14mo | $146,000 | $100 | 51 |
| 2924 Travis St | 0.37mi | 3/2.5 (-1) | 1,641 (+9%) | 19mo | $125,000 | $76 | 46 |
| 1737 S Lincoln Rd | 0.66mi | 4/2.0 | 1,442 (-4%) | 23mo | $112,900 | $78 | 41 |
| 1421 Eglin Ave | 0.60mi | 3/2.0 (-1) | 1,429 (-5%) | 21mo | $84,005 | $59 | 40 |
| 1639 Warhawk St | 0.62mi | 3/2.0 (-1) | 1,429 (-5%) | 21mo | $71,600 | $50 | 39 |
| 1733 S Lincoln St | 0.69mi | 3/2.0 (-1) | 1,448 (-4%) | 24mo | $71,800 | $50 | 35 |
| 2807 Castle Ct | 0.36mi | 3/1.0 (-1) | 1,682 (+12%) | 21mo | $113,000 | $67 | 35 |
Match score weights: distance 35% · size 25% · config 20% · recency 20%. Top-matched comps best support the ARV.
Projected returns pro-forma
-3.0% appreciation · 3.0% rent growth · sell at horizon
- IRR
- 13.3%
- Equity multiple
- 1.53×
- Total profit
- $12,643
- Equity at exit
- $12,674
- IRR
- 22.2%
- Equity multiple
- 2.89×
- Total profit
- $45,041
- Equity at exit
- $7,349
Cash invested: $23,800 (down + closing). Projections, not guarantees.
Landlord ↔ Tenant lean methodology
- Overall (STATE)
- 90 Strongly Landlord-Friendly
- State Indiana
- 90 Strongly Landlord-Friendly · R+11
- County
- — inherits STATE
- City
- — inherits STATE
ZIP-level market 46970
- Home prices YoY
- -8.8%
- Active inventory
- 129
- Price-to-rent
- 5.7×
Monthly cashflow live
- Estimated rent
- $1,242 high interval (Pro) →
- Mortgage (P&I)
- −$446
- Tax from tax record
- −$20 /mo · $242/yr
- Insurance
- −$35
- HOA
- −$65
- Vacancy / Maint / Mgmt
- −$261
- Net cashflow
- $415
Break-even live
UW: 25.0% down · 7.5% · 30yr · 1.5% tax · 5.0% vac · 8.0% maint · 8.0% mgmt
Financing live
Cash to close
- Down payment
- $21,250
- Closing costs
- $2,550
- Reserves months
- —
- Total cash needed
- —
Loan-product check · same deal, 3 products live
Conventional
25% down · 7.5% · 30yr
- Down + closing
- —
- Monthly P&I
- —
- Monthly cashflow
- —
- DSCR
- —
- Eligible?
- —
Personal DTI + credit; lowest rate.
DSCR
20% down · 8.5% · 30yr
- Down + closing
- —
- Monthly P&I
- —
- Monthly cashflow
- —
- DSCR
- —
- Eligible?
- —
No personal income docs; deal must DSCR.
Hard money
10% down · 12.0% · 12mo
- Down + closing
- —
- Monthly P&I
- —
- Monthly cashflow
- —
- DSCR
- —
- Eligible?
- —
Short-term bridge; refi at stabilization.
Rent comps 5 comps
| Address | Beds | Baths | Sqft | Rent | $/sqft | DOM | Units | Dist |
|---|---|---|---|---|---|---|---|---|
| 39023 Edwards Ct Peru, IN | 4.0 | 2.5 | 1334 | $1,230 | $0.92 | 43d | 1 | 0.02mi |
| 38042 Dow Ct Peru, IN | 3.0 | 1.5 | 1542 | $1,150 | $0.75 | 43d | 1 | 0.06mi |
| 36013 Beale Ct Peru, IN | 3.0 | 1.5 | 1080 | $1,050 | $0.97 | 43d | 1 | 0.17mi |
| 2909 Travis St Peru, IN | 3.0 | 1.5 | 1148 | $1,125 | $0.98 | 43d | 1 | 0.34mi |
| 1703 S Lincoln St Peru, IN | 3.0 | 2.0 | 1201 | $1,100 | $0.92 | 43d | 1 | 0.87mi |
HOA detail
- Monthly dues
- $65 · $780/yr
- Likely covers
- water
Listing history 14 events
-
2026-06-13statusdays on market $85,000 Pending 15 DOM
-
2026-06-10days on market $85,000 Active 13 DOM
-
2026-06-09days on market $85,000 Active 12 DOM
-
2026-06-08days on market $85,000 Active 11 DOM
-
2026-06-07days on market $85,000 Active 10 DOM
-
2026-06-05remarks 322-char remark
-
2026-06-05days on market $85,000 Active 7 DOM
-
2026-06-02days on market $85,000 Active 5 DOM
-
2026-06-01pricedays on market $85,000 Active 4 DOM
-
2026-05-31days on market $95,000 Active 3 DOM
-
2026-05-30days on market $95,000 Active 2 DOM
-
2026-05-29historical $1,200
-
2026-05-29$95,000 Active
-
2026-05-09$1,200
ⓘ Source: listings_history table (triggers on properties + properties_extension) + one-shot
backfill from property_details.listing_events for pre-trigger history.
Tax reassessment forecast IN · Partial reset (capped growth)
- Current annual tax
- $242 · $20/mo
- Projected year-2 tax
- $482 · $40/mo
- Expected delta
- +$240/yr (+$20/mo · 99.2%)
ⓘ Screening estimate from a state-policy table — verify with the county assessor before closing.
Climate risk First Street
- Flood 1/10 Low FEMA zone X (unshaded) · 0% chance over 30 yrs
- Wildfire 1/10 Low
- Heat 3/10 Moderate 7 d/yr ≥101°F today · 17 d/yr by 30 yrs out
- Wind 2/10 Low
- Air quality 3/10 Moderate 2 unhealthy d/yr today · 3 by 30 yrs out
Nearby sold comps map
Loading sold comps map…
Walkable amenities ~0.75 mi
Loading nearby amenities…
Taxation est. · year 1
- Rental income
- $14,902
- − Mortgage interest
- −$4,761
- − Property taxes
- −$242
- − Insurance
- −$425
- − Repairs & maintenance
- −$1,192
- − Management
- −$1,192
- − HOA
- −$780
- − Depreciation
- −$2,473
- Taxable income
- $3,836
- Est. tax owed @ 24.0%
- −$921
- After-tax cash flow
- $4,055/yr
For passive investors: Depreciation is non-cash, so a rental often shows a tax loss while cash-flowing — sheltering income. Rental losses are passive: they offset passive income freely, and up to $25,000/yr can offset ordinary (W-2) income if you actively participate and your MAGI is under $100k (phasing out to $0 by $150k); unused losses carry forward. On sale, claimed depreciation is recaptured at up to 25%, and gains may owe capital-gains tax (a 1031 exchange can defer both). Figures are a year-1 estimate at your 24.0% rate — not tax advice; consult a CPA.
Schools (NCES district)
- District
- Maconaquah School Corporation
- NCES district ID
- 1806090
- Math proficiency
- 25% ▼ -12.00%
- Reading proficiency
- 40% ▼ -6.00%
- Median HH income
- $47,296
- Composite
- 27.96/100
- National rank
- #6859
- State rank
- #213 of 301 in IN
Livability — Grissom AFB
- Score
- 65/100
- State rank
- #359
- US rank
- #13555
Category grades
Schools grade is shown separately in the Schools card above.
Census & demographics
- Census place
- Grissom AFB, IN
- County
- Miami County · 23,020 people
- Metro
- Peru, IN
- Population (ZIP)
- 23,020
- Household income
- $57,842
- Rent vs Own
- Severe rent burden
- 498.0
Population outlook (Miami County) Hauer SSP2
- Today (2025)
- 34,421 people
- By 2030
- 33,571 · -2.5%
- By 2040
- 31,919 · -7.3%
- By 2050
- 30,313 · -11.9%
- By 2075
- 26,202 · -23.9%
- By 2100
- 20,856 · -39.4%
Race, ethnicity, and origin ACS 2023
- Neighborhood character
- Predominantly White (87%)
- Race & ethnicity
- White 87% Two or more races 6% Hispanic / Latino 4% Black 3%
- Common ancestry
- Iranian 2% Romanian 2% Slovak 2%
- Foreign-born
- 1% · Canada
- Languages at home
- 97% English-only · Spanish 2% German/W. Germanic 0%
Political lean MEDSL · Miami
- 2024 margin
- Solid R (+54.5) · D 21.8% · R 76.3% · Other 1.9%
- 2008→2024 swing
- -35.1pp toward R · 2008: -19.5pp · 2024: -54.5pp
- All cycles
- 2024: R+54.5 2020: R+53.1 2016: R+53.6 2012: R+30.9 2008: R+19.5
Not yet ingested
- Civics
- —
Market trends
- HPI YoY
- ▼ -24.29%
- Current HPI
- 252.7166
- Rent YoY
- —
- Metro
- Peru, IN
- State GDP YoY
- ▲ 2.90%
- F500 in state
- 18
Industry mix (Fortune 500 HQ in IN)
| Industry | F500 HQs | Revenue |
|---|---|---|
| Industrial Machinery | 2 | $37B |
|
||
| Healthcare | 1 | $177B |
|
||
| Pharmaceuticals | 1 | $45B |
|
||
| Metals / Steel | 1 | $18B |
|
||
| Agriculture | 1 | $17B |
|
||
| Packaging | 1 | $12B |
|
||
Price history
+0.0% since first listed3 events — show timeline
- 2026-05-29 Rental Removed $1,200 IRMLS
- 2026-05-29 Listed $95,000 IRMLS
- 2026-05-09 Listed for Rent $1,200 IRMLS
Property tax history
-2.1%/yrLatest (2024): $242 · +41.7% YoY. Source: county tax records.
Cash-flow waterfall
monthlySold comps — $/sqft
last 12 mo · ≤1 miLoading sold comps…