 Triplex
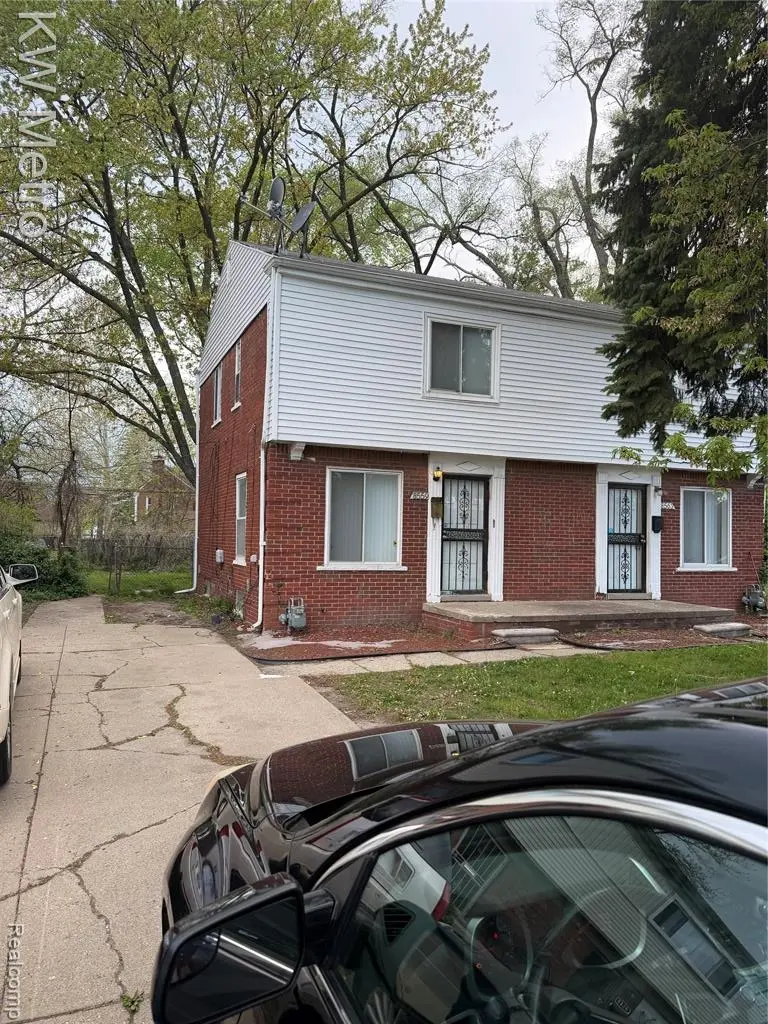
8559-8563 Wyoming Ave S · Detroit, MI
Flood risk 1/10 · Minimal
- FEMA flood zone
- X (unshaded)
- Chance of flooding over 30 yrs
- 0.0%
- Est. flood insurance / yr
- $473 – $860
Fire risk 1/10 · Minimal
- Est. fire insurance / yr
- $784 – $1,456
Heat risk 3/10 · Minor
- Hot days now (above 96°F)
- 7 days/yr
- Hot days in 30 yrs
- 15 days/yr
Wind risk 2/10 · Minimal
- Chance of severe wind over 30 yrs
- —
Air-quality risk 3/10 · Minor
- Unhealthy air days now
- 2 days/yr
- Unhealthy air days in 30 yrs
- 5 days/yr
Risk factors via First Street. Map © Google.
Why this score? — see what drove the B- grade
The composite is a weighted blend of 9 inputs, each scored 0–100. Each bar is that input's sub-score; the figure is the points it added to the 100-point composite (weight × sub-score).
- Cash flow +30.0/30.0
- 1% rule +10.0/10.0
- DSCR +10.0/10.0
- Appreciation +10.0/10.0
- Livability +3.7/5.0
- Rent growth +2.5/5.0
- Condition / age +2.5/5.0
- Schools +1.3/10.0
- ARV discount +0.0/15.0
$154,900
🖨 Deal sheet 📄 Offer letter ✓ Due diligence
Multi-family units
County records classify this as Multi-Family (2-4 Unit). Listing-text estimate: 3 units. confirmed
Listing remarks MLS
Turnkey Income-Producing Duplex | Fully Updated | $2,300/mo Potential Clean, updated, and ready to perform. This duplex offers immediate income with one unit rented at $1,100/month and the second unit vacant and ready to lease at up to $1,200/month - bringing total projected rents to $2,300/month ($27,600/year). Renovated in 2021, this property is set up for low-maintenance ownership and strong cash flow from day one. Perfect for investors looking for a solid performing asset or an owner-occupant looking to live in one unit while the other offsets the mortgage. Highlights: - Strong rental income with upside - One unit occupied with A/C, one unit move-in/tenant ready - Updated interiors (2021) - High rental demand area Rental registration renewed April 2026, transferable and valid through 4/12/2026 - making this a seamless transition for the next owner. Whether you're building your portfolio or stepping into your first income property, this is a clean, straightforward deal with real numbers that make sense. Buyer to verify all information. Seller is a licensed agent
Key facts
- Fully updated
- Updated interiors
- Strong rental income
Tags
Property features AI
Finance
- Other: Pets allowed
Exterior
- Parking: Two parking spaces; Shared driveway
- Utilities: Public water; Public sewer; Electric service with circuit breakers
- Home design: Multi-family residential income property; Two-story building; Brick construction
- Construction: Brick/mortar foundation; Asphalt roof; Built with brick exterior
- Exterior features: Front porch; Back yard fencing; Paved road access; Sidewalks nearby
Interior
- Bedrooms: Two 2-bedroom units
- Bathrooms: Two full bathrooms (one in each unit)
- Heating & cooling: Central air conditioning; Forced air heating with natural gas
- Interior features: Partially finished basement; Two levels
Neighborhood map
What this means for you Summary
Snapshot
- This is a 3 × 2-bed/1.0-bath units multifamily listed at $155k.
Deal economics
- At list price, monthly cash flow is $633 ($8k/yr) — positive. Per door: $211/mo.
- The deal already cash-flows at list — no discount required.
- Meets the 1% rule at list price ($2k rent vs $155k).
- Recommended offer: $150k (3.0% below list) — sets the bar for market timing.
Location & tenants
- Location reads 73/100 on livability (#218 in MI) — a middle-class / working-renter tenant base. Strengths: amenities A+, commute A+, cost of living A+; Watch: schools F, crime F, employment F.
- Detroit Public Schools Community District (urban): math 10% / reading 24% proficiency, ranked #499 of 540 in MI (top 92%) — low school quality limits family demand, transient renter base, plan for 1-2y turnover; 90% free/reduced lunch — lower-income household profile, screen leases tightly.
- Market conditions: 244 active listings in the ZIP; lower-income renter base — watch delinquency; 2,639 units permitted in Wayne County in 2024 (1,216 in 5+ unit buildings).
- At $2,415/mo this rent would consume 84% of the median local household income ($34k/yr) (locally 1418% of renters already pay >50% of income on rent) — very limited rent-growth headroom before tenants either downsize or default.
Forward outlook
- In year one you build about $17k of equity ($1k loan paydown + $15k appreciation (10.0% local appreciation)).
- Wayne County population projected at -17% by 2050 — secular population decline; favor cash flow + early exit over multi-decade hold.
- At projected returns (10.0% appreciation + 3.0% rent growth), your $43k cash investment doubles in ~2 years — after that, you're playing with house money.
- By year 3, paydown + projected appreciation supports a ~$42k cash-out refi (75% LTV) — recoverable capital for the next deal without selling this one.
Negotiation context
- It's been on market 36 days — a 3% lower offer ($150k) is reasonable based on typical stale-listing flexibility.
- 4 sale attempts since 6y ago with the ask held roughly flat each time — persistent listings suggest the price (not the market) is what's stuck; bring a comps-based counter.
- Current owner paid $80k; list at $155k implies a 94% gain — meaningful room to come down on a strong offer.
Risks & watch-outs
- Watch-outs: property tax is 3.1% of price; built in 1952 — expect roof / HVAC / electrical / plumbing capex.
Questions for the listing agent
- It's been on market 36 days. Have you received any prior offers? Is the seller open to a 3% concession, seller financing, or rate buy-down credit?
- Can we see the unit-by-unit rent roll, current vacancy, and any below-market leases? What's the average tenancy length?
- What capital expenditures (roof, boiler, parking lot, exteriors) have been made in the last 5 years, and what's planned in the next 2?
- Built in 1952 — when were the roof, HVAC, electrical panel, plumbing, and water heater last replaced?
- Property tax is high relative to price — has the assessment been appealed recently, and will the sale trigger a re-assessment?
- Is there a deadline driving the sale (1031 exchange, divorce, estate, relocation)? That informs how much negotiation room exists.
- Schools are F-rated, which usually means shorter tenancies and higher turnover. Who's the typical renter profile here, and what's been the actual vacancy rate?
- Crime grade is F in this area — have there been break-ins, vandalism, or insurance claims at this property in the last 3 years? What carrier currently insures it and at what premium?
- What's the average days-on-market for RENTAL listings here right now (not sales)? A rising rental-DOM trend means longer vacancies and softer asking-rent achievability than the comps imply.
- What's the recent tenant-quality profile in this submarket — average credit score on applications, eviction rate, late-payment / NSF rate, and stable-employment percentage? A property-management company in the area should have these aggregated.
- How much new apartment / multifamily construction is in the pipeline within 1–3 miles? Heavy new supply (>2% of stock underway) typically softens rents 12–24 months out; light construction supports rent growth.
Investment metrics
- 1% rule
- 1.56% ✓
- Cap rate
- 11.20%
- Cash-on-cash
- 17.51%
- DSCR
- 1.78
- GRM
- 5.3
CMA / ARV
- ARV (median comp)
- $124,979
- List price
- $154,900
- Delta
- 23.94%
- Verdict
- OVERPRICED
- Comps
- 20 within 1.0 mi
Projected returns pro-forma
10.0% appreciation · 3.0% rent growth · sell at horizon
- IRR
- 37.3%
- Equity multiple
- 3.88×
- Total profit
- $124,843
- Equity at exit
- $139,546
- IRR
- 32.2%
- Equity multiple
- 8.75×
- Total profit
- $336,259
- Equity at exit
- $300,937
Cash invested: $43,372 (down + closing). Projections, not guarantees.
Landlord ↔ Tenant lean methodology
- Overall (STATE)
- 62 Landlord-Friendly
- State Michigan
- 62 Landlord-Friendly · EVEN
- County
- — inherits STATE
- City
- — inherits STATE
ZIP-level market 48204
- Home prices YoY
- 18.5%
- Active inventory
- 244
- Price-to-rent
- 16.0×
Monthly cashflow live
- Estimated rent
- $2,415 high interval (Pro) →
- Mortgage (P&I)
- −$812
- Tax from tax record
- −$398 /mo · $4,775/yr
- Insurance
- −$65
- HOA
- −$0
- Vacancy / Maint / Mgmt
- −$507
- Net cashflow
- $633
Break-even live
3-unit breakdown (identical units grouped — click to expand)
| Units | Beds | Baths | Est. rent |
|---|---|---|---|
| 3× units | 2 | 1 | $2,415 |
| #1 | 2 | 1 | $805 |
| #2 | 2 | 1 | $805 |
| #3 | 2 | 1 | $805 |
| Total (3 units) | $2,415 | ||
UW: 25.0% down · 7.5% · 30yr · 1.5% tax · 5.0% vac · 8.0% maint · 8.0% mgmt
Financing live
Cash to close
- Down payment
- $38,725
- Closing costs
- $4,647
- Reserves months
- —
- Total cash needed
- —
Loan-product check · same deal, 3 products live
Conventional
25% down · 7.5% · 30yr
- Down + closing
- —
- Monthly P&I
- —
- Monthly cashflow
- —
- DSCR
- —
- Eligible?
- —
Personal DTI + credit; lowest rate.
DSCR
20% down · 8.5% · 30yr
- Down + closing
- —
- Monthly P&I
- —
- Monthly cashflow
- —
- DSCR
- —
- Eligible?
- —
No personal income docs; deal must DSCR.
Hard money
10% down · 12.0% · 12mo
- Down + closing
- —
- Monthly P&I
- —
- Monthly cashflow
- —
- DSCR
- —
- Eligible?
- —
Short-term bridge; refi at stabilization.
Listing history 25 events
-
2026-06-18days on market $154,900 Active 36 DOM
-
2026-06-17days on market $154,900 Active 35 DOM
-
2026-06-15days on market $154,900 Active 33 DOM
-
2026-06-13days on market $154,900 Active 31 DOM
-
2026-06-13days on market $154,900 Active 30 DOM
-
2026-06-09days on market $154,900 Active 27 DOM
-
2026-06-08days on market $154,900 Active 26 DOM
-
2026-06-07days on market $154,900 Active 25 DOM
-
2026-06-04days on market $154,900 Active 22 DOM
-
2026-06-03days on market $154,900 Active 21 DOM
-
2026-06-02days on market $154,900 Active 20 DOM
-
2026-06-01days on market $154,900 Active 19 DOM
-
2026-05-31days on market $154,900 Active 18 DOM
-
2026-05-13$154,900 Active 1105-char remark
Show marketing remark (1081 chars)
Turnkey Income-Producing Duplex | Fully Updated | $2,300/mo Potential Clean, updated, and ready to perform. This duplex offers immediate income with one unit rented at $1,100/month and the second unit vacant and ready to lease at up to $1,200/month - bringing total projected rents to $2,300/month ($27,600/year). Renovated in 2021, this property is set up for low-maintenance ownership and strong cash flow from day one. Perfect for investors looking for a solid performing asset or an owner-occupant looking to live in one unit while the other offsets the mortgage. Highlights: - Strong rental income with upside - One unit occupied with A/C, one unit move-in/tenant ready - Updated interiors (2021) - High rental demand area Rental registration renewed April 2026, transferable and valid through 4/12/2026 - making this a seamless transition for the next owner. Whether you're building your portfolio or stepping into your first income property, this is a clean, straightforward deal with real numbers that make sense. Buyer to verify all information. Seller is a licensed agent
-
2026-05-13$154,900 Active 1081-char remark
Show marketing remark (1081 chars)
Turnkey Income-Producing Duplex | Fully Updated | $2,300/mo Potential Clean, updated, and ready to perform. This duplex offers immediate income with one unit rented at $1,100/month and the second unit vacant and ready to lease at up to $1,200/month - bringing total projected rents to $2,300/month ($27,600/year). Renovated in 2021, this property is set up for low-maintenance ownership and strong cash flow from day one. Perfect for investors looking for a solid performing asset or an owner-occupant looking to live in one unit while the other offsets the mortgage. Highlights: - Strong rental income with upside - One unit occupied with A/C, one unit move-in/tenant ready - Updated interiors (2021) - High rental demand area Rental registration renewed April 2026, transferable and valid through 4/12/2026 - making this a seamless transition for the next owner. Whether you're building your portfolio or stepping into your first income property, this is a clean, straightforward deal with real numbers that make sense. Buyer to verify all information. Seller is a licensed agent
-
2021-06-14soldstatus $80,000
-
2021-05-12soldstatus $80,000 Sold
Show marketing remark (76 chars)
Solid brick duplex tenant occupied producing $1300 per month ($650 per side)
-
2021-05-12soldstatus $80,000 Closed
Show marketing remark (76 chars)
Solid brick duplex tenant occupied producing $1300 per month ($650 per side)
-
2021-03-22status Pending
Show marketing remark (76 chars)
Solid brick duplex tenant occupied producing $1300 per month ($650 per side)
-
2021-03-22status Pending
Show marketing remark (76 chars)
Solid brick duplex tenant occupied producing $1300 per month ($650 per side)
-
2021-02-06price $99,000
Show marketing remark (76 chars)
Solid brick duplex tenant occupied producing $1300 per month ($650 per side)
-
2021-02-06price $99,000
Show marketing remark (76 chars)
Solid brick duplex tenant occupied producing $1300 per month ($650 per side)
-
2020-11-03$100,000 Active
Show marketing remark (76 chars)
Solid brick duplex tenant occupied producing $1300 per month ($650 per side)
-
2020-11-03$100,000 Active
Show marketing remark (76 chars)
Solid brick duplex tenant occupied producing $1300 per month ($650 per side)
-
2001-10-19soldstatus $73,500
ⓘ Source: listings_history table (triggers on properties + properties_extension) + one-shot
backfill from property_details.listing_events for pre-trigger history.
Tax reassessment forecast MI · Partial reset (capped growth)
- Current annual tax
- $4,775 · $398/mo
- Projected year-2 tax
- $4,775 · $398/mo
- Expected delta
- $0/yr ($0/mo · 0.0%)
ⓘ Screening estimate from a state-policy table — verify with the county assessor before closing.
Climate risk First Street
- Flood 1/10 Low FEMA zone X (unshaded) · 0% chance over 30 yrs
- Wildfire 1/10 Low
- Heat 3/10 Moderate 7 d/yr ≥96°F today · 15 d/yr by 30 yrs out
- Wind 2/10 Low
- Air quality 3/10 Moderate 2 unhealthy d/yr today · 5 by 30 yrs out
Nearby sold comps map
Loading sold comps map…
Walkable amenities ~0.75 mi
Loading nearby amenities…
Taxation est. · year 1
- Rental income
- $28,980
- − Mortgage interest
- −$8,677
- − Property taxes
- −$4,775
- − Insurance
- −$774
- − Repairs & maintenance
- −$2,318
- − Management
- −$2,318
- − Depreciation
- −$4,506
- Taxable income
- $5,610
- Est. tax owed @ 24.0%
- −$1,346
- After-tax cash flow
- $6,250/yr
For passive investors: Depreciation is non-cash, so a rental often shows a tax loss while cash-flowing — sheltering income. Rental losses are passive: they offset passive income freely, and up to $25,000/yr can offset ordinary (W-2) income if you actively participate and your MAGI is under $100k (phasing out to $0 by $150k); unused losses carry forward. On sale, claimed depreciation is recaptured at up to 25%, and gains may owe capital-gains tax (a 1031 exchange can defer both). Figures are a year-1 estimate at your 24.0% rate — not tax advice; consult a CPA.
Schools (NCES district)
- District
- Detroit Public Schools Community District
- NCES district ID
- 2601103
- Math proficiency
- 10% ▼ -2.00%
- Reading proficiency
- 24% ▲ 6.00%
- Median HH income
- $25,815
- Composite
- 13.06/100
- National rank
- #9564
- State rank
- #499 of 540 in MI
Livability — Detroit
- Score
- 73/100
- State rank
- #218
- US rank
- #5427
Category grades
Schools grade is shown separately in the Schools card above.
Census & demographics
- Census place
- Detroit, MI
- County
- Wayne County · 1,562,939 people
- City population
- 572,865
- Metro
- Detroit-Warren-Dearborn, MI
- Population (ZIP)
- 20,696
- Household income
- $34,468
- Rent vs Own
- Severe rent burden
- 1418.0
Population outlook (Wayne County) Hauer SSP2
- Today (2025)
- 1,675,273 people
- By 2030
- 1,620,300 · -3.3%
- By 2040
- 1,502,341 · -10.3%
- By 2050
- 1,384,039 · -17.4%
- By 2075
- 1,124,592 · -32.9%
- By 2100
- 881,193 · -47.4%
Race, ethnicity, and origin ACS 2023
- Neighborhood character
- Predominantly Black (86%)
- Race & ethnicity
- Black 86% Two or more races 7% Hispanic / Latino 5% White 4% Native American 2%
- Hispanic origin (detail)
- Mexican 4%
- Common ancestry
- Hispanic 1% Romanian 1%
- Foreign-born
- 2% · Canada
- Languages at home
- 95% English-only · Spanish 4%
Political lean MEDSL · Wayne
- 2024 margin
- Strong D (+29.0) · D 62.7% · R 33.7% · Other 3.6%
- 2008→2024 swing
- -20.5pp toward R · 2008: 49.5pp · 2024: 29.0pp
- All cycles
- 2024: D+29.0 2020: D+38.1 2016: D+37.3 2012: D+46.9 2008: D+49.5
Not yet ingested
- Civics
- —
Market trends
- HPI YoY
- ▲ 36.51%
- Current HPI
- 234.0465
- Rent YoY
- —
- Metro
- Detroit-Warren-Dearborn, MI
- State GDP YoY
- ▲ 1.37%
- F500 in state
- 28
Industry mix (Fortune 500 HQ in MI)
| Industry | F500 HQs | Revenue |
|---|---|---|
| Automotive Parts | 3 | $48B |
|
||
| Automotive | 2 | $372B |
|
||
| Chemicals | 1 | $45B |
|
||
| Automotive Retail | 1 | $29B |
|
||
| Healthcare / Medical Devices | 1 | $23B |
|
||
| Automotive Technology | 1 | $20B |
|
||
Price history
+110.7% since first listed12 events — show timeline
- 2026-05-13 Listed $154,900 MiRealSource-MiMLS
- 2026-05-13 Listed $154,900 REALCOMP
- 2021-06-14 Sold (Public Records) $80,000 Public Records
- 2021-05-12 Sold (MLS) $80,000 MiRealSource-MiMLS
- 2021-05-12 Sold (MLS) $80,000 REALCOMP
- 2021-03-22 Pending — MiRealSource-MiMLS
- 2021-03-22 Pending — REALCOMP
- 2021-02-06 Price Changed $99,000 MiRealSource-MiMLS
- 2021-02-06 Price Changed $99,000 REALCOMP
- 2020-11-03 Listed $100,000 MiRealSource-MiMLS
- 2020-11-03 Listed $100,000 REALCOMP
- 2001-10-19 Sold (Public Records) $73,500 Public Records
Property tax history
+13.9%/yrLatest (2025): $4,775 · +90.2% YoY. Source: county tax records.
Cash-flow waterfall
monthlySold comps — $/sqft
last 12 mo · ≤1 miLoading sold comps…