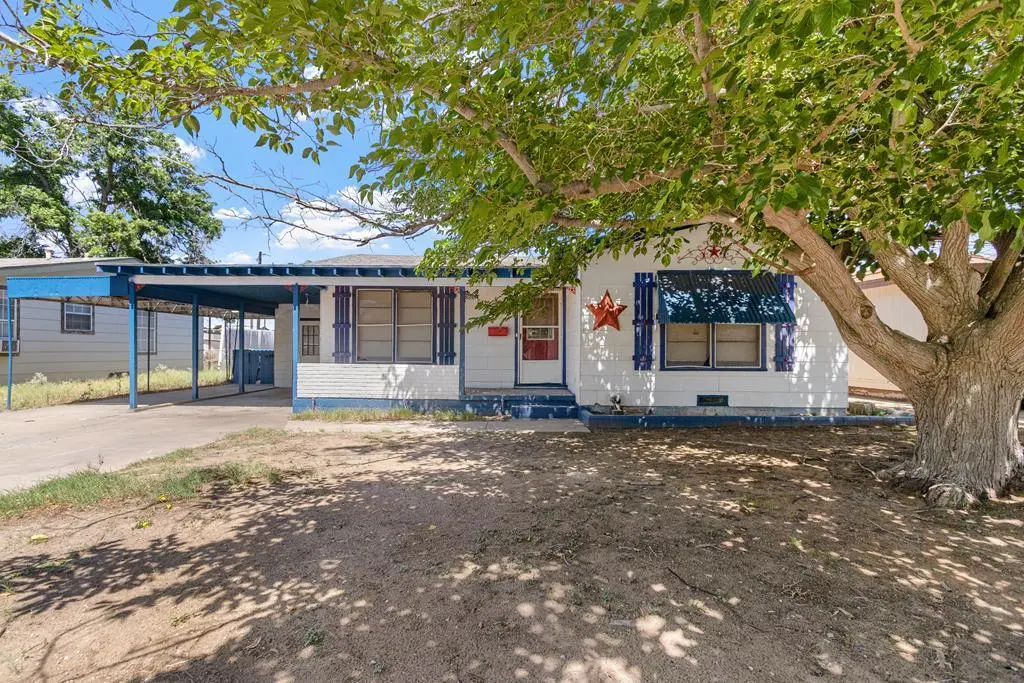
704 S Ave C · Kermit, TX
Flood risk 2/10 · Minimal
- FEMA flood zone
- —
- Chance of flooding over 30 yrs
- 0.09%
- Est. flood insurance / yr
- —
Fire risk 9/10 · Severe
- Est. fire insurance / yr
- $1,222 – $2,270
Heat risk 6/10 · Moderate
- Hot days now (above 103°F)
- 5 days/yr
- Hot days in 30 yrs
- 15 days/yr
Wind risk 2/10 · Minimal
- Chance of severe wind over 30 yrs
- 1.0%
Air-quality risk 1/10 · Minimal
- Unhealthy air days now
- 0 days/yr
- Unhealthy air days in 30 yrs
- 0 days/yr
Risk factors via First Street. Map © Google.
Why this score? — see what drove the C+ grade
The composite is a weighted blend of 9 inputs, each scored 0–100. Each bar is that input's sub-score; the figure is the points it added to the 100-point composite (weight × sub-score).
- Cash flow +21.6/30.0
- Appreciation +10.0/10.0
- ARV discount +8.8/15.0
- DSCR +6.9/10.0
- 1% rule +5.3/10.0
- Livability +3.1/5.0
- Schools +2.6/10.0
- Rent growth +2.5/5.0
- Condition / age +2.5/5.0
$150,000
🖨 Deal sheet 📄 Offer letter ✓ Due diligence
Listing remarks
Charming 3 bed, 2 bath home with tons of space and character! Features 2 living areas perfect for entertaining, relaxing, or creating a flex space. Oversized laundry room offers extra storage and functionality. Hardwood floors add warmth throughout much of the home. Large backyard provides plenty of room for gatherings, pets, or future projects. Covered parking! Great opportunity for homeowners or investors alike!
Key facts
- Covered parking
- Large backyard
- 2 living areas
Tags
Property features AI
Finance
- Other: Property located in subdivision: Other
Exterior
- Parking: 2 total parking spaces; 2 covered spaces; Carport; Parking pad
- Utilities: Public water; Public sewer; Propane available; Solar generation
- Home design: Single-family residence; Residential property
- Construction: Composition roof; Pillar/post/pier foundation
- Exterior features: Covered patio/porch; Landscaped yard; Paved road access
Interior
- Kitchen: Electric range
- Flooring: Vinyl flooring; Hardwood flooring
- Bathrooms: 2 full bathrooms
- Heating & cooling: Central heating (natural gas); Central electric air conditioning
- Interior features: Pantry; Thermostat (energy efficient)
- Laundry & utility: Gas water heater
Neighborhood map
What this means for you Summary
Snapshot
- This is a 3-bed/2.0-bath single-family listed at $150k.
Deal economics
- At list price, monthly cash flow is $227 ($3k/yr) — positive.
- The deal already cash-flows at list — no discount required.
- Meets the 1% rule at list price ($2k rent vs $150k).
- Recommended offer: $146k (3.0% below list) — sets the bar for market timing.
Location & tenants
- Location reads 62/100 on livability (#925 in TX) — a middle-class / working-renter tenant base. Strengths: crime A+, cost of living A+, housing A+; Watch: health & safety C-, amenities F, commute F.
- Kermit ISD (town): math 31% / reading 30% proficiency, ranked #602 of 826 in TX (top 73%) — families likely to look elsewhere, expect single-tenant / working-renter base with shorter leases.
- Zoned schools: Kermit El (math 37% / reading 27%, grade F, #2,268 of 4,322 statewide, top 55%, 596 students, 77% FRL); Kermit J H (math 27% / reading 30%, grade F, #1,122 of 1,662 statewide, top 69%, 406 students, 74% FRL); Kermit H S (math 37% / reading 32%, grade F, #963 of 1,632 statewide, top 61%, 372 students, 66% FRL) — zoned schools average 72% FRL vs 36% district-wide (36 pts higher); higher-poverty schools than district average — tighter screening recommended.
- Market conditions: 19 active listings in the ZIP.
Forward outlook
- In year one you build about $16k of equity ($1k loan paydown + $15k appreciation (10.0% local appreciation)).
- Winkler County population projected at +67% by 2050 — long-run rental-demand tailwind backs the buy-and-hold thesis.
- At projected returns (10.0% appreciation + 3.0% rent growth), your $42k cash investment doubles in ~3 years — after that, you're playing with house money.
- By year 3, paydown + projected appreciation supports a ~$41k cash-out refi (75% LTV) — recoverable capital for the next deal without selling this one.
Negotiation context
- It's been on market 40 days — a 3% lower offer ($146k) is reasonable based on typical stale-listing flexibility.
Risks & watch-outs
- Climate carrying-cost: severe wildfire risk; extreme-heat days projected 5→15/yr by 2055 (HVAC capex compounding) — expect insurance premiums to compound above CPI over the hold.
Questions for the listing agent
- It's been on market 40 days. Have you received any prior offers? Is the seller open to a 3% concession, seller financing, or rate buy-down credit?
- Is there a deadline driving the sale (1031 exchange, divorce, estate, relocation)? That informs how much negotiation room exists.
- Schools are F-rated, which usually means shorter tenancies and higher turnover. Who's the typical renter profile here, and what's been the actual vacancy rate?
- What's the average days-on-market for RENTAL listings here right now (not sales)? A rising rental-DOM trend means longer vacancies and softer asking-rent achievability than the comps imply.
- What's the recent tenant-quality profile in this submarket — average credit score on applications, eviction rate, late-payment / NSF rate, and stable-employment percentage? A property-management company in the area should have these aggregated.
- How much new for-sale + rental construction is in the pipeline within 1–3 miles? Heavy new supply typically softens prices + rents 12–24 months out; constrained supply supports both.
Investment metrics
- 1% rule
- 1.03% ✓
- Cap rate
- 8.11%
- Cash-on-cash
- 6.49%
- DSCR
- 1.29
- GRM
- 8.1
CMA / ARV
- ARV (median comp)
- $154,324
- List price
- $150,000
- Delta
- -2.80%
- Verdict
- FAIR
- Comps
- 1 within 2.0 mi
Projected returns pro-forma
10.0% appreciation · 3.0% rent growth · sell at horizon
- IRR
- 29.0%
- Equity multiple
- 3.29×
- Total profit
- $96,166
- Equity at exit
- $135,132
- IRR
- 25.2%
- Equity multiple
- 7.47×
- Total profit
- $271,813
- Equity at exit
- $291,417
Cash invested: $42,000 (down + closing). Projections, not guarantees.
Landlord ↔ Tenant lean methodology
- Overall (STATE)
- 87 Strongly Landlord-Friendly
- State Texas
- 87 Strongly Landlord-Friendly · R+5
- County
- — inherits STATE
- City
- — inherits STATE
ZIP-level market 79745
- Home prices YoY
- 4.7%
- Active inventory
- 19
- Price-to-rent
- 8.1×
Monthly cashflow live
- Estimated rent
- $1,551 medium interval (Pro) →
- Mortgage (P&I)
- −$787
- Tax from tax record
- −$149 /mo · $1,791/yr
- Insurance
- −$62
- HOA
- −$0
- Vacancy / Maint / Mgmt
- −$326
- Net cashflow
- $227
Break-even live
UW: 25.0% down · 7.5% · 30yr · 1.5% tax · 5.0% vac · 8.0% maint · 8.0% mgmt
Financing live
Cash to close
- Down payment
- $37,500
- Closing costs
- $4,500
- Reserves months
- —
- Total cash needed
- —
Loan-product check · same deal, 3 products live
Conventional
25% down · 7.5% · 30yr
- Down + closing
- —
- Monthly P&I
- —
- Monthly cashflow
- —
- DSCR
- —
- Eligible?
- —
Personal DTI + credit; lowest rate.
DSCR
20% down · 8.5% · 30yr
- Down + closing
- —
- Monthly P&I
- —
- Monthly cashflow
- —
- DSCR
- —
- Eligible?
- —
No personal income docs; deal must DSCR.
Hard money
10% down · 12.0% · 12mo
- Down + closing
- —
- Monthly P&I
- —
- Monthly cashflow
- —
- DSCR
- —
- Eligible?
- —
Short-term bridge; refi at stabilization.
Listing history 18 events
-
2026-06-19days on market $150,000 Active 40 DOM
-
2026-06-18days on market $150,000 Active 39 DOM
-
2026-06-17days on market $150,000 Active 38 DOM
-
2026-06-16days on market $150,000 Active 37 DOM
-
2026-06-15days on market $150,000 Active 36 DOM
-
2026-06-14days on market $150,000 Active 34 DOM
-
2026-06-12days on market $150,000 Active 33 DOM
-
2026-06-09days on market $150,000 Active 30 DOM
-
2026-06-08days on market $150,000 Active 29 DOM
-
2026-06-07days on market $150,000 Active 28 DOM
-
2026-06-05days on market $150,000 Active 26 DOM
-
2026-06-04days on market $150,000 Active 24 DOM
-
2026-06-02days on market $150,000 Active 23 DOM
-
2026-06-01days on market $150,000 Active 22 DOM
-
2026-05-31days on market $150,000 Active 21 DOM
-
2026-05-31days on market $150,000 Active 20 DOM
-
2026-05-10$150,000 Active 418-char remark
-
2007-07-16soldstatus
ⓘ Source: listings_history table (triggers on properties + properties_extension) + one-shot
backfill from property_details.listing_events for pre-trigger history.
Tax reassessment forecast TX · Resets to sale price
- Current annual tax
- $1,791 · $149/mo
- Projected year-2 tax
- $2,745 · $229/mo
- Expected delta
- +$954/yr (+$80/mo · 53.3%)
ⓘ Screening estimate from a state-policy table — verify with the county assessor before closing.
Climate risk First Street
- Flood 2/10 Low 9% chance over 30 yrs
- Wildfire 9/10 Extreme
- Heat 6/10 Major 5 d/yr ≥103°F today · 15 d/yr by 30 yrs out
- Wind 2/10 Low 100% chance of damaging wind over 30 yrs
- Air quality 1/10 Low 0 unhealthy d/yr today · 0 by 30 yrs out
Nearby sold comps map
Loading sold comps map…
Walkable amenities ~0.75 mi
Loading nearby amenities…
Taxation est. · year 1
- Rental income
- $18,617
- − Mortgage interest
- −$8,402
- − Property taxes
- −$1,791
- − Insurance
- −$750
- − Repairs & maintenance
- −$1,489
- − Management
- −$1,489
- − Depreciation
- −$4,364
- Taxable income
- $331
- Est. tax owed @ 24.0%
- −$79
- After-tax cash flow
- $2,647/yr
For passive investors: Depreciation is non-cash, so a rental often shows a tax loss while cash-flowing — sheltering income. Rental losses are passive: they offset passive income freely, and up to $25,000/yr can offset ordinary (W-2) income if you actively participate and your MAGI is under $100k (phasing out to $0 by $150k); unused losses carry forward. On sale, claimed depreciation is recaptured at up to 25%, and gains may owe capital-gains tax (a 1031 exchange can defer both). Figures are a year-1 estimate at your 24.0% rate — not tax advice; consult a CPA.
Schools (NCES district)
- District
- Kermit ISD
- NCES district ID
- 4825560
- Math proficiency
- 31% ▲ 12.00%
- Reading proficiency
- 30% ▲ 8.00%
- Median HH income
- $48,332
- Composite
- 26.47/100
- National rank
- #7215
- State rank
- #602 of 826 in TX
Livability — Kermit
- Score
- 62/100
- State rank
- #925
- US rank
- #16453
Category grades
Schools grade is shown separately in the Schools card above.
Census & demographics
- Census place
- Kermit, TX
- Population (ZIP)
- 6,160
Population outlook (Winkler County) Hauer SSP2
- Today (2025)
- 10,019 people
- By 2030
- 11,177 · +11.6%
- By 2040
- 13,746 · +37.2%
- By 2050
- 16,734 · +67.0%
- By 2075
- 24,573 · +145.3%
- By 2100
- 30,264 · +202.1%
Race, ethnicity, and origin ACS 2023
- Neighborhood character
- Predominantly Hispanic (71%)
- Race & ethnicity
- Hispanic / Latino 71% White 23% Two or more races 21% Black 4% Native American 3%
- Hispanic origin (detail)
- Mexican 65% Cuban 2%
- Common ancestry
- Lithuanian 2%
- Foreign-born
- 17% · Canada
- Languages at home
- 45% English-only · Spanish 55%
Political lean MEDSL · Winkler
- 2024 margin
- Solid R (+70.5) · D 14.7% · R 85.2%
- 2008→2024 swing
- -18.8pp toward R · 2008: -51.8pp · 2024: -70.5pp
- All cycles
- 2024: R+70.5 2020: R+65.6 2016: R+52.5 2012: R+53.5 2008: R+51.8
Not yet ingested
- Civics
- —
Market trends
- HPI YoY
- ▲ 10.52%
- Current HPI
- 233.1436
- Rent YoY
- —
- Metro
- —
- State GDP YoY
- ▲ 3.95%
- F500 in state
- 110
Industry mix (Fortune 500 HQ in TX)
| Industry | F500 HQs | Revenue |
|---|---|---|
| Energy | 16 | $1,198B |
|
||
| Technology | 5 | $198B |
|
||
| Engineering / Construction | 4 | $72B |
|
||
| Energy Services | 3 | $60B |
|
||
| Utilities | 3 | $41B |
|
||
| Healthcare | 2 | $330B |
|
||
Price history
2 events — show timeline
- 2026-05-10 Listed $150,000 ODMLS
- 2007-07-16 Sold (Public Records) — Public Records
Property tax history
+4.3%/yrLatest (2025): $1,791 · +20.2% YoY. Source: county tax records.
Cash-flow waterfall
monthlySold comps — $/sqft
last 12 mo · ≤1 miLoading sold comps…