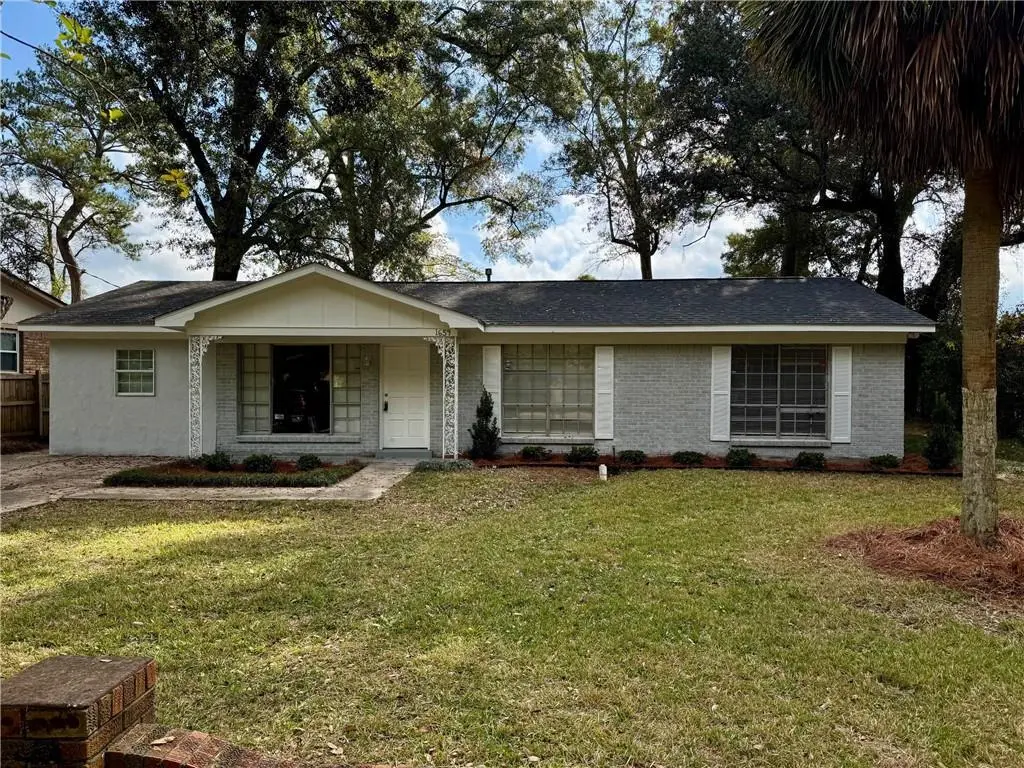
1659 Hand Ave · Prichard, AL
Flood risk 1/10 · Minimal
- FEMA flood zone
- X (unshaded)
- Chance of flooding over 30 yrs
- 0.0%
- Est. flood insurance / yr
- $507 – $1,088
Fire risk 3/10 · Minor
- Est. fire insurance / yr
- $916 – $1,700
Heat risk 9/10 · Severe
- Hot days now (above 104°F)
- 7 days/yr
- Hot days in 30 yrs
- 21 days/yr
Wind risk 9/10 · Severe
- Chance of severe wind over 30 yrs
- 99.0%
Air-quality risk 2/10 · Minimal
- Unhealthy air days now
- 1 days/yr
- Unhealthy air days in 30 yrs
- 1 days/yr
Risk factors via First Street. Map © Google.
Why this score? — see what drove the D+ grade
The composite is a weighted blend of 9 inputs, each scored 0–100. Each bar is that input's sub-score; the figure is the points it added to the 100-point composite (weight × sub-score).
- Cash flow +14.6/30.0
- Appreciation +8.8/10.0
- ARV discount +7.5/15.0
- DSCR +4.5/10.0
- 1% rule +2.8/10.0
- Livability +2.7/5.0
- Rent growth +2.5/5.0
- Condition / age +2.5/5.0
- Schools +2.3/10.0
$173,900
🖨 Deal sheet 📄 Offer letter ✓ Due diligence
Listing remarks
This completely renovated ranch-style single-family home features four bedrooms and one and a half bathrooms. The spacious layout includes a large living area that seamlessly connects to an open breakfast nook and dining room combination, providing ample space for both relaxation and entertainment. The den, located at the back of the house, offers direct access to the expansive rear yard, making it a perfect spot for indoor-outdoor living. One of the bedrooms is equipped with a half bath for added convenience, while two additional generously sized bedrooms are situated at the front of the home. The fourth bedroom provides versatile options, as it can be utilized as a home office, a large de
Key facts
- Large living area
- Expansive rear yard
- Open breakfast nook
Tags
Neighborhood map
What this means for you Summary
Snapshot
- This is a 4-bed/2.0-bath single-family listed at $174k.
Deal economics
- At list price, monthly cash flow is $41 ($494/yr) — positive.
- The deal already cash-flows at list — no discount required.
- To meet the 1% rule (rent ≥ 1% of price), the offer needs to be $136k (21.7% below list).
- Recommended offer: $136k (21.7% below list) — sets the bar for 1% rule.
- Cap rate 6.6% vs local median 11.4% in Prichard — below-typical yield; the buyer is paying a premium for something (appreciation thesis, condition, location) that the cap rate doesn't capture.
Location & tenants
- Location reads 54/100 on livability (#472 in AL) — a working-class tenant base; expect higher turnover. Strengths: cost of living A+, housing A; Watch: schools D-, crime F, amenities F.
- Mobile County (urban): math 15% / reading 39% proficiency, ranked #81 of 129 in AL (top 63%) — low school quality limits family demand, transient renter base, plan for 1-2y turnover; 67% free/reduced lunch — lower-income household profile, screen leases tightly.
- Market conditions: 17 active listings in the ZIP; 1,678 units permitted in Mobile County in 2024 (264 in 5+ unit buildings).
Forward outlook
- In year one you build about $14k of equity ($1k loan paydown + $13k appreciation (7.6% local appreciation)).
- Mobile County population projected to shrink 8% by 2050 — rents likely to lag national; underwrite the cash flow, not the appreciation.
- At projected returns (7.6% appreciation + 3.0% rent growth), your $49k cash investment doubles in ~3 years — after that, you're playing with house money.
- By year 3, paydown + projected appreciation supports a ~$36k cash-out refi (75% LTV) — recoverable capital for the next deal without selling this one.
Negotiation context
- Only 7 days on market — expect competitive offers; lowballing is unlikely to land.
Risks & watch-outs
- Climate carrying-cost: severe wind risk, 99% chance of damaging wind over 30y; extreme-heat days projected 7→21/yr by 2055 (HVAC capex compounding) — expect insurance premiums to compound above CPI over the hold.
Questions for the listing agent
- Is there a deadline driving the sale (1031 exchange, divorce, estate, relocation)? That informs how much negotiation room exists.
- Schools are D-rated, which usually means shorter tenancies and higher turnover. Who's the typical renter profile here, and what's been the actual vacancy rate?
- Crime grade is F in this area — have there been break-ins, vandalism, or insurance claims at this property in the last 3 years? What carrier currently insures it and at what premium?
- The area grade is low — what's the realistic commute time and amenity access for the typical tenant pool here? Any planned neighborhood developments (good or bad) we should know about?
- What's the average days-on-market for RENTAL listings here right now (not sales)? A rising rental-DOM trend means longer vacancies and softer asking-rent achievability than the comps imply.
- What's the recent tenant-quality profile in this submarket — average credit score on applications, eviction rate, late-payment / NSF rate, and stable-employment percentage? A property-management company in the area should have these aggregated.
- How much new for-sale + rental construction is in the pipeline within 1–3 miles? Heavy new supply typically softens prices + rents 12–24 months out; constrained supply supports both.
Investment metrics
- 1% rule
- 0.78% ✗
- Cap rate
- 6.58%
- Cash-on-cash
- 1.01%
- DSCR
- 1.05
- GRM
- 10.6
CMA / ARV
- ARV (median comp)
- $101,578
- List price
- $173,900
- Delta
- 71.20%
- Verdict
- OVERPRICED
- Comps
- 20 within 1.0 mi
Show comp detail 3 sales within ~0.75 mi
| Address | Dist | Beds/Ba | Sqft | Sold | Price | $/sf | Match |
|---|---|---|---|---|---|---|---|
| 638 Elba Ave | 0.57mi | 3/1.0 (-1) | 2,267 (+10%) | 1mo | $7,500 | $3 | 47 |
| 3618 Dial St | 0.61mi | 3/2.0 (-1) | 1,965 (-4%) | 19mo | $128,000 | $65 | 44 |
| 3711 Dial St | 0.72mi | 4/2.0 | 1,827 (-11%) | 13mo | $150,000 | $82 | 37 |
Match score weights: distance 35% · size 25% · config 20% · recency 20%. Top-matched comps best support the ARV.
Projected returns pro-forma
7.58% appreciation · 3.0% rent growth · sell at horizon
- IRR
- 19.8%
- Equity multiple
- 2.43×
- Total profit
- $69,528
- Equity at exit
- $127,173
- IRR
- 18.5%
- Equity multiple
- 5.10×
- Total profit
- $199,570
- Equity at exit
- $247,864
Cash invested: $48,692 (down + closing). Projections, not guarantees.
Landlord ↔ Tenant lean methodology
- Overall (STATE)
- 90 Strongly Landlord-Friendly
- State Alabama
- 90 Strongly Landlord-Friendly · R+15
- County
- — inherits STATE
- City
- — inherits STATE
ZIP-level market 36612
- Home prices YoY
- 6.2%
- Active inventory
- 17
- Price-to-rent
- 10.6×
Monthly cashflow live
- Estimated rent
- $1,361 medium interval (Pro) →
- Mortgage (P&I)
- −$912
- Tax from tax record
- −$50 /mo · $600/yr
- Insurance
- −$72
- HOA
- −$0
- Vacancy / Maint / Mgmt
- −$286
- Net cashflow
- $41
Break-even live
UW: 25.0% down · 7.5% · 30yr · 1.5% tax · 5.0% vac · 8.0% maint · 8.0% mgmt
Financing live
Cash to close
- Down payment
- $43,475
- Closing costs
- $5,217
- Reserves months
- —
- Total cash needed
- —
Loan-product check · same deal, 3 products live
Conventional
25% down · 7.5% · 30yr
- Down + closing
- —
- Monthly P&I
- —
- Monthly cashflow
- —
- DSCR
- —
- Eligible?
- —
Personal DTI + credit; lowest rate.
DSCR
20% down · 8.5% · 30yr
- Down + closing
- —
- Monthly P&I
- —
- Monthly cashflow
- —
- DSCR
- —
- Eligible?
- —
No personal income docs; deal must DSCR.
Hard money
10% down · 12.0% · 12mo
- Down + closing
- —
- Monthly P&I
- —
- Monthly cashflow
- —
- DSCR
- —
- Eligible?
- —
Short-term bridge; refi at stabilization.
Listing history 16 events
-
2026-06-18days on market $173,900 Active 7 DOM
-
2026-06-17days on market $173,900 Active 6 DOM
-
2026-06-16days on market $173,900 Active 5 DOM
-
2026-06-15days on market $173,900 Active 4 DOM
-
2026-06-14days on market $173,900 Active 2 DOM
-
2026-06-13statusdays on market $173,900 Active 1 DOM
-
2026-04-06price $173,900
-
2026-02-25price $174,900
-
2026-02-23price $170,900
-
2026-02-19price $171,900
-
2026-02-09price $172,900
-
2026-02-02price $174,900
-
2026-01-26price $175,900
-
2026-01-19price $176,900
-
2026-01-12price $177,900
-
2026-01-06price $178,900
ⓘ Source: listings_history table (triggers on properties + properties_extension) + one-shot
backfill from property_details.listing_events for pre-trigger history.
Tax reassessment forecast AL · Resets to sale price
- Current annual tax
- $600 · $50/mo
- Projected year-2 tax
- $713 · $59/mo
- Expected delta
- +$113/yr (+$9/mo · 18.8%)
ⓘ Screening estimate from a state-policy table — verify with the county assessor before closing.
Climate risk First Street
- Flood 1/10 Low FEMA zone X (unshaded) · 0% chance over 30 yrs
- Wildfire 3/10 Moderate
- Heat 9/10 Extreme 7 d/yr ≥104°F today · 21 d/yr by 30 yrs out
- Wind 9/10 Extreme 99% chance of damaging wind over 30 yrs
- Air quality 2/10 Low 1 unhealthy d/yr today · 1 by 30 yrs out
Nearby sold comps map
Loading sold comps map…
Walkable amenities ~0.75 mi
Loading nearby amenities…
Taxation est. · year 1
- Rental income
- $16,338
- − Mortgage interest
- −$9,741
- − Property taxes
- −$600
- − Insurance
- −$870
- − Repairs & maintenance
- −$1,307
- − Management
- −$1,307
- − Depreciation
- −$5,059
- Taxable loss
- −$2,546
- Est. tax savings @ 24.0%
- +$611
- After-tax cash flow
- $1,105/yr
For passive investors: Depreciation is non-cash, so a rental often shows a tax loss while cash-flowing — sheltering income. Rental losses are passive: they offset passive income freely, and up to $25,000/yr can offset ordinary (W-2) income if you actively participate and your MAGI is under $100k (phasing out to $0 by $150k); unused losses carry forward. On sale, claimed depreciation is recaptured at up to 25%, and gains may owe capital-gains tax (a 1031 exchange can defer both). Figures are a year-1 estimate at your 24.0% rate — not tax advice; consult a CPA.
Schools (NCES district)
- District
- Mobile County
- NCES district ID
- 0102370
- Math proficiency
- 15% ▼ -28.00%
- Reading proficiency
- 39% ▬ 0.00%
- Median HH income
- $42,455
- Composite
- 22.9/100
- National rank
- #8002
- State rank
- #81 of 129 in AL
Livability — Prichard
- Score
- 54/100
- State rank
- #472
- US rank
- #24080
Category grades
Schools grade is shown separately in the Schools card above.
Census & demographics
- Census place
- Prichard, AL
- City population
- 13,402
- Population (ZIP)
- 3,558
Population outlook (Mobile County) Hauer SSP2
- Today (2025)
- 415,303 people
- By 2030
- 411,755 · -0.9%
- By 2040
- 399,670 · -3.8%
- By 2050
- 382,616 · -7.9%
- By 2075
- 337,353 · -18.8%
- By 2100
- 283,391 · -31.8%
Race, ethnicity, and origin ACS 2023
- Neighborhood character
- Predominantly Black (93%)
- Race & ethnicity
- Black 93% White 5% Hispanic / Latino 2%
- Languages at home
- 99% English-only · Spanish 1%
Political lean MEDSL · Mobile
- 2024 margin
- R (+16.4) · D 41.3% · R 57.7%
- 2008→2024 swing
- -7.7pp toward R · 2008: -8.7pp · 2024: -16.4pp
- All cycles
- 2024: R+16.4 2020: R+11.9 2016: R+13.9 2012: R+9.3 2008: R+8.7
Not yet ingested
- Civics
- —
Market trends
- HPI YoY
- ▲ 7.58%
- Current HPI
- 130.8445
- Rent YoY
- —
- Metro
- —
- State GDP YoY
- ▲ 2.94%
- F500 in state
- 4
Industry mix (Fortune 500 HQ in AL)
| Industry | F500 HQs | Revenue |
|---|---|---|
| Financial Services | 1 | $8B |
|
||
| Healthcare | 1 | $5B |
|
||
Price history
-2.8% since first listed10 events — show timeline
- 2026-04-06 Price Changed $173,900 GCMLS AL
- 2026-02-25 Price Changed $174,900 GCMLS AL
- 2026-02-23 Price Changed $170,900 GCMLS AL
- 2026-02-19 Price Changed $171,900 GCMLS AL
- 2026-02-09 Price Changed $172,900 GCMLS AL
- 2026-02-02 Price Changed $174,900 GCMLS AL
- 2026-01-26 Price Changed $175,900 GCMLS AL
- 2026-01-19 Price Changed $176,900 GCMLS AL
- 2026-01-12 Price Changed $177,900 GCMLS AL
- 2026-01-06 Price Changed $178,900 GCMLS AL
Property tax history
+1.8%/yrLatest (2025): $600 · +0.0% YoY. Source: county tax records.
Cash-flow waterfall
monthlySold comps — $/sqft
last 12 mo · ≤1 miLoading sold comps…