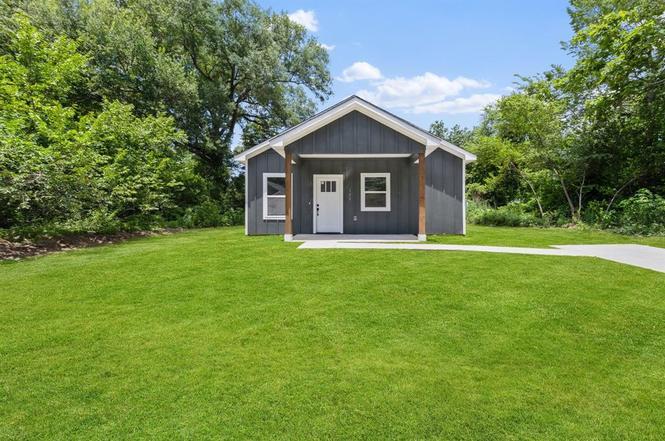
125 Randolph St · Sulphur Springs, TX
Flood risk No data
- FEMA flood zone
- —
- Chance of flooding over 30 yrs
- %
- Est. flood insurance / yr
- —
Fire risk No data
- Est. fire insurance / yr
- —
Heat risk No data
- Hot days now (above °F)
- days/yr
- Hot days in 30 yrs
- days/yr
Wind risk No data
- Chance of severe wind over 30 yrs
- %
Air-quality risk No data
- Unhealthy air days now
- days/yr
- Unhealthy air days in 30 yrs
- days/yr
Risk factors via First Street. Map © Google.
Why this score? — see what drove the D grade
The composite is a weighted blend of 9 inputs, each scored 0–100. Each bar is that input's sub-score; the figure is the points it added to the 100-point composite (weight × sub-score).
- Cash flow +18.0/30.0
- DSCR +5.6/10.0
- 1% rule +4.8/10.0
- Schools +3.6/10.0
- Livability +3.5/5.0
- Rent growth +2.5/5.0
- Condition / age +2.5/5.0
- ARV discount +0.0/15.0
- Appreciation +0.0/10.0
$185,000
🖨 Deal sheet 📄 Offer letter ✓ Due diligence
Listing remarks
Beautiful New construction home in Sulphur Springs, TX featuring 2 bedrooms and 2 bathrooms. This home offers an open floor plan with modern floors throughout and a spacious kitchen with beautiful custom countertops and ample cabinet space. The living and dining areas connect seamlessly for easy everyday living and entertaining. Located on a quiet street, this move-in-ready home combines functional design with modern finishes!
Key facts
- Quiet street
- Open floor plan
- Move-in-ready
Tags
Neighborhood map
What this means for you Summary
Snapshot
- This is a 2-bed/2.0-bath single-family listed at $185k.
Deal economics
- At list price, monthly cash flow is $158 ($2k/yr) — positive.
- The deal already cash-flows at list — no discount required.
- To meet the 1% rule (rent ≥ 1% of price), the offer needs to be $182k (1.7% below list).
- Recommended offer: $182k (1.7% below list) — sets the bar for 1% rule.
- Cap rate 7.3% vs local median 4.3% in Sulphur Springs — top-decile yield for the area; either an underpriced asset or a hidden risk that comps aren't pricing in. Stress-test before assuming the spread holds.
Location & tenants
- Location reads 70/100 on livability (#350 in TX) — a middle-class / working-renter tenant base. Strengths: cost of living A+, housing A+, crime A; Watch: employment D+, schools D, amenities F.
- Sulphur Springs ISD (town): math 46% / reading 40% proficiency, ranked #323 of 826 in TX (top 39%) — families likely to look elsewhere, expect single-tenant / working-renter base with shorter leases.
- Market conditions: 378 active listings in the ZIP; 3 comparable units currently listed for rent nearby; rentals lingering (median 44d on market — plan ~5-8 weeks vacancy on turnover, expect pricing pressure); 100% of comp listings sitting > 30 days — soft ceiling on asking rent; 66 units permitted in Hopkins County in 2024 (0 in 5+ unit buildings).
- This rent runs 31% of the median local income ($70k/yr) — at the standard rent-burdened threshold; future hikes will face affordability resistance.
Forward outlook
- Local home prices are declining (-3.0%/yr); year-one equity from $1k of loan paydown is wiped out by about $6k of value loss. Plan a longer hold.
- Hopkins County population projected at +6% by 2050 — modest demand growth; plan on rents tracking national, not racing it.
Negotiation context
- Only 1 days on market — expect competitive offers; lowballing is unlikely to land.
Questions for the listing agent
- Is there a deadline driving the sale (1031 exchange, divorce, estate, relocation)? That informs how much negotiation room exists.
- Schools are D-rated, which usually means shorter tenancies and higher turnover. Who's the typical renter profile here, and what's been the actual vacancy rate?
- The area grade is low — what's the realistic commute time and amenity access for the typical tenant pool here? Any planned neighborhood developments (good or bad) we should know about?
- What's the average days-on-market for RENTAL listings here right now (not sales)? A rising rental-DOM trend means longer vacancies and softer asking-rent achievability than the comps imply.
- What's the recent tenant-quality profile in this submarket — average credit score on applications, eviction rate, late-payment / NSF rate, and stable-employment percentage? A property-management company in the area should have these aggregated.
- How much new for-sale + rental construction is in the pipeline within 1–3 miles? Heavy new supply typically softens prices + rents 12–24 months out; constrained supply supports both.
Investment metrics
- 1% rule
- 0.98% ✗
- Cap rate
- 7.32%
- Cash-on-cash
- 3.66%
- DSCR
- 1.16
- GRM
- 8.5
CMA / ARV
- ARV (on-the-fly)
- $137,920
- Comps found
- 8
Show comp detail 8 sales within ~0.75 mi
| Address | Dist | Beds/Ba | Sqft | Sold | Price | $/sf | Match |
|---|---|---|---|---|---|---|---|
| 130 Jackson St N | 0.34mi | 2/1.0 | 872 (+1%) | 7mo | $137,900 | $158 | 72 |
| 207 Whitworth St | 0.44mi | 2/1.0 | 872 (+1%) | 11mo | $125,000 | $143 | 64 |
| 312 Calvert St | 0.30mi | 3/2.0 (+1) | 841 (-2%) | 23mo | $169,000 | $201 | 58 |
| 318 Beckham St W | 0.25mi | 2/1.0 | 970 (+12%) | 10mo | $59,900 | $62 | 56 |
| 105 Ardis St | 0.23mi | 2/1.0 | 988 (+15%) | 10mo | $65,000 | $66 | 53 |
| 814 Freeman St | 0.34mi | 2/1.0 | 750 (-13%) | 6mo | $119,900 | $160 | 53 |
| 211 Weaver Dr | 0.43mi | 2/1.0 | 780 (-10%) | 13mo | $132,000 | $169 | 49 |
| 304 Jarbo St | 0.67mi | 2/1.0 | 930 (+8%) | 19mo | $178,000 | $191 | 36 |
Match score weights: distance 35% · size 25% · config 20% · recency 20%. Top-matched comps best support the ARV.
Projected returns pro-forma
-3.0% appreciation · 3.0% rent growth · sell at horizon
- IRR
- -10.5%
- Equity multiple
- 0.62×
- Total profit
- $-19,883
- Equity at exit
- $27,584
- IRR
- -1.2%
- Equity multiple
- 0.92×
- Total profit
- $-4,239
- Equity at exit
- $15,995
Cash invested: $51,800 (down + closing). Projections, not guarantees.
Landlord ↔ Tenant lean methodology
- Overall (STATE)
- 87 Strongly Landlord-Friendly
- State Texas
- 87 Strongly Landlord-Friendly · R+5
- County
- — inherits STATE
- City
- — inherits STATE
ZIP-level market 75482
- Active inventory
- 378
- Price-to-rent
- 8.5×
Monthly cashflow live
- Estimated rent
- $1,818 medium interval (Pro) →
- Mortgage (P&I)
- −$970
- Tax est. 1.5%
- −$231 /mo · $2,775/yr
- Insurance
- −$77
- HOA
- −$0
- Vacancy / Maint / Mgmt
- −$382
- Net cashflow
- $158
Break-even live
UW: 25.0% down · 7.5% · 30yr · 1.5% tax · 5.0% vac · 8.0% maint · 8.0% mgmt
Financing live
Cash to close
- Down payment
- $46,250
- Closing costs
- $5,550
- Reserves months
- —
- Total cash needed
- —
Loan-product check · same deal, 3 products live
Conventional
25% down · 7.5% · 30yr
- Down + closing
- —
- Monthly P&I
- —
- Monthly cashflow
- —
- DSCR
- —
- Eligible?
- —
Personal DTI + credit; lowest rate.
DSCR
20% down · 8.5% · 30yr
- Down + closing
- —
- Monthly P&I
- —
- Monthly cashflow
- —
- DSCR
- —
- Eligible?
- —
No personal income docs; deal must DSCR.
Hard money
10% down · 12.0% · 12mo
- Down + closing
- —
- Monthly P&I
- —
- Monthly cashflow
- —
- DSCR
- —
- Eligible?
- —
Short-term bridge; refi at stabilization.
Rent comps 3 comps
| Address | Beds | Baths | Sqft | Rent | $/sqft | DOM | Units | Dist |
|---|---|---|---|---|---|---|---|---|
| 709 Fuller St Sulphur Springs, TX | 3.0 | 2.0 | 1100 | $2,200 | $2.00 | 43d | 1 | 0.36mi |
| 325 League St S Sulphur Springs, TX | 3.0 | 1.0 | 1112 | $2,000 | $1.80 | 43d | 1 | 1.16mi |
| 210 Duckworth St Sulphur Springs, TX | 1.0–2.0 | 1.0 | 700 | $1,000 | $1.43 | 43d | 2 | 1.34mi |
Listing history 2 events
-
2026-06-19remarks 430-char remark
-
2026-06-19$185,000 Active 1 DOM
ⓘ Source: listings_history table (triggers on properties + properties_extension) + one-shot
backfill from property_details.listing_events for pre-trigger history.
Nearby sold comps map
Loading sold comps map…
Walkable amenities ~0.75 mi
Loading nearby amenities…
Taxation est. · year 1
- Rental income
- $21,821
- − Mortgage interest
- −$10,363
- − Property taxes
- −$2,775
- − Insurance
- −$925
- − Repairs & maintenance
- −$1,746
- − Management
- −$1,746
- − Depreciation
- −$5,382
- Taxable loss
- −$1,115
- Est. tax savings @ 24.0%
- +$268
- After-tax cash flow
- $2,164/yr
For passive investors: Depreciation is non-cash, so a rental often shows a tax loss while cash-flowing — sheltering income. Rental losses are passive: they offset passive income freely, and up to $25,000/yr can offset ordinary (W-2) income if you actively participate and your MAGI is under $100k (phasing out to $0 by $150k); unused losses carry forward. On sale, claimed depreciation is recaptured at up to 25%, and gains may owe capital-gains tax (a 1031 exchange can defer both). Figures are a year-1 estimate at your 24.0% rate — not tax advice; consult a CPA.
Schools (NCES district)
- District
- Sulphur Springs ISD
- NCES district ID
- 4841820
- Math proficiency
- 46% ▼ -7.00%
- Reading proficiency
- 40% ▼ -4.00%
- Median HH income
- $42,871
- Composite
- 36.33/100
- National rank
- #4692
- State rank
- #323 of 826 in TX
Livability — Sulphur Springs
- Score
- 70/100
- State rank
- #350
- US rank
- #7665
Category grades
Schools grade is shown separately in the Schools card above.
Census & demographics
- Census place
- Sulphur Springs, TX
- County
- Hopkins County · 26,483 people
- City population
- 26,483
- Metro
- Sulphur Springs, TX
- Population (ZIP)
- 26,483
- Household income
- $69,970
- Rent vs Own
- Severe rent burden
- 543.0
Population outlook (Hopkins County) Hauer SSP2
- Today (2025)
- 38,107 people
- By 2030
- 38,867 · +2.0%
- By 2040
- 40,009 · +5.0%
- By 2050
- 40,448 · +6.1%
- By 2075
- 40,669 · +6.7%
- By 2100
- 37,234 · -2.3%
Race, ethnicity, and origin ACS 2023
- Neighborhood character
- Predominantly White (70%)
- Race & ethnicity
- White 70% Hispanic / Latino 17% Black 9% Two or more races 7% Asian 1%
- Hispanic origin (detail)
- Mexican 15%
- Common ancestry
- Slovak 2% Lithuanian 2% Iranian 1%
- Foreign-born
- 9% · Canada, Vietnam
- Languages at home
- 84% English-only · Spanish 14% Vietnamese 1%
Political lean MEDSL · Hopkins
- 2024 margin
- Solid R (+64.6) · D 17.4% · R 82.0%
- 2008→2024 swing
- -20.0pp toward R · 2008: -44.7pp · 2024: -64.6pp
- All cycles
- 2024: R+64.6 2020: R+60.7 2016: R+60.8 2012: R+55.4 2008: R+44.7
Not yet ingested
- Civics
- —
Market trends
- HPI YoY
- ▼ -125.79%
- Current HPI
- 156.0526
- Rent YoY
- —
- Metro
- Sulphur Springs, TX
- State GDP YoY
- ▲ 3.95%
- F500 in state
- 110
Industry mix (Fortune 500 HQ in TX)
| Industry | F500 HQs | Revenue |
|---|---|---|
| Energy | 16 | $1,198B |
|
||
| Technology | 5 | $198B |
|
||
| Engineering / Construction | 4 | $72B |
|
||
| Energy Services | 3 | $60B |
|
||
| Utilities | 3 | $41B |
|
||
| Healthcare | 2 | $330B |
|
||
Cash-flow waterfall
monthlySold comps — $/sqft
last 12 mo · ≤1 miLoading sold comps…