 Fourplex
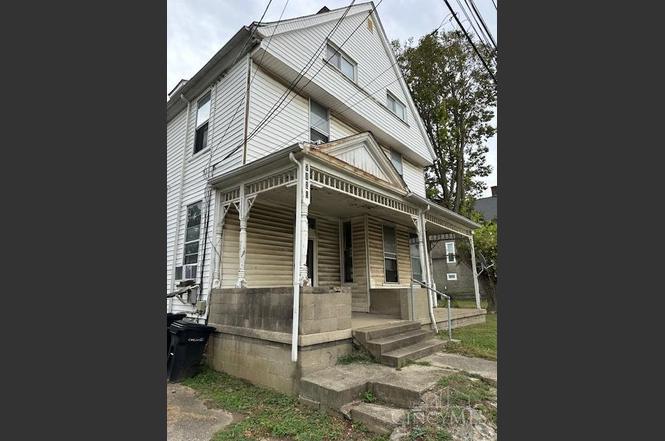
7126 River Rd · Cincinnati, OH
Flood risk 5/10 · Moderate
- FEMA flood zone
- X (shaded)
- Chance of flooding over 30 yrs
- 0.26%
- Est. flood insurance / yr
- $473 – $860
Fire risk 1/10 · Minimal
- Est. fire insurance / yr
- $713 – $1,323
Heat risk 4/10 · Minor
- Hot days now (above 102°F)
- 7 days/yr
- Hot days in 30 yrs
- 19 days/yr
Wind risk 2/10 · Minimal
- Chance of severe wind over 30 yrs
- 1.0%
Air-quality risk 2/10 · Minimal
- Unhealthy air days now
- 1 days/yr
- Unhealthy air days in 30 yrs
- 2 days/yr
Risk factors via First Street. Map © Google.
Why this score? — see what drove the D grade
The composite is a weighted blend of 9 inputs, each scored 0–100. Each bar is that input's sub-score; the figure is the points it added to the 100-point composite (weight × sub-score).
- Cash flow +15.0/30.0
- ARV discount +7.5/15.0
- 1% rule +5.0/10.0
- DSCR +5.0/10.0
- Livability +4.0/5.0
- Rent growth +2.5/5.0
- Schools +2.5/10.0
- Condition / age +2.5/5.0
- Appreciation +0.0/10.0
$100,000
🖨 Deal sheet 📄 Offer letter ✓ Due diligence
Multi-family units
County records classify this as Multi-Family (2-4 Unit). Listing-text estimate: 4 units. confirmed
Listing remarks MLS
Investment opportunity. 4 unit multi=family that needs work. Cash or FHA Rehab loan
Key facts
- 0.23 acre lot
- 4 garage spots
- Built 1890
Property features AI
Exterior
- Parking: Gravel driveway with off-street parking; 4 garage spaces
- Utilities: Public water; Public sewer; Natural gas
- Home design: Duplex structure; Three or more levels
- Construction: Shingle roof; Stone foundation
- Exterior features: Storm windows; Vinyl siding
Interior
- Bedrooms: Four 1-bedroom units
- Bathrooms: Each unit has one full bathroom (4 full bathrooms total)
- Heating & cooling: Hot water heating
- Interior features: Full basement; Handyman special
Neighborhood map
What this means for you Summary
Snapshot
- This is a 4 × 4-bed/4.0-bath units multifamily listed at $100k.
Deal economics
- At list price, monthly cash flow is $4k ($47k/yr) — positive. Per door: $977/mo.
- The deal already cash-flows at list — no discount required.
- Meets the 1% rule at list price ($6k rent vs $100k).
- Recommended offer: $88k (12.0% below list) — sets the bar for market timing.
- Cap rate 53.2% vs local median 3.9% in Cincinnati — top-decile yield for the area; either an underpriced asset or a hidden risk that comps aren't pricing in. Stress-test before assuming the spread holds.
Location & tenants
- Location reads 80/100 on livability (#130 in OH, #1,856 nationally) — a professional / high-income tenant draw. Strengths: amenities A+, commute A+, cost of living A+; Watch: employment D, crime F.
- Cincinnati Public Schools (urban): math 25% / reading 36% proficiency, ranked #581 of 656 in OH (top 89%) — families likely to look elsewhere, expect single-tenant / working-renter base with shorter leases; 70% free/reduced lunch — lower-income household profile, screen leases tightly.
- Market conditions: 82 active listings in the ZIP; high-income renter base; 801 units permitted in Hamilton County in 2024 (190 in 5+ unit buildings).
- At $6,033/mo this rent would consume 66% of the median local household income ($110k/yr) — very limited rent-growth headroom before tenants either downsize or default.
Forward outlook
- Local home prices are declining (-3.0%/yr); year-one equity from $691 of loan paydown is wiped out by about $3k of value loss. Plan a longer hold.
- At projected returns (-3.0% appreciation + 3.0% rent growth), your $28k cash investment doubles in ~1 year — after that, you're playing with house money.
Negotiation context
- It's been on market 156 days — a 12% lower offer ($88k) is reasonable based on typical stale-listing flexibility.
- 6 sale attempts since 3y ago with the ask held roughly flat each time — persistent listings suggest the price (not the market) is what's stuck; bring a comps-based counter.
Risks & watch-outs
- Watch-outs: property tax is 3.5% of price; built in 1890 — expect roof / HVAC / electrical / plumbing capex.
- Climate carrying-cost: moderate flood risk — expect insurance premiums to compound above CPI over the hold.
Questions for the listing agent
- It's been on market 156 days. Have you received any prior offers? Is the seller open to a 12% concession, seller financing, or rate buy-down credit?
- Can we see the unit-by-unit rent roll, current vacancy, and any below-market leases? What's the average tenancy length?
- What capital expenditures (roof, boiler, parking lot, exteriors) have been made in the last 5 years, and what's planned in the next 2?
- Built in 1890 — when were the roof, HVAC, electrical panel, plumbing, and water heater last replaced?
- Property tax is high relative to price — has the assessment been appealed recently, and will the sale trigger a re-assessment?
- Why hasn't it sold? Are there any deal-killer items the seller is aware of (foundation, flood, title, zoning, code violations)?
- Is there a deadline driving the sale (1031 exchange, divorce, estate, relocation)? That informs how much negotiation room exists.
- Schools are B-rated — typically a magnet for longer-tenancy family renters. What's the average tenant stay here, and is there a school-zone premium baked into asking?
- Crime grade is F in this area — have there been break-ins, vandalism, or insurance claims at this property in the last 3 years? What carrier currently insures it and at what premium?
- The area grade is low — what's the realistic commute time and amenity access for the typical tenant pool here? Any planned neighborhood developments (good or bad) we should know about?
- What's the average days-on-market for RENTAL listings here right now (not sales)? A rising rental-DOM trend means longer vacancies and softer asking-rent achievability than the comps imply.
- What's the recent tenant-quality profile in this submarket — average credit score on applications, eviction rate, late-payment / NSF rate, and stable-employment percentage? A property-management company in the area should have these aggregated.
- How much new apartment / multifamily construction is in the pipeline within 1–3 miles? Heavy new supply (>2% of stock underway) typically softens rents 12–24 months out; light construction supports rent growth.
Investment metrics
- 1% rule
- 6.03% ✓
- Cap rate
- 53.17%
- Cash-on-cash
- 167.40%
- DSCR
- 8.45
- GRM
- 1.4
CMA / ARV
No comps found within radius.
Projected returns pro-forma
-3.0% appreciation · 3.0% rent growth · sell at horizon
- IRR
- —
- Equity multiple
- 9.31×
- Total profit
- $232,771
- Equity at exit
- $14,910
- IRR
- —
- Equity multiple
- 19.71×
- Total profit
- $523,828
- Equity at exit
- $8,646
Cash invested: $28,000 (down + closing). Projections, not guarantees.
Landlord ↔ Tenant lean methodology
- Overall (STATE)
- 73 Landlord-Friendly
- State Ohio
- 73 Landlord-Friendly · R+6
- County
- — inherits STATE
- City
- — inherits STATE
ZIP-level market 45233
- Active inventory
- 82
- Price-to-rent
- 5.5×
Monthly cashflow live
- Estimated rent
- $6,033 medium interval (Pro) →
- Mortgage (P&I)
- −$524
- Tax from tax record
- −$294 /mo · $3,527/yr
- Insurance
- −$42
- HOA
- −$0
- Vacancy / Maint / Mgmt
- −$1,267
- Net cashflow
- $3,906
Break-even live
4-unit breakdown (identical units grouped — click to expand)
| Units | Beds | Baths | Est. rent |
|---|---|---|---|
| 4× units | 4 | 4 | $6,032 |
| #1 | 4 | 4 | $1,508 |
| #2 | 4 | 4 | $1,508 |
| #3 | 4 | 4 | $1,508 |
| #4 | 4 | 4 | $1,508 |
| Total (4 units) | $6,033 | ||
UW: 25.0% down · 7.5% · 30yr · 1.5% tax · 5.0% vac · 8.0% maint · 8.0% mgmt
Financing live
Cash to close
- Down payment
- $25,000
- Closing costs
- $3,000
- Reserves months
- —
- Total cash needed
- —
Loan-product check · same deal, 3 products live
Conventional
25% down · 7.5% · 30yr
- Down + closing
- —
- Monthly P&I
- —
- Monthly cashflow
- —
- DSCR
- —
- Eligible?
- —
Personal DTI + credit; lowest rate.
DSCR
20% down · 8.5% · 30yr
- Down + closing
- —
- Monthly P&I
- —
- Monthly cashflow
- —
- DSCR
- —
- Eligible?
- —
No personal income docs; deal must DSCR.
Hard money
10% down · 12.0% · 12mo
- Down + closing
- —
- Monthly P&I
- —
- Monthly cashflow
- —
- DSCR
- —
- Eligible?
- —
Short-term bridge; refi at stabilization.
Listing history 28 events
-
2026-06-18days on market $100,000 Active 156 DOM
-
2026-06-17days on market $100,000 Active 155 DOM
-
2026-06-16days on market $100,000 Active 154 DOM
-
2026-06-15days on market $100,000 Active 153 DOM
-
2026-06-13days on market $100,000 Active 151 DOM
-
2026-06-13days on market $100,000 Active 150 DOM
-
2026-06-09days on market $100,000 Active 147 DOM
-
2026-06-08days on market $100,000 Active 146 DOM
-
2026-06-07days on market $100,000 Active 145 DOM
-
2026-06-03days on market $100,000 Active 141 DOM
-
2026-06-02days on market $100,000 Active 140 DOM
-
2026-06-01days on market $100,000 Active 139 DOM
-
2026-05-31days on market $100,000 Active 138 DOM
-
2026-05-17status Active
-
2026-03-16historical Contingency Pending
-
2026-01-13$100,000 Active
-
2025-12-01historical 83-char remark
Show marketing remark (83 chars)
Investment opportunity. 4 unit multi=family that needs work. Cash or FHA Rehab loan
-
2025-08-05status Active 83-char remark
Show marketing remark (83 chars)
Investment opportunity. 4 unit multi=family that needs work. Cash or FHA Rehab loan
-
2025-05-30historical Contingency Pending 83-char remark
Show marketing remark (83 chars)
Investment opportunity. 4 unit multi=family that needs work. Cash or FHA Rehab loan
-
2025-05-05price $100,000 83-char remark
Show marketing remark (83 chars)
Investment opportunity. 4 unit multi=family that needs work. Cash or FHA Rehab loan
-
2025-03-24price $114,900 83-char remark
Show marketing remark (83 chars)
Investment opportunity. 4 unit multi=family that needs work. Cash or FHA Rehab loan
-
2025-02-25status Active 83-char remark
Show marketing remark (83 chars)
Investment opportunity. 4 unit multi=family that needs work. Cash or FHA Rehab loan
-
2025-02-24historical Contingency Pending 83-char remark
Show marketing remark (83 chars)
Investment opportunity. 4 unit multi=family that needs work. Cash or FHA Rehab loan
-
2025-01-29$120,000 Active 83-char remark
Show marketing remark (83 chars)
Investment opportunity. 4 unit multi=family that needs work. Cash or FHA Rehab loan
-
2024-01-08soldstatus $90,000
-
2023-12-29soldstatus $90,000 Closed 16-char remark
Show marketing remark (16 chars)
Sold Before Sent
-
2023-12-15historical 16-char remark
Show marketing remark (16 chars)
Sold Before Sent
-
2023-12-15$90,000 16-char remark
Show marketing remark (16 chars)
Sold Before Sent
ⓘ Source: listings_history table (triggers on properties + properties_extension) + one-shot
backfill from property_details.listing_events for pre-trigger history.
Tax reassessment forecast OH · Partial reset (capped growth)
- Current annual tax
- $3,527 · $294/mo
- Projected year-2 tax
- $3,527 · $294/mo
- Expected delta
- $0/yr ($0/mo · 0.0%)
ⓘ Screening estimate from a state-policy table — verify with the county assessor before closing.
Climate risk First Street
- Flood 5/10 Major FEMA zone X (shaded) · 26% chance over 30 yrs
- Wildfire 1/10 Low
- Heat 4/10 Moderate 7 d/yr ≥102°F today · 19 d/yr by 30 yrs out
- Wind 2/10 Low 100% chance of damaging wind over 30 yrs
- Air quality 2/10 Low 1 unhealthy d/yr today · 2 by 30 yrs out
Nearby sold comps map
Loading sold comps map…
Walkable amenities ~0.75 mi
Loading nearby amenities…
Taxation est. · year 1
- Rental income
- $72,396
- − Mortgage interest
- −$5,602
- − Property taxes
- −$3,527
- − Insurance
- −$500
- − Repairs & maintenance
- −$5,792
- − Management
- −$5,792
- − Depreciation
- −$2,909
- Taxable income
- $48,275
- Est. tax owed @ 24.0%
- −$11,586
- After-tax cash flow
- $35,287/yr
For passive investors: Depreciation is non-cash, so a rental often shows a tax loss while cash-flowing — sheltering income. Rental losses are passive: they offset passive income freely, and up to $25,000/yr can offset ordinary (W-2) income if you actively participate and your MAGI is under $100k (phasing out to $0 by $150k); unused losses carry forward. On sale, claimed depreciation is recaptured at up to 25%, and gains may owe capital-gains tax (a 1031 exchange can defer both). Figures are a year-1 estimate at your 24.0% rate — not tax advice; consult a CPA.
Schools (NCES district)
- District
- Cincinnati Public Schools
- NCES district ID
- 3904375
- Math proficiency
- 25% ▼ -19.00%
- Reading proficiency
- 36% ▼ -14.00%
- Median HH income
- $35,743
- Composite
- 25.21/100
- National rank
- #7508
- State rank
- #581 of 656 in OH
Livability — Cincinnati
- Score
- 80/100
- State rank
- #130
- US rank
- #1856
Category grades
Schools grade is shown separately in the Schools card above.
Census & demographics
- Census place
- Cincinnati, OH
- County
- Hamilton · 838,887 people
- City population
- 505,555
- Metro
- Cincinnati, OH-KY-IN
- Population (ZIP)
- 15,362
- Household income
- $110,408
- Rent vs Own
- Severe rent burden
- 7.9
Population outlook (Hamilton County) Hauer SSP2
- Today (2025)
- 826,054 people
- By 2030
- 830,947 · +0.6%
- By 2040
- 832,319 · +0.8%
- By 2050
- 822,428 · -0.4%
- By 2075
- 788,688 · -4.5%
- By 2100
- 710,674 · -14.0%
Race, ethnicity, and origin ACS 2023
- Neighborhood character
- Predominantly White (92%)
- Race & ethnicity
- White 92% Black 4% Two or more races 3%
- Common ancestry
- Slovak 3% Iranian 2% Romanian 1%
- Foreign-born
- 1%
- Languages at home
- 99% English-only · Spanish 1%
Political lean MEDSL · Hamilton
- 2024 margin
- D (+14.9) · D 57.0% · R 42.1%
- 2008→2024 swing
- +7.9pp toward D · 2008: 7.0pp · 2024: 14.9pp
- All cycles
- 2024: D+14.9 2020: D+15.9 2016: D+9.5 2012: D+4.9 2008: D+7.0
Not yet ingested
- Civics
- —
Market trends
- HPI YoY
- ▼ -143.43%
- Current HPI
- 214.0365
- Rent YoY
- —
- Metro
- —
- State GDP YoY
- ▲ 1.98%
- F500 in state
- 48
Industry mix (Fortune 500 HQ in OH)
| Industry | F500 HQs | Revenue |
|---|---|---|
| Insurance | 3 | $145B |
|
||
| Industrial Machinery | 3 | $49B |
|
||
| Financial Services | 3 | $24B |
|
||
| Consumer Goods | 2 | $93B |
|
||
| Aerospace / Defense | 2 | $47B |
|
||
| Utilities | 2 | $33B |
|
||
Price history
+11.1% since first listed15 events — show timeline
- 2026-05-17 Relisted — Cincy MLS
- 2026-03-16 Contingent — Cincy MLS
- 2026-01-13 Listed $100,000 Cincy MLS
- 2025-12-01 Listing Removed — Cincy MLS
- 2025-08-05 Relisted — Cincy MLS
- 2025-05-30 Contingent — Cincy MLS
- 2025-05-05 Price Changed $100,000 Cincy MLS
- 2025-03-24 Price Changed $114,900 Cincy MLS
- 2025-02-25 Relisted — Cincy MLS
- 2025-02-24 Contingent — Cincy MLS
- 2025-01-29 Listed $120,000 Cincy MLS
- 2024-01-08 Sold (Public Records) $90,000 Public Records
- 2023-12-29 Sold (MLS) $90,000 Cincy MLS
- 2023-12-15 Listing Removed — Cincy MLS
- 2023-12-15 Listed $90,000 Cincy MLS
Property tax history
+10.0%/yrLatest (2025): $3,527 · +25.9% YoY. Source: county tax records.
Cash-flow waterfall
monthlySold comps — $/sqft
last 12 mo · ≤1 miLoading sold comps…