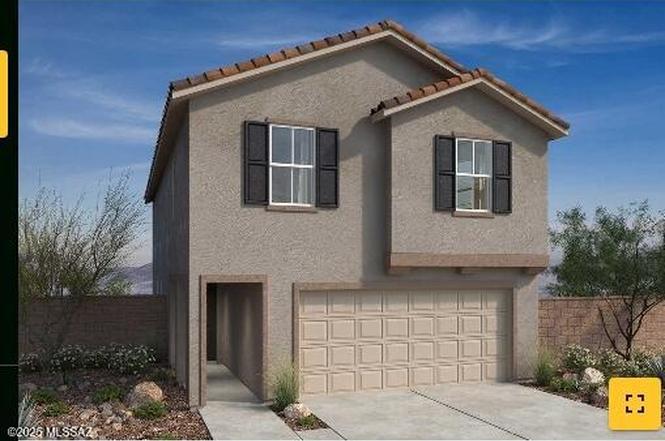
 🏗️ New Construction
10566 S Dominguez Dr · Tucson, AZ
Flood risk 1/10 · Minimal
- FEMA flood zone
- X (unshaded)
- Chance of flooding over 30 yrs
- 0.0%
- Est. flood insurance / yr
- $507 – $1,088
Fire risk 7/10 · Major
- Est. fire insurance / yr
- $610 – $1,132
Heat risk 7/10 · Major
- Hot days now (above 102°F)
- 7 days/yr
- Hot days in 30 yrs
- 18 days/yr
Wind risk 1/10 · Minimal
- Chance of severe wind over 30 yrs
- —
Air-quality risk 1/10 · Minimal
- Unhealthy air days now
- 0 days/yr
- Unhealthy air days in 30 yrs
- 0 days/yr
Risk factors via First Street. Map © Google.
Why this score? — see what drove the F grade
The composite is a weighted blend of 9 inputs, each scored 0–100. Each bar is that input's sub-score; the figure is the points it added to the 100-point composite (weight × sub-score).
- ARV discount +7.5/15.0
- Schools +4.9/10.0
- Cash flow +4.5/30.0
- Rent growth +3.8/5.0
- Livability +3.7/5.0
- Condition / age +2.5/5.0
- 1% rule +0.6/10.0
- DSCR +0.0/10.0
- Appreciation +0.0/10.0
$339,990
🖨 Deal sheet 📄 Offer letter ✓ Due diligence
Listing remarks
This two-story home features a 9-ft. ceiling height at the first floor and 7x48'' vinyl plank flooring in the color Wild Dunes in the main areas, plus carpet. Covered patio. The modern kitchen features granite countertops, 42'' upper cabinets, a kitchen island, walk-in pantry, and Whirlpool® stainless steel appliances. Upstairs, the primary suite boasts a walk-in closet, shower, and extended dual-sink vanity. There is a loft on the second floor and a convenient laundry room. Price includes discount predicated on using seller's preferred lender KBHS.
Key facts
- Covered patio
- Modern kitchen
- Granite countertops
Tags
Neighborhood map
What this means for you Summary
Snapshot
- This is a 4-bed/3.0-bath single-family listed at $340k.
Deal economics
- At list price, monthly cash flow is $-1k ($-13k/yr) — negative.
- To cash-flow at today's rent, offer at most $309k (9.1% below list).
- To meet the 1% rule (rent ≥ 1% of price), the offer needs to be $235k (31.0% below list).
- Recommended offer: $235k (31.0% below list) — sets the bar for 1% rule.
Location & tenants
- Location reads 74/100 on livability (#17 in AZ, #4,502 nationally) — a middle-class / working-renter tenant base. Strengths: commute A+, cost of living A+, housing A+; Watch: health & safety C-, crime F, employment D-.
- Vail Unified District (4413) (rural): math 52% / reading 57% proficiency, ranked #26 of 249 in AZ (top 10%) — acceptable for families but not a draw, mixed tenant base, ~2y average lease; only 17% free/reduced lunch — higher-income household profile.
- Zoned schools: Acacia Elementary School (math 47% / reading 53%, grade D+, #263 of 1,109 statewide, top 24%, 743 students, 29% FRL); Old Vail Middle School (math 45% / reading 50%, grade C-, #36 of 218 statewide, top 18%, 798 students, 17% FRL).
- Market conditions: Rents rising fast (+5.0%/yr); 655 active listings in the ZIP; 18 comparable units currently listed for rent nearby; rentals at typical pace (median 24d on market — plan ~3-4 weeks tenant-placement turnaround); 44% of comp listings sitting > 30 days — soft ceiling on asking rent; high-income renter base; 5,268 units permitted in Pima County in 2024 (996 in 5+ unit buildings).
Forward outlook
- Local home prices are declining (-3.0%/yr); year-one equity from $3k of loan paydown is wiped out by about $13k of value loss. Plan a longer hold.
- Pima County population projected at +8% by 2050 — modest demand growth; plan on rents tracking national, not racing it.
Negotiation context
- It's been on market 293 days — a 12% lower offer ($299k) is reasonable based on typical stale-listing flexibility.
- 2 sale attempts; this cycle's ask is 14368% above the opening price — seller raised mid-cycle; expect resistance to lowballs.
Risks & watch-outs
- Climate carrying-cost: major wildfire risk; extreme-heat days projected 7→18/yr by 2055 (HVAC capex compounding) — expect insurance premiums to compound above CPI over the hold.
Questions for the listing agent
- What do current leases actually rent for vs. the listed asking? Can we see a recent rent roll and the last 12 months of T-12 income?
- It's been on market 293 days. Have you received any prior offers? Is the seller open to a 31% concession, seller financing, or rate buy-down credit?
- What does the HOA fee cover, when was the last increase, and are there any pending special assessments or reserve-fund shortfalls?
- Why hasn't it sold? Are there any deal-killer items the seller is aware of (foundation, flood, title, zoning, code violations)?
- Is there a deadline driving the sale (1031 exchange, divorce, estate, relocation)? That informs how much negotiation room exists.
- Schools are D-rated, which usually means shorter tenancies and higher turnover. Who's the typical renter profile here, and what's been the actual vacancy rate?
- Crime grade is F in this area — have there been break-ins, vandalism, or insurance claims at this property in the last 3 years? What carrier currently insures it and at what premium?
- The area grade is low — what's the realistic commute time and amenity access for the typical tenant pool here? Any planned neighborhood developments (good or bad) we should know about?
- What's the average days-on-market for RENTAL listings here right now (not sales)? A rising rental-DOM trend means longer vacancies and softer asking-rent achievability than the comps imply.
- What's the recent tenant-quality profile in this submarket — average credit score on applications, eviction rate, late-payment / NSF rate, and stable-employment percentage? A property-management company in the area should have these aggregated.
- How much new for-sale + rental construction is in the pipeline within 1–3 miles? Heavy new supply typically softens prices + rents 12–24 months out; constrained supply supports both.
Investment metrics
- 1% rule
- 0.56% ✗
- Cap rate
- 3.21%
- Cash-on-cash
- -11.02%
- DSCR
- 0.51
- GRM
- 14.8
CMA / ARV
- ARV (on-the-fly)
- $417,585
- Comps found
- 12
Show comp detail 12 sales within ~0.75 mi
| Address | Dist | Beds/Ba | Sqft | Sold | Price | $/sf | Match |
|---|---|---|---|---|---|---|---|
| 12028 Ryscott Cir | 0.54mi | 4/3.0 | 2,040 (+0%) | 0mo | $425,000 | $208 | 74 |
| 12288 E Morris Carson Dr | 0.60mi | 4/3.0 | 2,058 (+1%) | 0mo | $440,900 | $214 | 70 |
| 12240 E Morris Carson Dr | 0.56mi | 4/2.0 | 2,053 (+1%) | 3mo | $407,900 | $199 | 66 |
| 12264 E Morris Carson Dr | 0.58mi | 4/2.0 | 2,053 (+1%) | 2mo | $421,000 | $205 | 66 |
| 12087 E Chavez Dr | 0.19mi | 3/2.5 (-1) | 1,768 (-13%) | 0mo | $340,000 | $192 | 62 |
| 12254 E Patricia Ann Dr | 0.53mi | 4/2.5 | 2,264 (+11%) | 1mo | $378,900 | $167 | 54 |
| 12235 E Patricia Ann Dr | 0.50mi | 4/2.5 | 2,264 (+11%) | 3mo | $384,000 | $170 | 54 |
| 12053 Ryscott Cir | 0.54mi | 4/3.0 | 1,810 (-11%) | 3mo | $379,990 | $210 | 54 |
| 12246 E Patricia Ann Dr | 0.53mi | 4/2.5 | 2,264 (+11%) | 2mo | $388,900 | $172 | 54 |
| 12237 E Morris Carson Dr | 0.54mi | 4/2.5 | 2,264 (+11%) | 3mo | $383,400 | $169 | 52 |
| 12248 E Morris Carson Dr | 0.57mi | 4/2.0 | 1,825 (-10%) | 1mo | $398,900 | $219 | 52 |
| 12216 E Morris Carson Dr | 0.54mi | 4/2.0 | 1,825 (-10%) | 3mo | $388,900 | $213 | 51 |
Match score weights: distance 35% · size 25% · config 20% · recency 20%. Top-matched comps best support the ARV.
Projected returns pro-forma
-3.0% appreciation · 5.02% rent growth · sell at horizon
- IRR
- -34.1%
- Equity multiple
- -0.12×
- Total profit
- $-131,112
- Equity at exit
- $62,263
- IRR
- -32.7%
- Equity multiple
- -0.55×
- Total profit
- $-181,149
- Equity at exit
- $36,105
Cash invested: $116,924 (down + closing). Projections, not guarantees.
Landlord ↔ Tenant lean methodology
- Overall (STATE)
- 87 Strongly Landlord-Friendly
- State Arizona
- 87 Strongly Landlord-Friendly · R+3
- County
- — inherits STATE
- City
- — inherits STATE
ZIP-level market 85641
- Home prices YoY
- -22.1%
- Rents YoY
- 5.0%
- Active inventory
- 655
- Price-to-rent
- 12.1×
Monthly cashflow live
- Estimated rent
- $2,347 high interval (Pro) →
- Mortgage (P&I)
- −$2,190
- Tax est. 1.5%
- −$522 /mo · $6,264/yr
- Insurance
- −$174
- HOA
- −$42
- Vacancy / Maint / Mgmt
- −$493
- Net cashflow
- $-1,074
Break-even live
UW: 25.0% down · 7.5% · 30yr · 1.5% tax · 5.0% vac · 8.0% maint · 8.0% mgmt
Financing live
Cash to close
- Down payment
- $104,396
- Closing costs
- $12,528
- Reserves months
- —
- Total cash needed
- —
Loan-product check · same deal, 3 products live
Conventional
25% down · 7.5% · 30yr
- Down + closing
- —
- Monthly P&I
- —
- Monthly cashflow
- —
- DSCR
- —
- Eligible?
- —
Personal DTI + credit; lowest rate.
DSCR
20% down · 8.5% · 30yr
- Down + closing
- —
- Monthly P&I
- —
- Monthly cashflow
- —
- DSCR
- —
- Eligible?
- —
No personal income docs; deal must DSCR.
Hard money
10% down · 12.0% · 12mo
- Down + closing
- —
- Monthly P&I
- —
- Monthly cashflow
- —
- DSCR
- —
- Eligible?
- —
Short-term bridge; refi at stabilization.
Rent comps 18 comps
| Address | Beds | Baths | Sqft | Rent | $/sqft | DOM | Units | Dist |
|---|---|---|---|---|---|---|---|---|
| 11977 E Chamrod Dr Vail, AZ | 3.0 | 2.5 | 1768 | $1,995 | $1.13 | 3d | 1 | 0.11mi |
| 11976 E Becker Dr Vail, AZ | 5.0 | 3.0 | 2567 | $2,590 | $1.01 | 3d | 1 | 0.36mi |
| 12103 E Becker Dr Vail, AZ | 5.0 | 3.0 | 2875 | $2,395 | $0.83 | 44d | 1 | 0.39mi |
| 12239 E Metz Dr Vail, AZ | 4.0 | 2.5 | 2330 | $2,136 | $0.92 | 3d | 1 | 0.48mi |
| 11935 E Ryscott Cir Vail, AZ | 4.0 | 3.0 | 2040 | $2,200 | $1.08 | 44d | 1 | 0.56mi |
| 10658 S Kush Canyon Ln Vail, AZ | 3.0 | 2.0 | 1966 | $2,000 | $1.02 | 44d | 1 | 0.76mi |
| 12534 E Red Canyon Pl Vail, AZ | 4.0 | 2.5 | 2023 | $2,075 | $1.03 | 3d | 1 | 0.78mi |
| 12528 E Caden Dr Vail, AZ | 3.0 | 2.0 | 1602 | $1,995 | $1.25 | 2d | 1 | 0.97mi |
| 12528 E Caden Dr Vail, AZ | 3.0 | 2.0 | 1602 | $1,995 | $1.25 | 3d | 1 | 0.97mi |
| 12631 E Remi Dr Vail, AZ | 4.0 | 2.5 | 2384 | $2,190 | $0.92 | 44d | 1 | 1.07mi |
| 11468 E Vail Crest Dr Tucson, AZ | 4.0 | 2.0 | 2373 | $2,239 | $0.94 | 23d | 1 | 1.14mi |
| 12717 E Giada Dr Vail, AZ | 4.0 | 2.0 | 1823 | $1,995 | $1.09 | 44d | 1 | 1.23mi |
| 12754 E Russo Dr Vail, AZ | 4.0 | 2.5 | 2418 | $2,500 | $1.03 | 3d | 1 | 1.31mi |
| 12815 E Russo Dr Vail, AZ | 4.0 | 2.0 | 1823 | $2,200 | $1.21 | 3d | 1 | 1.34mi |
| 11166 E Vail Vista Ct Tucson, AZ | 3.0 | 2.5 | 2211 | $2,400 | $1.09 | 44d | 1 | 1.37mi |
| 9535 S Crowley Brothers Dr Tucson, AZ | 4.0 | 3.0 | 2212 | $2,095 | $0.95 | 44d | 1 | 1.45mi |
| 11268 S Weismann Dr Vail, AZ | 3.0 | 2.0 | 1602 | $1,795 | $1.12 | 3d | 1 | 1.45mi |
| 11288 S Weismann Dr Vail, AZ | 4.0 | 2.5 | 2384 | $2,200 | $0.92 | 44d | 1 | 1.48mi |
HOA detail
- Monthly dues
- $42 · $504/yr
- Likely covers
- pool
Listing history 19 events
-
2026-04-04historical $2,350
-
2026-03-26$2,350
-
2025-12-30status Pending
-
2025-12-10status Pending
-
2025-11-21price $339,990
-
2025-10-22price $357,990
-
2025-10-01price $358,520
-
2025-09-10price $344,990
-
2025-08-29price $348,990
-
2025-08-13price $359,990
-
2025-07-31price $364,520
-
2025-07-29price $359,520
-
2025-05-31price $367,990
-
2025-05-14price $368,520
-
2025-04-29price $368,990
-
2025-04-22price $369,990
-
2025-04-18price $381,445
-
2025-02-24price $391,445
-
2025-02-19$406,445 Active
ⓘ Source: listings_history table (triggers on properties + properties_extension) + one-shot
backfill from property_details.listing_events for pre-trigger history.
Tax reassessment forecast AZ · Resets to sale price
- Current annual tax
- $750 · $63/mo
- Projected year-2 tax
- $2,244 · $187/mo
- Expected delta
- +$1,494/yr (+$124/mo · 199.2%)
ⓘ Screening estimate from a state-policy table — verify with the county assessor before closing.
Climate risk First Street
- Flood 1/10 Low FEMA zone X (unshaded) · 0% chance over 30 yrs
- Wildfire 7/10 Severe
- Heat 7/10 Severe 7 d/yr ≥102°F today · 18 d/yr by 30 yrs out
- Wind 1/10 Low
- Air quality 1/10 Low 0 unhealthy d/yr today · 0 by 30 yrs out
Nearby sold comps map
Loading sold comps map…
Walkable amenities ~0.75 mi
Loading nearby amenities…
Taxation est. · year 1
- Rental income
- $28,167
- − Mortgage interest
- −$23,391
- − Property taxes
- −$6,264
- − Insurance
- −$2,088
- − Repairs & maintenance
- −$2,253
- − Management
- −$2,253
- − HOA
- −$504
- − Depreciation
- −$12,148
- Taxable loss
- −$20,735
- Est. tax savings @ 24.0%
- +$4,976
- After-tax cash flow
- $-7,906/yr
For passive investors: Depreciation is non-cash, so a rental often shows a tax loss while cash-flowing — sheltering income. Rental losses are passive: they offset passive income freely, and up to $25,000/yr can offset ordinary (W-2) income if you actively participate and your MAGI is under $100k (phasing out to $0 by $150k); unused losses carry forward. On sale, claimed depreciation is recaptured at up to 25%, and gains may owe capital-gains tax (a 1031 exchange can defer both). Figures are a year-1 estimate at your 24.0% rate — not tax advice; consult a CPA.
Schools (NCES district)
- District
- Vail Unified District (4413)
- NCES district ID
- 0408850
- Math proficiency
- 52% ▼ -19.00%
- Reading proficiency
- 57% ▼ -11.00%
- Median HH income
- $77,126
- Composite
- 49.1/100
- National rank
- #2051
- State rank
- #26 of 249 in AZ
Livability — Tucson
- Score
- 74/100
- State rank
- #17
- US rank
- #4502
Category grades
Schools grade is shown separately in the Schools card above.
Census & demographics
- County
- Pima County · 1,012,107 people
- City population
- 839,336
- Metro
- Tucson, AZ
- Population (ZIP)
- 34,752
- Household income
- $131,164
- Rent vs Own
- Severe rent burden
- 42.0
Population outlook (Pima County) Hauer SSP2
- Today (2025)
- 1,066,056 people
- By 2030
- 1,086,684 · +1.9%
- By 2040
- 1,117,160 · +4.8%
- By 2050
- 1,149,778 · +7.9%
- By 2075
- 1,271,480 · +19.3%
- By 2100
- 1,321,160 · +23.9%
Race, ethnicity, and origin ACS 2023
- Neighborhood character
- Predominantly White (67%)
- Race & ethnicity
- White 67% Hispanic / Latino 19% Two or more races 15% Black 4% Asian 3%
- Hispanic origin (detail)
- Mexican 15%
- Common ancestry
- Slovak 2% Romanian 2% Lithuanian 2%
- Foreign-born
- 6% · Canada, China
- Languages at home
- 90% English-only · Spanish 7% Chinese 1%
Political lean MEDSL · Pima
- 2024 margin
- D (+15.2) · D 57.0% · R 41.8% · Other 1.2%
- 2008→2024 swing
- +9.1pp toward D · 2008: 6.1pp · 2024: 15.2pp
- All cycles
- 2024: D+15.2 2020: D+18.7 2016: D+13.5 2012: D+5.8 2008: D+6.1
Not yet ingested
- Civics
- —
Market trends
- HPI YoY
- ▼ -70.78%
- Current HPI
- 250.1814
- Rent YoY
- ▲ 5.02%
- Metro
- Tucson, AZ
- State GDP YoY
- ▲ 4.54%
- F500 in state
- 20
Industry mix (Fortune 500 HQ in AZ)
| Industry | F500 HQs | Revenue |
|---|---|---|
| Technology | 2 | $13B |
|
||
| Mining / Metals | 1 | $23B |
|
||
| Environmental Services | 1 | $16B |
|
||
| Metals / Steel | 1 | $14B |
|
||
| Technology Distribution | 1 | $9B |
|
||
| Homebuilding | 1 | $8B |
|
||
Price history
-99.4% since first listed19 events — show timeline
- 2026-04-04 Rental Removed $2,350 APPFOLIO
- 2026-03-26 Listed for Rent $2,350 APPFOLIO
- 2025-12-30 Pending — MLSSAZ
- 2025-12-10 Pending — MLSSAZ
- 2025-11-21 Price Changed $339,990 MLSSAZ
- 2025-10-22 Price Changed $357,990 MLSSAZ
- 2025-10-01 Price Changed $358,520 MLSSAZ
- 2025-09-10 Price Changed $344,990 MLSSAZ
- 2025-08-29 Price Changed $348,990 MLSSAZ
- 2025-08-13 Price Changed $359,990 MLSSAZ
- 2025-07-31 Price Changed $364,520 MLSSAZ
- 2025-07-29 Price Changed $359,520 MLSSAZ
- 2025-05-31 Price Changed $367,990 MLSSAZ
- 2025-05-14 Price Changed $368,520 MLSSAZ
- 2025-04-29 Price Changed $368,990 MLSSAZ
- 2025-04-22 Price Changed $369,990 MLSSAZ
- 2025-04-18 Price Changed $381,445 MLSSAZ
- 2025-02-24 Price Changed $391,445 MLSSAZ
- 2025-02-19 Listed $406,445 MLSSAZ
Property tax history
+43.7%/yrLatest (2025): $750 · +43.7% YoY. Source: county tax records.
Cash-flow waterfall
monthlySold comps — $/sqft
last 12 mo · ≤1 miLoading sold comps…