400 E Garfield Ave · Ava, MO
Flood risk 1/10 · Minimal
- FEMA flood zone
- X
- Chance of flooding over 30 yrs
- 0.0%
- Est. flood insurance / yr
- $507 – $1,088
Fire risk 4/10 · Minor
- Est. fire insurance / yr
- $1,054 – $1,958
Heat risk 5/10 · Moderate
- Hot days now (above 106°F)
- 7 days/yr
- Hot days in 30 yrs
- 19 days/yr
Wind risk 2/10 · Minimal
- Chance of severe wind over 30 yrs
- 0.0%
Air-quality risk 2/10 · Minimal
- Unhealthy air days now
- 1 days/yr
- Unhealthy air days in 30 yrs
- 1 days/yr
Risk factors via First Street. Map © Google.
Why this score? — see what drove the B+ grade
The composite is a weighted blend of 9 inputs, each scored 0–100. Each bar is that input's sub-score; the figure is the points it added to the 100-point composite (weight × sub-score).
- Cash flow +30.0/30.0
- 1% rule +10.0/10.0
- DSCR +10.0/10.0
- Appreciation +9.5/10.0
- ARV discount +7.5/15.0
- Livability +4.1/5.0
- Schools +3.2/10.0
- Rent growth +2.5/5.0
- Condition / age +2.5/5.0
$39,000
🖨 Deal sheet 📄 Offer letter ✓ Due diligence
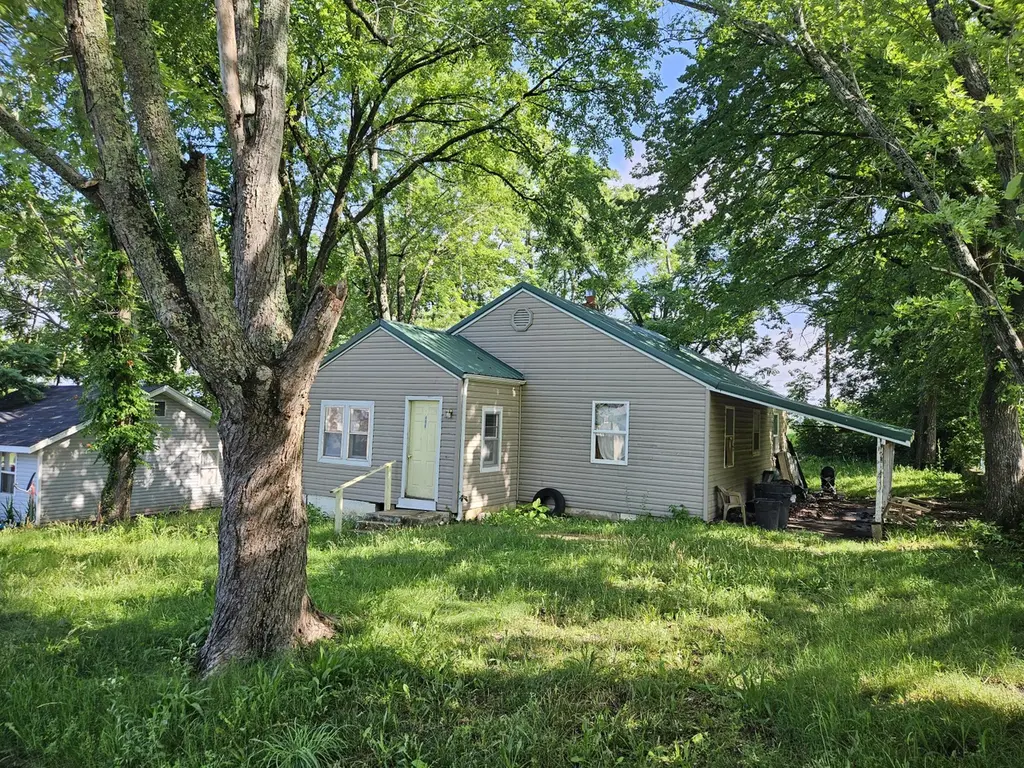
Listing remarks
This is a great project home close to the Ava square. This 2 bedroom 1 bath 840 square foot home still has most of the original hard wood flooring. The home has a metal roof and is priced right to allow for the updates and repairs needed to make this a home.
Key facts
- Metal roof
- Updates and repairs
- 6,970 sq ft lot
Tags
Property features AI
Exterior
- Parking: Covered driveway; One-car garage
- Utilities: Public water; Public sewer
- Home design: Single-family residence; One level
- Construction: Vinyl siding; Metal roof; Permanent foundation; Built with residential construction methods
- Exterior features: Enclosed patio/porch and front porch; Partial fencing; Asphalt and gravel drive/road access; Publicly maintained city street frontage; Lot approximately 68 x 100 (0.16 acres)
Interior
- Flooring: Wood flooring; Linoleum flooring
- Bathrooms: One full bathroom
- Heating & cooling: Propane heating; No central cooling
- Interior features: Wood and linoleum flooring
- Laundry & utility: Laundry on the main level
Neighborhood map
What this means for you Summary
Snapshot
- This is a 2-bed/1.0-bath other listed at $39k.
Deal economics
- At list price, monthly cash flow is $594 ($7k/yr) — positive.
- The deal already cash-flows at list — no discount required.
- Meets the 1% rule at list price ($1k rent vs $39k).
- Cap rate 24.6% vs local median 3.6% in Ava — top-decile yield for the area; either an underpriced asset or a hidden risk that comps aren't pricing in. Stress-test before assuming the spread holds.
Location & tenants
- Location reads 82/100 on livability (#12 in MO, #1,299 nationally) — a professional / high-income tenant draw. Strengths: crime A+, cost of living A+, housing A+; Watch: commute F, employment F.
- Ava R-I (town): math 36% / reading 43% proficiency, ranked #177 of 324 in MO (top 55%) — families likely to look elsewhere, expect single-tenant / working-renter base with shorter leases.
- Zoned schools: Ava Elem. (math 42% / reading 47%, grade F, #413 of 1,115 statewide, top 42%, 544 students, 64% FRL); Ava Middle (math 36% / reading 38%, grade F, #220 of 391 statewide, top 59%, 390 students, 62% FRL); Ava High (math 32% / reading 57%, grade F, #179 of 521 statewide, top 39%, 451 students, 51% FRL) — zoned schools at 59% FRL track the district average.
- Market conditions: 139 active listings in the ZIP; 2 comparable units currently listed for rent nearby; 21 units permitted in Douglas County in 2024 (10 in 5+ unit buildings).
Forward outlook
- In year one you build about $4k of equity ($270 loan paydown + $4k appreciation (9.1% local appreciation)).
- Douglas County population projected at -29% by 2050 — secular population decline; favor cash flow + early exit over multi-decade hold.
- At projected returns (9.1% appreciation + 3.0% rent growth), your $11k cash investment doubles in ~1 year — after that, you're playing with house money.
- By year 8, paydown + projected appreciation supports a ~$32k cash-out refi (75% LTV) — recoverable capital for the next deal without selling this one.
Negotiation context
- Only 1 days on market — expect competitive offers; lowballing is unlikely to land.
Risks & watch-outs
- Watch-outs: built in 1930 — expect roof / HVAC / electrical / plumbing capex.
- Climate carrying-cost: extreme-heat days projected 7→19/yr by 2055 (HVAC capex compounding) — expect insurance premiums to compound above CPI over the hold.
Questions for the listing agent
- Built in 1930 — when were the roof, HVAC, electrical panel, plumbing, and water heater last replaced?
- Is there a deadline driving the sale (1031 exchange, divorce, estate, relocation)? That informs how much negotiation room exists.
- What's the average days-on-market for RENTAL listings here right now (not sales)? A rising rental-DOM trend means longer vacancies and softer asking-rent achievability than the comps imply.
- What's the recent tenant-quality profile in this submarket — average credit score on applications, eviction rate, late-payment / NSF rate, and stable-employment percentage? A property-management company in the area should have these aggregated.
- How much new for-sale + rental construction is in the pipeline within 1–3 miles? Heavy new supply typically softens prices + rents 12–24 months out; constrained supply supports both.
Investment metrics
- 1% rule
- 2.70% ✓
- Cap rate
- 24.58%
- Cash-on-cash
- 65.30%
- DSCR
- 3.91
- GRM
- 3.1
CMA / ARV
No comps found within radius.
Projected returns pro-forma
9.05% appreciation · 3.0% rent growth · sell at horizon
- IRR
- 75.9%
- Equity multiple
- 6.18×
- Total profit
- $56,573
- Equity at exit
- $32,465
- IRR
- 70.6%
- Equity multiple
- 13.48×
- Total profit
- $136,310
- Equity at exit
- $67,352
Cash invested: $10,920 (down + closing). Projections, not guarantees.
Landlord ↔ Tenant lean methodology
- Overall (STATE)
- 81 Strongly Landlord-Friendly
- State Missouri
- 81 Strongly Landlord-Friendly · R+10
- County
- — inherits STATE
- City
- — inherits STATE
ZIP-level market 65608
- Home prices YoY
- 3.8%
- Active inventory
- 139
- Price-to-rent
- 3.1×
Monthly cashflow live
- Estimated rent
- $1,054 medium interval (Pro) →
- Mortgage (P&I)
- −$205
- Tax from tax record
- −$18 /mo · $215/yr
- Insurance
- −$16
- HOA
- −$0
- Vacancy / Maint / Mgmt
- −$221
- Net cashflow
- $594
Break-even live
UW: 25.0% down · 7.5% · 30yr · 1.5% tax · 5.0% vac · 8.0% maint · 8.0% mgmt
Financing live
Cash to close
- Down payment
- $9,750
- Closing costs
- $1,170
- Reserves months
- —
- Total cash needed
- —
Loan-product check · same deal, 3 products live
Conventional
25% down · 7.5% · 30yr
- Down + closing
- —
- Monthly P&I
- —
- Monthly cashflow
- —
- DSCR
- —
- Eligible?
- —
Personal DTI + credit; lowest rate.
DSCR
20% down · 8.5% · 30yr
- Down + closing
- —
- Monthly P&I
- —
- Monthly cashflow
- —
- DSCR
- —
- Eligible?
- —
No personal income docs; deal must DSCR.
Hard money
10% down · 12.0% · 12mo
- Down + closing
- —
- Monthly P&I
- —
- Monthly cashflow
- —
- DSCR
- —
- Eligible?
- —
Short-term bridge; refi at stabilization.
Rent comps 2 comps
| Address | Beds | Baths | Sqft | Rent | $/sqft | DOM | Units | Dist |
|---|---|---|---|---|---|---|---|---|
| 205D Knaack CT Unit 1 Ava, MO | 2.0 | 2.0 | 900 | $1,000 | $1.11 | 43d | 1 | 0.39mi |
| 1322 Springfield Rd Unit 7 Ava, MO | 2.0 | 2.0 | 1125 | $1,250 | $1.11 | 43d | 1 | 1.13mi |
Listing history 3 events
-
2026-06-12status $39,000 Pending 1 DOM
-
2026-06-09remarks 258-char remark
-
2026-06-09$39,000 Active 1 DOM
ⓘ Source: listings_history table (triggers on properties + properties_extension) + one-shot
backfill from property_details.listing_events for pre-trigger history.
Tax reassessment forecast MO · Resets to sale price
- Current annual tax
- $215 · $18/mo
- Projected year-2 tax
- $378 · $32/mo
- Expected delta
- +$163/yr (+$14/mo · 76.0%)
ⓘ Screening estimate from a state-policy table — verify with the county assessor before closing.
Climate risk First Street
- Flood 1/10 Low FEMA zone X · 0% chance over 30 yrs
- Wildfire 4/10 Moderate
- Heat 5/10 Major 7 d/yr ≥106°F today · 19 d/yr by 30 yrs out
- Wind 2/10 Low 0% chance of damaging wind over 30 yrs
- Air quality 2/10 Low 1 unhealthy d/yr today · 1 by 30 yrs out
Nearby sold comps map
Loading sold comps map…
Walkable amenities ~0.75 mi
Loading nearby amenities…
Taxation est. · year 1
- Rental income
- $12,651
- − Mortgage interest
- −$2,185
- − Property taxes
- −$215
- − Insurance
- −$195
- − Repairs & maintenance
- −$1,012
- − Management
- −$1,012
- − Depreciation
- −$1,135
- Taxable income
- $6,898
- Est. tax owed @ 24.0%
- −$1,656
- After-tax cash flow
- $5,475/yr
For passive investors: Depreciation is non-cash, so a rental often shows a tax loss while cash-flowing — sheltering income. Rental losses are passive: they offset passive income freely, and up to $25,000/yr can offset ordinary (W-2) income if you actively participate and your MAGI is under $100k (phasing out to $0 by $150k); unused losses carry forward. On sale, claimed depreciation is recaptured at up to 25%, and gains may owe capital-gains tax (a 1031 exchange can defer both). Figures are a year-1 estimate at your 24.0% rate — not tax advice; consult a CPA.
Schools (NCES district)
- District
- Ava R-I
- NCES district ID
- 2904050
- Math proficiency
- 36% ▼ -1.00%
- Reading proficiency
- 43% ▼ -2.00%
- Median HH income
- $31,148
- Composite
- 32.25/100
- National rank
- #5766
- State rank
- #177 of 324 in MO
Livability — Ava
- Score
- 82/100
- State rank
- #12
- US rank
- #1299
Category grades
Schools grade is shown separately in the Schools card above.
Census & demographics
- Census place
- Ava, MO
- Population (ZIP)
- 8,478
Population outlook (Douglas County) Hauer SSP2
- Today (2025)
- 12,395 people
- By 2030
- 11,690 · -5.7%
- By 2040
- 10,185 · -17.8%
- By 2050
- 8,805 · -29.0%
- By 2075
- 6,716 · -45.8%
- By 2100
- 5,493 · -55.7%
Race, ethnicity, and origin ACS 2023
- Neighborhood character
- Predominantly White (93%)
- Race & ethnicity
- White 93% Two or more races 4% Native American 1% Hispanic / Latino 1% Black 1%
- Common ancestry
- Lithuanian 4% Slovak 2% Iranian 2%
- Foreign-born
- 1% · Canada
Political lean MEDSL · Douglas
- 2024 margin
- Solid R (+72.0) · D 13.7% · R 85.6%
- 2008→2024 swing
- -38.2pp toward R · 2008: -33.8pp · 2024: -72.0pp
- All cycles
- 2024: R+72.0 2020: R+69.8 2016: R+67.5 2012: R+44.8 2008: R+33.8
Not yet ingested
- Civics
- —
Market trends
- HPI YoY
- ▲ 9.05%
- Current HPI
- 249.1557
- Rent YoY
- —
- Metro
- —
- State GDP YoY
- ▲ 1.84%
- F500 in state
- 20
Industry mix (Fortune 500 HQ in MO)
| Industry | F500 HQs | Revenue |
|---|---|---|
| Healthcare | 1 | $163B |
|
||
| Insurance | 1 | $21B |
|
||
| Industrial Technology | 1 | $17B |
|
||
| Retail | 1 | $16B |
|
||
| Industrial Distribution | 1 | $10B |
|
||
| Utilities | 1 | $9B |
|
||
Price history
2 events — show timeline
- 2026-06-09 Listed $39,000 SOMO
- 2016-01-26 Sold (Public Records) — Public Records
Property tax history
+2.7%/yrLatest (2025): $215 · +9.0% YoY. Source: county tax records.
Cash-flow waterfall
monthlySold comps — $/sqft
last 12 mo · ≤1 miLoading sold comps…