4769 Pine Ln · Pace, FL
Flood risk 1/10 · Minimal
- FEMA flood zone
- X (unshaded)
- Chance of flooding over 30 yrs
- 0.0%
- Est. flood insurance / yr
- $507 – $1,088
Fire risk 3/10 · Minor
- Est. fire insurance / yr
- $947 – $1,759
Heat risk 9/10 · Severe
- Hot days now (above 105°F)
- 7 days/yr
- Hot days in 30 yrs
- 21 days/yr
Wind risk 9/10 · Severe
- Chance of severe wind over 30 yrs
- 99.0%
Air-quality risk 1/10 · Minimal
- Unhealthy air days now
- 0 days/yr
- Unhealthy air days in 30 yrs
- 0 days/yr
Risk factors via First Street. Map © Google.
Why this score? — see what drove the B- grade
The composite is a weighted blend of 9 inputs, each scored 0–100. Each bar is that input's sub-score; the figure is the points it added to the 100-point composite (weight × sub-score).
- Cash flow +24.9/30.0
- ARV discount +15.0/15.0
- DSCR +8.1/10.0
- Schools +5.3/10.0
- 1% rule +5.2/10.0
- Livability +3.5/5.0
- Rent growth +3.2/5.0
- Condition / age +2.5/5.0
- Appreciation +0.0/10.0
$168,000
🖨 Deal sheet 📄 Offer letter ✓ Due diligence
Listing remarks
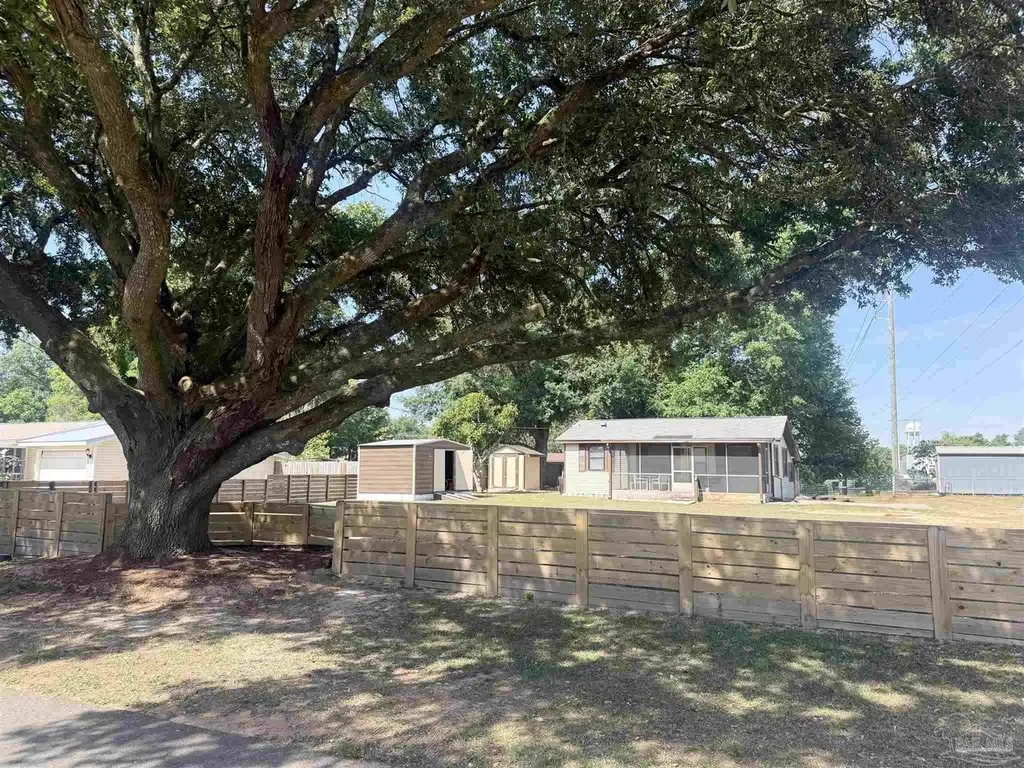
Almost 1 acre in Pace! Immaculately kept 2-bedroom, 1.5-bath home with the potential to easily convert into a 3-bedroom, 2-bath. This 1,666 sq ft home offers incredible flexibility—whether you’re searching for a primary residence or looking to live in the home while building on the property. Step inside to a cozy, functional layout featuring a screened porch that opens into the living room, creating a welcoming space to relax or entertain. Just off the living area, you’ll find the kitchen and dining space, ideal for everyday living. Down the hall, you’ll find a full bathroom, the primary bedroom, and a versatile storage room that could be used as a third bedroom or o
Key facts
- Storage shed
- Screened porch
- Generous lot size
Tags
Property features AI
Finance
- Other: Homestead eligible; County maintained road
- HOA & community: No association
Exterior
- Parking: Driveway parking; Guest parking; Open parking available
- Utilities: Public water; Circuit breaker electric
- Home design: Single-story (one level); Resale property; Not attached to other properties
- Construction: Frame construction; Composition roof; Off-grade foundation; Built on one level
- Exterior features: Back yard with full chain link fencing; Yard building (other structure); Paved road access; Central access lot feature
Interior
- Kitchen: Pantry; Electric water heater
- Bedrooms: Three bedrooms, all on the first floor (approx. 12x18, 10x18, 10x11)
- Flooring: Vinyl; Laminate
- Bathrooms: One full bathroom and one half bathroom
- Heating & cooling: Central heating; Central air; Ceiling fan(s)
- Interior features: Vinyl and laminate flooring; Pantry; Interior handicap provisions; Insulation and insulated floors
- Laundry & utility: Inside laundry
Neighborhood map
What this means for you Summary
Snapshot
- This is a 2-bed/1.0-bath single-family listed at $168k.
Deal economics
- At list price, monthly cash flow is $361 ($4k/yr) — positive.
- The deal already cash-flows at list — no discount required.
- Meets the 1% rule at list price ($2k rent vs $168k).
- Recommended offer: $163k (3.0% below list) — sets the bar for market timing.
- Cap rate 8.9% vs local median 4.5% in Pace — top-decile yield for the area; either an underpriced asset or a hidden risk that comps aren't pricing in. Stress-test before assuming the spread holds.
Location & tenants
- Location reads 69/100 on livability (#475 in FL) — a middle-class / working-renter tenant base. Strengths: cost of living A+, housing A+, schools B+; Watch: amenities F, commute F, health & safety F.
- Santa Rosa (suburban): math 63% / reading 60% proficiency, ranked #8 of 73 in FL (top 11%) — acceptable for families but not a draw, mixed tenant base, ~2y average lease.
- Market conditions: Rents rising (+2.7%/yr); 665 active listings in the ZIP; 1 comparable units currently listed for rent nearby; solid renter incomes; 1,983 units permitted in Santa Rosa County in 2024 (128 in 5+ unit buildings).
Forward outlook
- Local home prices are declining (-3.0%/yr); year-one equity from $1k of loan paydown is wiped out by about $5k of value loss. Plan a longer hold.
- Santa Rosa County population projected at +31% by 2050 — long-run rental-demand tailwind backs the buy-and-hold thesis.
Negotiation context
- It's been on market 51 days — a 3% lower offer ($163k) is reasonable based on typical stale-listing flexibility.
- 2 sale attempts with the ask held roughly flat each time — persistent listings suggest the price (not the market) is what's stuck; bring a comps-based counter.
- Current owner paid $30k; list at $168k implies a 460% gain — meaningful room to come down on a strong offer.
Risks & watch-outs
- Watch-outs: built in 1955 — expect roof / HVAC / electrical / plumbing capex.
- Climate carrying-cost: severe wind risk, 99% chance of damaging wind over 30y; extreme-heat days projected 7→21/yr by 2055 (HVAC capex compounding) — expect insurance premiums to compound above CPI over the hold.
Questions for the listing agent
- It's been on market 51 days. Have you received any prior offers? Is the seller open to a 3% concession, seller financing, or rate buy-down credit?
- Built in 1955 — when were the roof, HVAC, electrical panel, plumbing, and water heater last replaced?
- Is there a deadline driving the sale (1031 exchange, divorce, estate, relocation)? That informs how much negotiation room exists.
- Schools are B-rated — typically a magnet for longer-tenancy family renters. What's the average tenant stay here, and is there a school-zone premium baked into asking?
- What's the average days-on-market for RENTAL listings here right now (not sales)? A rising rental-DOM trend means longer vacancies and softer asking-rent achievability than the comps imply.
- What's the recent tenant-quality profile in this submarket — average credit score on applications, eviction rate, late-payment / NSF rate, and stable-employment percentage? A property-management company in the area should have these aggregated.
- How much new for-sale + rental construction is in the pipeline within 1–3 miles? Heavy new supply typically softens prices + rents 12–24 months out; constrained supply supports both.
Investment metrics
- 1% rule
- 1.02% ✓
- Cap rate
- 8.87%
- Cash-on-cash
- 9.21%
- DSCR
- 1.41
- GRM
- 8.1
CMA / ARV
- ARV (on-the-fly)
- $318,206
- Comps found
- 12
Show comp detail 12 sales within ~0.75 mi
| Address | Dist | Beds/Ba | Sqft | Sold | Price | $/sf | Match |
|---|---|---|---|---|---|---|---|
| 4769 Pine Ln | 0.00mi | 2/1.5 | 1,666 (0%) | 0mo | $168,000 | $101 | 98 |
| 4745 Sago Palm Cir | 0.38mi | 3/2.0 (+1) | 1,660 (-0%) | 0mo | $319,000 | $192 | 72 |
| 4722 Majestic Palm St | 0.41mi | 3/2.0 (+1) | 1,685 (+1%) | 2mo | $339,990 | $202 | 68 |
| 4703 Santa Rosa Dr | 0.30mi | 3/2.0 (+1) | 1,583 (-5%) | 2mo | $285,000 | $180 | 67 |
| 4741 Sago Palm Cir | 0.37mi | 3/2.0 (+1) | 1,569 (-6%) | 3mo | $320,000 | $204 | 62 |
| 4344 Forte St | 0.57mi | 3/2.0 (+1) | 1,566 (-6%) | 2mo | $195,000 | $125 | 52 |
| 4597 Sago Palm Cir | 0.49mi | 3/2.0 (+1) | 1,848 (+11%) | 1mo | $354,000 | $192 | 49 |
| 4245 Lady Palm Ct | 0.49mi | 3/2.0 (+1) | 1,857 (+12%) | 0mo | $345,000 | $186 | 49 |
| 4930 E Spencer Field Rd | 0.58mi | 3/2.0 (+1) | 1,475 (-12%) | 2mo | $320,000 | $217 | 43 |
| 4320 Grant St | 0.63mi | 3/2.0 (+1) | 1,459 (-12%) | 1mo | $265,000 | $182 | 40 |
| 4805 Air Field Dr Lot 27D | 0.70mi | 3/2.0 (+1) | 1,474 (-12%) | 1mo | $281,990 | $191 | 39 |
| 4781 Air Field Dr Lot 23D | 0.70mi | 3/2.0 (+1) | 1,474 (-12%) | 2mo | $281,990 | $191 | 38 |
Match score weights: distance 35% · size 25% · config 20% · recency 20%. Top-matched comps best support the ARV.
Projected returns pro-forma
-3.0% appreciation · 2.72% rent growth · sell at horizon
- IRR
- -2.7%
- Equity multiple
- 0.90×
- Total profit
- $-4,781
- Equity at exit
- $25,049
- IRR
- 6.7%
- Equity multiple
- 1.49×
- Total profit
- $23,180
- Equity at exit
- $14,526
Cash invested: $47,040 (down + closing). Projections, not guarantees.
Landlord ↔ Tenant lean methodology
- Overall (STATE)
- 87 Strongly Landlord-Friendly
- State Florida
- 87 Strongly Landlord-Friendly · R+3
- County
- — inherits STATE
- City
- — inherits STATE
ZIP-level market 32571
- Home prices YoY
- -17.7%
- Rents YoY
- 2.7%
- Active inventory
- 665
- Price-to-rent
- 8.1×
Monthly cashflow live
- Estimated rent
- $1,721 medium interval (Pro) →
- Mortgage (P&I)
- −$881
- Tax from tax record
- −$47 /mo · $569/yr
- Insurance
- −$70
- HOA
- −$0
- Vacancy / Maint / Mgmt
- −$361
- Net cashflow
- $361
Break-even live
UW: 25.0% down · 7.5% · 30yr · 1.5% tax · 5.0% vac · 8.0% maint · 8.0% mgmt
Financing live
Cash to close
- Down payment
- $42,000
- Closing costs
- $5,040
- Reserves months
- —
- Total cash needed
- —
Loan-product check · same deal, 3 products live
Conventional
25% down · 7.5% · 30yr
- Down + closing
- —
- Monthly P&I
- —
- Monthly cashflow
- —
- DSCR
- —
- Eligible?
- —
Personal DTI + credit; lowest rate.
DSCR
20% down · 8.5% · 30yr
- Down + closing
- —
- Monthly P&I
- —
- Monthly cashflow
- —
- DSCR
- —
- Eligible?
- —
No personal income docs; deal must DSCR.
Hard money
10% down · 12.0% · 12mo
- Down + closing
- —
- Monthly P&I
- —
- Monthly cashflow
- —
- DSCR
- —
- Eligible?
- —
Short-term bridge; refi at stabilization.
Rent comps 1 comps
| Address | Beds | Baths | Sqft | Rent | $/sqft | DOM | Units | Dist |
|---|---|---|---|---|---|---|---|---|
| 4496 Fiske St Milton, FL | 3.0 | 2.0 | 1418 | $1,850 | $1.30 | 13d | 1 | 1.13mi |
Listing history 19 events
-
2026-06-14statusdays on market $168,000 Pending 51 DOM
-
2026-06-10days on market $168,000 Contingent 49 DOM
-
2026-06-09days on market $168,000 Contingent 48 DOM
-
2026-06-08days on market $168,000 Contingent 47 DOM
-
2026-06-07days on market $168,000 Contingent 46 DOM
-
2026-06-05days on market $168,000 Contingent 43 DOM
-
2026-06-03days on market $168,000 Contingent 42 DOM
-
2026-06-02days on market $168,000 Contingent 41 DOM
-
2026-06-01days on market $168,000 Contingent 40 DOM
-
2026-05-31days on market $168,000 Contingent 39 DOM
-
2026-05-31days on market $168,000 Contingent 38 DOM
-
2026-05-11historical Contingent
-
2026-04-22$168,000 Active
-
2025-05-27historical
-
2025-05-21historical Contingent
-
2025-04-08price $168,000
-
2025-03-24$185,000 Active
-
1984-08-01soldstatus $30,000
-
1982-09-01soldstatus $30,000
ⓘ Source: listings_history table (triggers on properties + properties_extension) + one-shot
backfill from property_details.listing_events for pre-trigger history.
Tax reassessment forecast FL · Resets to sale price
- Current annual tax
- $569 · $47/mo
- Projected year-2 tax
- $1,394 · $116/mo
- Expected delta
- +$825/yr (+$69/mo · 145.1%)
ⓘ Screening estimate from a state-policy table — verify with the county assessor before closing.
Climate risk First Street
- Flood 1/10 Low FEMA zone X (unshaded) · 0% chance over 30 yrs
- Wildfire 3/10 Moderate
- Heat 9/10 Extreme 7 d/yr ≥105°F today · 21 d/yr by 30 yrs out
- Wind 9/10 Extreme 99% chance of damaging wind over 30 yrs
- Air quality 1/10 Low 0 unhealthy d/yr today · 0 by 30 yrs out
Nearby sold comps map
Loading sold comps map…
Walkable amenities ~0.75 mi
Loading nearby amenities…
Taxation est. · year 1
- Rental income
- $20,651
- − Mortgage interest
- −$9,411
- − Property taxes
- −$569
- − Insurance
- −$840
- − Repairs & maintenance
- −$1,652
- − Management
- −$1,652
- − Depreciation
- −$4,887
- Taxable income
- $1,640
- Est. tax owed @ 24.0%
- −$394
- After-tax cash flow
- $3,940/yr
For passive investors: Depreciation is non-cash, so a rental often shows a tax loss while cash-flowing — sheltering income. Rental losses are passive: they offset passive income freely, and up to $25,000/yr can offset ordinary (W-2) income if you actively participate and your MAGI is under $100k (phasing out to $0 by $150k); unused losses carry forward. On sale, claimed depreciation is recaptured at up to 25%, and gains may owe capital-gains tax (a 1031 exchange can defer both). Figures are a year-1 estimate at your 24.0% rate — not tax advice; consult a CPA.
Schools (NCES district)
- District
- Santa Rosa
- NCES district ID
- 1201650
- Math proficiency
- 63% ▼ -6.00%
- Reading proficiency
- 60% ▼ -5.00%
- Median HH income
- $58,161
- Composite
- 53.12/100
- National rank
- #1511
- State rank
- #8 of 73 in FL
Livability — Pace
- Score
- 69/100
- State rank
- #475
- US rank
- #8593
Category grades
Schools grade is shown separately in the Schools card above.
Census & demographics
- Census place
- Pace, FL
- County
- Santa Rosa County · 194,764 people
- City population
- 42,171
- Metro
- Pensacola-Ferry Pass-Brent, FL
- Population (ZIP)
- 42,171
- Household income
- $87,617
- Rent vs Own
- Severe rent burden
- 301.0
Population outlook (Santa Rosa County) Hauer SSP2
- Today (2025)
- 195,978 people
- By 2030
- 209,782 · +7.0%
- By 2040
- 235,293 · +20.1%
- By 2050
- 256,408 · +30.8%
- By 2075
- 298,074 · +52.1%
- By 2100
- 303,216 · +54.7%
Race, ethnicity, and origin ACS 2023
- Neighborhood character
- Predominantly White (80%)
- Race & ethnicity
- White 80% Two or more races 9% Hispanic / Latino 6% Black 4% Asian 2%
- Hispanic origin (detail)
- Mexican 3%
- Common ancestry
- Lithuanian 4% Italian 3% Slovak 2%
- Foreign-born
- 6% · Canada, South Korea
- Languages at home
- 93% English-only · Spanish 2% Other Indo-European 1% Russian/Polish/Slavic 1%
Political lean MEDSL · Santa Rosa
- 2024 margin
- Solid R (+51.0) · D 24.1% · R 75.0%
- 2008→2024 swing
- -3.0pp toward R · 2008: -47.9pp · 2024: -51.0pp
- All cycles
- 2024: R+51.0 2020: R+46.5 2016: R+53.5 2012: R+52.6 2008: R+47.9
Not yet ingested
- Civics
- —
Market trends
- HPI YoY
- ▼ -62.39%
- Current HPI
- 290.2953
- Rent YoY
- ▲ 2.72%
- Metro
- Pensacola-Ferry Pass-Brent, FL
- State GDP YoY
- ▲ 3.28%
- F500 in state
- 36
Industry mix (Fortune 500 HQ in FL)
| Industry | F500 HQs | Revenue |
|---|---|---|
| Industrial Technology | 2 | $29B |
|
||
| Insurance | 2 | $17B |
|
||
| Retail | 1 | $60B |
|
||
| Technology Distribution | 1 | $58B |
|
||
| Homebuilding | 1 | $35B |
|
||
| Technology Manufacturing | 1 | $35B |
|
||
Price history
+460.0% since first listed8 events — show timeline
- 2026-05-11 Contingent — PARMLS
- 2026-04-22 Listed $168,000 PARMLS
- 2025-05-27 Listing Removed — PARMLS
- 2025-05-21 Contingent — PARMLS
- 2025-04-08 Price Changed $168,000 PARMLS
- 2025-03-24 Listed $185,000 PARMLS
- 1984-08-01 Sold (Public Records) $30,000 Public Records
- 1982-09-01 Sold (Public Records) $30,000 Public Records
Property tax history
+1.0%/yrLatest (2025): $569 · +3.0% YoY. Source: county tax records.
Cash-flow waterfall
monthlySold comps — $/sqft
last 12 mo · ≤1 miLoading sold comps…