446 Lead Mine Rd · Austinville, VA
Flood risk 1/10 · Minimal
- FEMA flood zone
- X (unshaded)
- Chance of flooding over 30 yrs
- 0.0%
- Est. flood insurance / yr
- $507 – $1,088
Fire risk 5/10 · Moderate
- Est. fire insurance / yr
- $666 – $1,236
Heat risk 3/10 · Minor
- Hot days now (above 93°F)
- 7 days/yr
- Hot days in 30 yrs
- 18 days/yr
Wind risk 2/10 · Minimal
- Chance of severe wind over 30 yrs
- 1.0%
Air-quality risk 1/10 · Minimal
- Unhealthy air days now
- 0 days/yr
- Unhealthy air days in 30 yrs
- 0 days/yr
Risk factors via First Street. Map © Google.
Why this score? — see what drove the D+ grade
The composite is a weighted blend of 9 inputs, each scored 0–100. Each bar is that input's sub-score; the figure is the points it added to the 100-point composite (weight × sub-score).
- Cash flow +12.9/30.0
- Appreciation +8.3/10.0
- ARV discount +7.5/15.0
- Schools +6.0/10.0
- DSCR +3.9/10.0
- 1% rule +2.5/10.0
- Rent growth +2.5/5.0
- Livability +2.5/5.0
- Condition / age +2.5/5.0
$165,000
🖨 Deal sheet 📄 Offer letter ✓ Due diligence
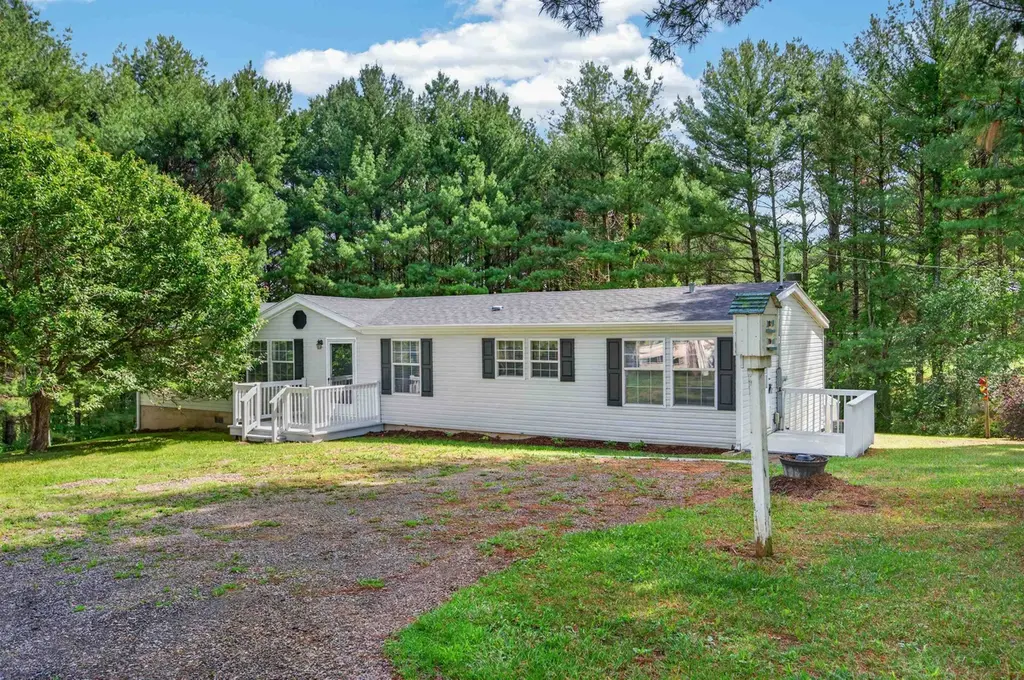
Listing remarks
Affordable and well-maintained, this spacious 3-bedroom, 2-bath home sits on 0.92 acres and offers plenty of room to spread out and enjoy. Designed for comfortable living and entertaining, the home features a living room, dining room, and an eat-in kitchen with a breakfast bar overlooking a sunken family room complete with a cozy fireplace. Sliding glass doors lead to a screened back porch, providing the perfect spot to relax and enjoy the outdoors. Set back from the road for added privacy while still offering easy access to major routes, this property is located just minutes from I-77, making shopping, dining, medical facilities, and everyday conveniences easily accessible. Outdoor enthusi
Key facts
- Screened back porch
- Trail system
- Sunken family room
Tags
Property features AI
Exterior
- Parking: Gravel parking
- Utilities: Private well water; Septic tank sewer
- Home design: Mobile home (detached); One level
- Construction: Block and vinyl siding construction
- Exterior features: Garden; Porch (screened); Storm door(s); Shed(s)
Interior
- Kitchen: Dishwasher; Microwave; Electric range; Refrigerator
- Bedrooms: Total rooms: 7
- Bathrooms: 2 full bathrooms
- Heating & cooling: Heat pump (heating)
- Interior features: Family room fireplace; Garden access or space
- Laundry & utility: Electric water heater
Neighborhood map
What this means for you Summary
Snapshot
- This is a 3-bed/2.0-bath single-family listed at $165k.
Deal economics
- At list price, monthly cash flow is $-13 ($-152/yr) — negative.
- To cash-flow at today's rent, offer at most $163k (1.4% below list).
- To meet the 1% rule (rent ≥ 1% of price), the offer needs to be $123k (25.2% below list).
- Recommended offer: $123k (25.2% below list) — sets the bar for 1% rule.
Location & tenants
- Location reads: area grade D — affects rentability + tenant quality, not the cash-flow math above.
- Wythe County Public School District (rural): math 67% / reading 77% proficiency, ranked #20 of 131 in VA (top 15%) — strong family-tenant draw, lease renewals of 3-5y typical.
- Zoned schools: Jackson Memorial Elementary (math 57% / reading 67%, grade B, #480 of 1,108 statewide, top 46%, 212 students, 74% FRL); Fort Chiswell Middle (math 70% / reading 83%, grade A, #40 of 342 statewide, top 12%, 316 students, 74% FRL); Fort Chiswell High (math 52% / reading 72%, grade B-, #231 of 319 statewide, top 75%, 435 students, 73% FRL) — zoned schools average 74% FRL vs 41% district-wide (33 pts higher); higher-poverty schools than district average — tighter screening recommended.
- Market conditions: 33 active listings in the ZIP; 63 units permitted in Wythe County in 2024 (12 in 5+ unit buildings).
Forward outlook
- In year one you build about $12k of equity ($1k loan paydown + $11k appreciation (6.7% local appreciation)).
- Wythe County population projected to shrink 7% by 2050 — rents likely to lag national; underwrite the cash flow, not the appreciation.
- At projected returns (6.7% appreciation + 3.0% rent growth), your $46k cash investment doubles in ~4 years — after that, you're playing with house money.
- By year 3, paydown + projected appreciation supports a ~$30k cash-out refi (75% LTV) — recoverable capital for the next deal without selling this one.
Negotiation context
- Only 4 days on market — expect competitive offers; lowballing is unlikely to land.
Risks & watch-outs
- Climate carrying-cost: moderate wildfire risk — expect insurance premiums to compound above CPI over the hold.
Questions for the listing agent
- What do current leases actually rent for vs. the listed asking? Can we see a recent rent roll and the last 12 months of T-12 income?
- Is there a deadline driving the sale (1031 exchange, divorce, estate, relocation)? That informs how much negotiation room exists.
- The area grade is low — what's the realistic commute time and amenity access for the typical tenant pool here? Any planned neighborhood developments (good or bad) we should know about?
- What's the average days-on-market for RENTAL listings here right now (not sales)? A rising rental-DOM trend means longer vacancies and softer asking-rent achievability than the comps imply.
- What's the recent tenant-quality profile in this submarket — average credit score on applications, eviction rate, late-payment / NSF rate, and stable-employment percentage? A property-management company in the area should have these aggregated.
- How much new for-sale + rental construction is in the pipeline within 1–3 miles? Heavy new supply typically softens prices + rents 12–24 months out; constrained supply supports both.
Investment metrics
- 1% rule
- 0.75% ✗
- Cap rate
- 6.20%
- Cash-on-cash
- -0.33%
- DSCR
- 0.99
- GRM
- 11.1
CMA / ARV
No comps found within radius.
Projected returns pro-forma
6.69% appreciation · 3.0% rent growth · sell at horizon
- IRR
- 16.7%
- Equity multiple
- 2.16×
- Total profit
- $53,616
- Equity at exit
- $111,020
- IRR
- 16.3%
- Equity multiple
- 4.39×
- Total profit
- $156,669
- Equity at exit
- $207,948
Cash invested: $46,200 (down + closing). Projections, not guarantees.
Landlord ↔ Tenant lean methodology
- Overall (STATE)
- 55 Moderately Landlord-Leaning
- State Virginia
- 55 Moderately Landlord-Leaning · D+2
- County
- — inherits STATE
- City
- — inherits STATE
ZIP-level market 24312
- Home prices YoY
- 4.4%
- Active inventory
- 33
- Price-to-rent
- 11.1×
Monthly cashflow live
- Estimated rent
- $1,233 medium interval (Pro) →
- Mortgage (P&I)
- −$865
- Tax from tax record
- −$53 /mo · $636/yr
- Insurance
- −$69
- HOA
- −$0
- Vacancy / Maint / Mgmt
- −$259
- Net cashflow
- $-13
Break-even live
UW: 25.0% down · 7.5% · 30yr · 1.5% tax · 5.0% vac · 8.0% maint · 8.0% mgmt
Financing live
Cash to close
- Down payment
- $41,250
- Closing costs
- $4,950
- Reserves months
- —
- Total cash needed
- —
Loan-product check · same deal, 3 products live
Conventional
25% down · 7.5% · 30yr
- Down + closing
- —
- Monthly P&I
- —
- Monthly cashflow
- —
- DSCR
- —
- Eligible?
- —
Personal DTI + credit; lowest rate.
DSCR
20% down · 8.5% · 30yr
- Down + closing
- —
- Monthly P&I
- —
- Monthly cashflow
- —
- DSCR
- —
- Eligible?
- —
No personal income docs; deal must DSCR.
Hard money
10% down · 12.0% · 12mo
- Down + closing
- —
- Monthly P&I
- —
- Monthly cashflow
- —
- DSCR
- —
- Eligible?
- —
Short-term bridge; refi at stabilization.
Listing history 4 events
-
2026-06-02statusdays on market $165,000 Pending 4 DOM
-
2026-06-01days on market $165,000 Active 3 DOM
-
2026-05-31days on market $165,000 Active 2 DOM
-
2026-05-30$165,000 Active
ⓘ Source: listings_history table (triggers on properties + properties_extension) + one-shot
backfill from property_details.listing_events for pre-trigger history.
Tax reassessment forecast VA · Resets to sale price
- Current annual tax
- $636 · $53/mo
- Projected year-2 tax
- $1,353 · $113/mo
- Expected delta
- +$717/yr (+$60/mo · 112.6%)
ⓘ Screening estimate from a state-policy table — verify with the county assessor before closing.
Climate risk First Street
- Flood 1/10 Low FEMA zone X (unshaded) · 0% chance over 30 yrs
- Wildfire 5/10 Major
- Heat 3/10 Moderate 7 d/yr ≥93°F today · 18 d/yr by 30 yrs out
- Wind 2/10 Low 100% chance of damaging wind over 30 yrs
- Air quality 1/10 Low 0 unhealthy d/yr today · 0 by 30 yrs out
Nearby sold comps map
Loading sold comps map…
Walkable amenities ~0.75 mi
Loading nearby amenities…
Taxation est. · year 1
- Rental income
- $14,802
- − Mortgage interest
- −$9,243
- − Property taxes
- −$636
- − Insurance
- −$825
- − Repairs & maintenance
- −$1,184
- − Management
- −$1,184
- − Depreciation
- −$4,800
- Taxable loss
- −$3,071
- Est. tax savings @ 24.0%
- +$737
- After-tax cash flow
- $585/yr
For passive investors: Depreciation is non-cash, so a rental often shows a tax loss while cash-flowing — sheltering income. Rental losses are passive: they offset passive income freely, and up to $25,000/yr can offset ordinary (W-2) income if you actively participate and your MAGI is under $100k (phasing out to $0 by $150k); unused losses carry forward. On sale, claimed depreciation is recaptured at up to 25%, and gains may owe capital-gains tax (a 1031 exchange can defer both). Figures are a year-1 estimate at your 24.0% rate — not tax advice; consult a CPA.
Schools (NCES district)
- District
- Wythe County Public School District
- NCES district ID
- 5104110
- Math proficiency
- 67% ▼ -23.00%
- Reading proficiency
- 77% ▼ -9.00%
- Median HH income
- $41,665
- Composite
- 60.19/100
- National rank
- #863
- State rank
- #20 of 131 in VA
Livability — Austinville
No livability data for this city. (Only ~50 U.S. cities are tracked.)
Census & demographics
- Population (ZIP)
- 1,586
Population outlook (Wythe County) Hauer SSP2
- Today (2025)
- 29,176 people
- By 2030
- 28,993 · -0.6%
- By 2040
- 28,273 · -3.1%
- By 2050
- 27,055 · -7.3%
- By 2075
- 23,668 · -18.9%
- By 2100
- 18,904 · -35.2%
Race, ethnicity, and origin ACS 2023
- Neighborhood character
- Predominantly White (100%)
- Race & ethnicity
- White 100%
- Common ancestry
- Iranian 3% Italian 2%
Political lean MEDSL · Wythe
- 2024 margin
- Solid R (+59.5) · D 19.9% · R 79.5%
- 2008→2024 swing
- -26.7pp toward R · 2008: -32.8pp · 2024: -59.5pp
- All cycles
- 2024: R+59.5 2020: R+57.0 2016: R+54.9 2012: R+36.8 2008: R+32.8
Not yet ingested
- Civics
- —
Market trends
- HPI YoY
- ▲ 6.69%
- Current HPI
- 158.1322
- Rent YoY
- —
- Metro
- —
- State GDP YoY
- ▲ 2.40%
- F500 in state
- 50
Industry mix (Fortune 500 HQ in VA)
| Industry | F500 HQs | Revenue |
|---|---|---|
| Aerospace / Defense | 4 | $236B |
|
||
| Technology / Defense | 3 | $32B |
|
||
| Financial Services | 2 | $176B |
|
||
| Utilities | 2 | $27B |
|
||
| Insurance | 2 | $25B |
|
||
| Technology | 2 | $15B |
|
||
Price history
1 event — show timeline
- 2026-05-30 Listed $165,000 NRVMLS
Property tax history
+4.3%/yrLatest (2025): $636 · +0.0% YoY. Source: county tax records.
Cash-flow waterfall
monthlySold comps — $/sqft
last 12 mo · ≤1 miLoading sold comps…