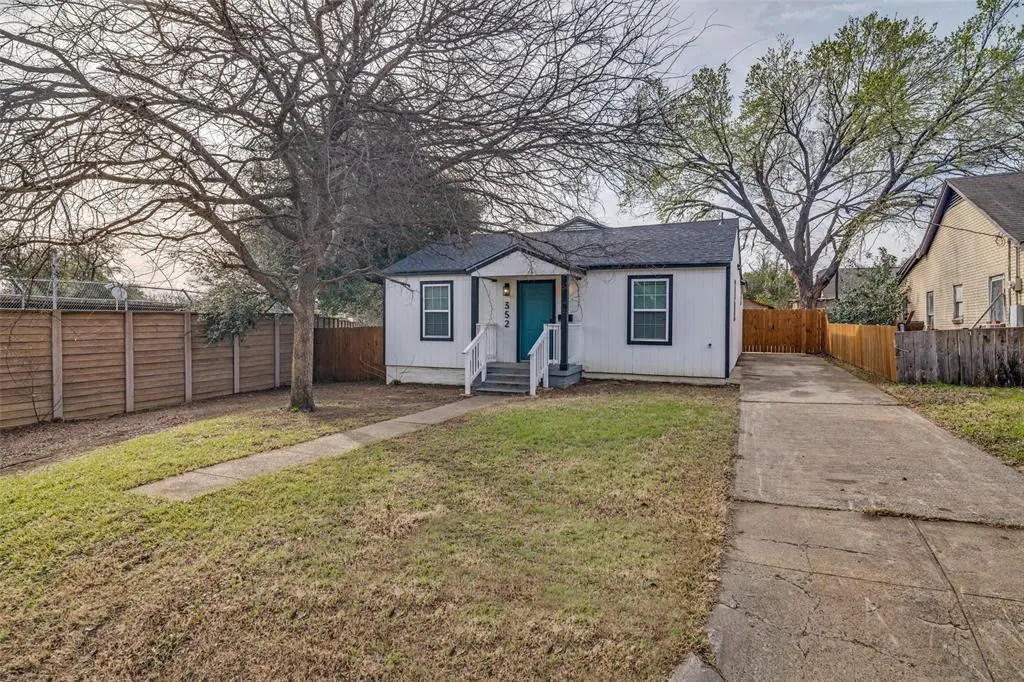
352 E Page Ave · Dallas, TX
Flood risk 1/10 · Minimal
- FEMA flood zone
- X (unshaded)
- Chance of flooding over 30 yrs
- 0.0%
- Est. flood insurance / yr
- $507 – $1,088
Fire risk 1/10 · Minimal
- Est. fire insurance / yr
- $1,222 – $2,270
Heat risk 7/10 · Major
- Hot days now (above 109°F)
- 7 days/yr
- Hot days in 30 yrs
- 23 days/yr
Wind risk 6/10 · Moderate
- Chance of severe wind over 30 yrs
- 27.0%
Air-quality risk 2/10 · Minimal
- Unhealthy air days now
- 1 days/yr
- Unhealthy air days in 30 yrs
- 2 days/yr
Risk factors via First Street. Map © Google.
Why this score? — see what drove the D grade
The composite is a weighted blend of 9 inputs, each scored 0–100. Each bar is that input's sub-score; the figure is the points it added to the 100-point composite (weight × sub-score).
- Appreciation +10.0/10.0
- Cash flow +8.1/30.0
- ARV discount +7.0/15.0
- Livability +4.0/5.0
- 1% rule +2.8/10.0
- Schools +2.8/10.0
- Condition / age +2.5/5.0
- DSCR +2.2/10.0
- Rent growth +1.8/5.0
$274,900
🖨 Deal sheet 📄 Offer letter ✓ Due diligence
Listing remarks MLS
This 3-bedroom, 2-bath home offers plenty of parking, a smart modern layout, and stylish updates throughout—perfect for comfortable living or entertaining. Fully remodeled bungalow features a new HVAC system, roof, plumbing, wiring, layout, and water heater, offering true move-in-ready peace of mind. Tucked away in a secluded and private cul-de-sac, the home delivers quiet living with immediate access to I-35, restaurants, and entertainment, making commuting a breeze. Just minutes from Halperin Park, Dallas’ most transformative green space project, opening in Spring 2026.
Key facts
- 6,229 sq ft lot
- Built 1945
- Listed 112 days
Neighborhood map
What this means for you Summary
Snapshot
- This is a 3-bed/1.0-bath single-family listed at $275k.
Deal economics
- At list price, monthly cash flow is $-265 ($-3k/yr) — negative.
- To cash-flow at today's rent, offer at most $228k (17.1% below list).
- To meet the 1% rule (rent ≥ 1% of price), the offer needs to be $213k (22.4% below list).
- Recommended offer: $213k (22.4% below list) — sets the bar for 1% rule.
- Cap rate 5.1% vs local median 2.3% in Dallas — top-decile yield for the area; either an underpriced asset or a hidden risk that comps aren't pricing in. Stress-test before assuming the spread holds.
Location & tenants
- Location reads 81/100 on livability (#24 in TX, #1,380 nationally) — a professional / high-income tenant draw. Strengths: amenities A+, commute A+, housing A+; Watch: schools C-, crime F.
- Dallas ISD (urban): math 31% / reading 36% proficiency, ranked #559 of 826 in TX (top 68%) — families likely to look elsewhere, expect single-tenant / working-renter base with shorter leases; 83% free/reduced lunch — lower-income household profile, screen leases tightly.
- Market conditions: Rents soft (-2.7%/yr); 142 active listings in the ZIP; 40 comparable units currently listed for rent nearby; rentals at typical pace (median 24d on market — plan ~3-4 weeks tenant-placement turnaround); 12,577 units permitted in Dallas County in 2024 (6,829 in 5+ unit buildings).
- At $2,134/mo this rent would consume 54% of the median local household income ($47k/yr) (locally 948% of renters already pay >50% of income on rent) — very limited rent-growth headroom before tenants either downsize or default.
Forward outlook
- In year one you build about $29k of equity ($2k loan paydown + $27k appreciation (10.0% local appreciation)).
- Dallas County population projected at +35% by 2050 — long-run rental-demand tailwind backs the buy-and-hold thesis.
- By year 2, paydown + projected appreciation supports a ~$47k cash-out refi (75% LTV) — recoverable capital for the next deal without selling this one.
Negotiation context
- It's been on market 112 days — a 9% lower offer ($250k) is reasonable based on typical stale-listing flexibility.
Risks & watch-outs
- Watch-outs: built in 1945 — expect roof / HVAC / electrical / plumbing capex.
- Climate carrying-cost: major wind risk, 27% chance of damaging wind over 30y; extreme-heat days projected 7→23/yr by 2055 (HVAC capex compounding) — expect insurance premiums to compound above CPI over the hold.
Questions for the listing agent
- What do current leases actually rent for vs. the listed asking? Can we see a recent rent roll and the last 12 months of T-12 income?
- It's been on market 112 days. Have you received any prior offers? Is the seller open to a 22% concession, seller financing, or rate buy-down credit?
- Built in 1945 — when were the roof, HVAC, electrical panel, plumbing, and water heater last replaced?
- Why hasn't it sold? Are there any deal-killer items the seller is aware of (foundation, flood, title, zoning, code violations)?
- Is there a deadline driving the sale (1031 exchange, divorce, estate, relocation)? That informs how much negotiation room exists.
- Crime grade is F in this area — have there been break-ins, vandalism, or insurance claims at this property in the last 3 years? What carrier currently insures it and at what premium?
- The area grade is low — what's the realistic commute time and amenity access for the typical tenant pool here? Any planned neighborhood developments (good or bad) we should know about?
- What's the average days-on-market for RENTAL listings here right now (not sales)? A rising rental-DOM trend means longer vacancies and softer asking-rent achievability than the comps imply.
- What's the recent tenant-quality profile in this submarket — average credit score on applications, eviction rate, late-payment / NSF rate, and stable-employment percentage? A property-management company in the area should have these aggregated.
- How much new for-sale + rental construction is in the pipeline within 1–3 miles? Heavy new supply typically softens prices + rents 12–24 months out; constrained supply supports both.
Investment metrics
- 1% rule
- 0.78% ✗
- Cap rate
- 5.13%
- Cash-on-cash
- -4.14%
- DSCR
- 0.82
- GRM
- 10.7
CMA / ARV
- ARV (median comp)
- $272,155
- List price
- $274,900
- Delta
- 1.01%
- Verdict
- FAIR
- Comps
- 20 within 1.0 mi
Show comp detail 12 sales within ~0.75 mi
| Address | Dist | Beds/Ba | Sqft | Sold | Price | $/sf | Match |
|---|---|---|---|---|---|---|---|
| 1220 Alaska Ave | 0.43mi | 2/1.0 (-1) | 1,176 (-5%) | 1mo | $165,000 | $140 | 66 |
| 1207 Morrell Ave | 0.68mi | 3/2.0 | 1,258 (+2%) | 0mo | $249,999 | $199 | 62 |
| 1417 Seevers Ave | 0.72mi | 2/1.0 (-1) | 1,250 (+1%) | 4mo | $349,900 | $280 | 57 |
| 213 W Brooklyn Ave | 0.42mi | 3/1.0 | 1,088 (-12%) | 5mo | $275,000 | $253 | 56 |
| 1331 Michigan Ave | 0.55mi | 3/2.0 | 1,348 (+9%) | 1mo | $340,000 | $252 | 56 |
| 311 Leads St | 0.71mi | 3/1.0 | 1,176 (-5%) | 9mo | $250,000 | $213 | 51 |
| 1330 Alaska Ave | 0.57mi | 4/2.0 (+1) | 1,270 (+2%) | 13mo | $299,900 | $236 | 49 |
| 222 Appian Way | 0.65mi | 2/1.5 (-1) | 1,293 (+4%) | 12mo | $365,000 | $282 | 45 |
| 1211 Strickland St | 0.70mi | 3/1.0 | 1,164 (-6%) | 16mo | $121,000 | $104 | 43 |
| 419 W 10th St | 0.75mi | 3/2.0 | 1,279 (+3%) | 15mo | $890,000 | $696 | 43 |
| 1023 Fernwood | 0.56mi | 3/2.0 | 1,101 (-11%) | 14mo | $294,999 | $268 | 39 |
| 1346 Michigan Ave | 0.59mi | 2/1.0 (-1) | 1,393 (+12%) | 10mo | $299,000 | $215 | 39 |
Match score weights: distance 35% · size 25% · config 20% · recency 20%. Top-matched comps best support the ARV.
Projected returns pro-forma
10.0% appreciation · 0.0% rent growth · sell at horizon
- IRR
- 20.5%
- Equity multiple
- 2.65×
- Total profit
- $126,626
- Equity at exit
- $247,652
- IRR
- 18.0%
- Equity multiple
- 5.87×
- Total profit
- $375,112
- Equity at exit
- $534,070
Cash invested: $76,972 (down + closing). Projections, not guarantees.
Landlord ↔ Tenant lean methodology
- Overall (STATE)
- 87 Strongly Landlord-Friendly
- State Texas
- 87 Strongly Landlord-Friendly · R+5
- County
- — inherits STATE
- City
- — inherits STATE
ZIP-level market 75203
- Home prices YoY
- 31.8%
- Rents YoY
- -2.7%
- Active inventory
- 142
- Price-to-rent
- 10.7×
Monthly cashflow live
- Estimated rent
- $2,134 high interval (Pro) →
- Mortgage (P&I)
- −$1,442
- Tax from tax record
- −$395 /mo · $4,741/yr
- Insurance
- −$115
- HOA
- −$0
- Vacancy / Maint / Mgmt
- −$448
- Net cashflow
- $-265
Break-even live
UW: 25.0% down · 7.5% · 30yr · 1.5% tax · 5.0% vac · 8.0% maint · 8.0% mgmt
Financing live
Cash to close
- Down payment
- $68,725
- Closing costs
- $8,247
- Reserves months
- —
- Total cash needed
- —
Loan-product check · same deal, 3 products live
Conventional
25% down · 7.5% · 30yr
- Down + closing
- —
- Monthly P&I
- —
- Monthly cashflow
- —
- DSCR
- —
- Eligible?
- —
Personal DTI + credit; lowest rate.
DSCR
20% down · 8.5% · 30yr
- Down + closing
- —
- Monthly P&I
- —
- Monthly cashflow
- —
- DSCR
- —
- Eligible?
- —
No personal income docs; deal must DSCR.
Hard money
10% down · 12.0% · 12mo
- Down + closing
- —
- Monthly P&I
- —
- Monthly cashflow
- —
- DSCR
- —
- Eligible?
- —
Short-term bridge; refi at stabilization.
Rent comps 40 comps
| Address | Beds | Baths | Sqft | Rent | $/sqft | DOM | Units | Dist |
|---|---|---|---|---|---|---|---|---|
| 850 S Ewing Ave Dallas, TX | 1.0–2.0 | 1.0–2.5 | 1086 | $2,450 | $2.25 | 3d | 2 | 0.36mi |
| 405 S Ewing Ave Unit 309 Dallas, TX | 3.0 | 2.0 | 1343 | $2,875 | $2.14 | 24d | 1 | 0.40mi |
| 405 S Ewing Ave Unit 406 Dallas, TX | 2.0 | 2.0 | 1102 | $2,550 | $2.31 | 43d | 1 | 0.40mi |
| 1310 Michigan Ave Dallas, TX | 3.0 | 2.0 | 972 | $1,900 | $1.95 | 24d | 1 | 0.51mi |
| 1027 Morrell Ave Dallas, TX | 2.0 | 1.0 | 1140 | $1,800 | $1.58 | 44d | 1 | 0.58mi |
| 1028 Claude St Dallas, TX | 2.0 | 1.0 | 988 | $1,800 | $1.82 | 24d | 1 | 0.58mi |
| 1018 E Waco Ave Dallas, TX | 3.0 | 1.0 | 1112 | $1,395 | $1.25 | 44d | 1 | 0.65mi |
| 212 Stellariga Pl Dallas, TX | 2.0 | 2.5 | 1342 | $2,345 | $1.75 | 43d | 1 | 0.66mi |
| 239 W 9th St Unit 6-226 Dallas, TX | 2.0 | 2.0 | 1398 | $2,098 | $1.50 | 43d | 1 | 0.67mi |
| 239 W 9th St Unit 1148 Dallas, TX | 2.0 | 2.0 | 1144 | $2,002 | $1.75 | 43d | 1 | 0.67mi |
| 1210 Grant St Dallas, TX | 4.0 | 1.0 | 1370 | $2,050 | $1.50 | 7d | 1 | 0.67mi |
| 211 E Davis St Dallas, TX | 1.0–2.0 | 1.0–2.0 | 707 | $1,550 | $2.19 | 3d | 8 | 0.69mi |
| 715 Dover St Dallas, TX | 3.0 | 2.0 | 1180 | $1,995 | $1.69 | 7d | 1 | 0.71mi |
| 200 N Bishop Ave Unit 223 Dallas, TX | 2.0 | 2.0 | 1209 | $2,881 | $2.38 | 3d | 1 | 0.74mi |
| 111 W Davis St Dallas, TX | 1.0–2.0 | 1.0–2.0 | 999 | $3,011 | $3.01 | 2d | 33 | 0.77mi |
| 416 W 9th St Unit a Dallas, TX | 4.0 | 2.0 | 1279 | $2,800 | $2.19 | 43d | 1 | 0.78mi |
| 422 W 9th St Unit 1042 Dallas, TX | 2.0 | 2.0 | 1301 | $2,085 | $1.60 | 43d | 1 | 0.78mi |
| 422 W 9th St Unit 328 Dallas, TX | 2.0 | 2.0 | 1369 | $2,031 | $1.48 | 43d | 1 | 0.78mi |
| 615 Elsbeth St Dallas, TX | 1.0–2.0 | 1.0 | 760 | $1,599 | $2.10 | 6d | 2 | 0.82mi |
| 435 W 9th St Unit E, F, G Dallas, TX | 3.0 | 3.0 | 1120 | $2,800 | $2.50 | 24d | 1 | 0.83mi |
| 406 Lansing St Dallas, TX | 2.0 | 2.0 | 1014 | $2,145 | $2.12 | 6d | 1 | 0.85mi |
| 728 N Beckley Ave Dallas, TX | 3.0 | 2.0 | 1320 | $2,800 | $2.12 | 7d | 1 | 0.86mi |
| 701 Elsbeth St Dallas, TX | 2.0 | 1.0 | 850 | $1,150 | $1.35 | 43d | 1 | 0.87mi |
| 335 N Marsalis Ave Dallas, TX | 3.0 | 2.0 | 1260 | $2,100 | $1.67 | 43d | 1 | 0.87mi |
| 1715 Ramsey Ave Dallas, TX | 2.0 | 1.0 | 1092 | $1,750 | $1.60 | 24d | 1 | 0.90mi |
| 505 W 8th St Dallas, TX | 1.0–2.0 | 1.0–2.0 | 925 | $3,079 | $3.33 | 2d | 25 | 0.93mi |
| 612 Haines Ave Dallas, TX | 2.0 | 1.0 | 1200 | $2,866 | $2.39 | 43d | 1 | 0.93mi |
| 405 N Ewing Ave Dallas, TX | 3.0 | 1.0–2.0 | 941 | $2,875 | $3.05 | 2d | 48 | 0.96mi |
| 607 Woodbine Ave Dallas, TX | 2.0 | 1.0 | 782 | $1,350 | $1.73 | 7d | 1 | 0.98mi |
| 1511 Doyle Ave Dallas, TX | 3.0 | 2.0 | 1262 | $1,900 | $1.51 | 7d | 1 | 1.04mi |
| 517 S Vernon Ave Dallas, TX | 2.0 | 1.0 | 896 | $1,750 | $1.95 | 43d | 1 | 1.05mi |
| 801 N Bishop Ave Unit 1-205 Dallas, TX | 2.0 | 2.0 | 1185 | $2,099 | $1.77 | 4d | 1 | 1.05mi |
| 606 N Marsalis Ave Dallas, TX | 2.0 | 1.0 | 800 | $1,475 | $1.84 | 11d | 2 | 1.07mi |
| 609 N Lancaster Ave Dallas, TX | 1.0–2.0 | 1.0 | 725 | $1,149 | $1.58 | 1d | 2 | 1.07mi |
| 706 Cedar Hill Ave Dallas, TX | 2.0 | 1.0 | 805 | $2,100 | $2.61 | 43d | 1 | 1.09mi |
| 738 Woodlawn Ave Unit 450 Dallas, TX | 2.0 | 2.0 | 1100 | $1,900 | $1.73 | 20d | 1 | 1.09mi |
| 738 Woodlawn Ave Unit 446 Dallas, TX | 2.0 | 2.0 | 1100 | $1,495 | $1.36 | 20d | 1 | 1.09mi |
| 627 N Lancaster Ave Dallas, TX | 2.0 | 1.0–2.0 | 800 | $1,950 | $2.44 | 3d | 7 | 1.12mi |
| 624 N Lancaster Ave Dallas, TX | 2.0 | 1.0–2.0 | 800 | $2,365 | $2.96 | 7d | 4 | 1.12mi |
| 948 S Corinth Street Rd #5 Dallas, TX | 2.0 | 2.0 | 920 | $1,550 | $1.68 | 43d | 1 | 1.12mi |
Listing history 18 events
-
2026-06-18days on market $274,900 Active 112 DOM
-
2026-06-17days on market $274,900 Active 111 DOM
-
2026-06-16days on market $274,900 Active 110 DOM
-
2026-06-15days on market $274,900 Active 109 DOM
-
2026-06-13days on market $274,900 Active 107 DOM
-
2026-06-09days on market $274,900 Active 103 DOM
-
2026-06-08days on market $274,900 Active 102 DOM
-
2026-06-07days on market $274,900 Active 101 DOM
-
2026-06-04days on market $274,900 Active 98 DOM
-
2026-06-03days on market $274,900 Active 97 DOM
-
2026-06-02days on market $274,900 Active 96 DOM
-
2026-06-02days on market $274,900 Active 95 DOM
-
2026-05-31days on market $274,900 Active 94 DOM
-
2026-05-07price $274,900 596-char remark
Show marketing remark (596 chars)
This 3-bedroom, 2-bath home offers plenty of parking, a smart modern layout, and stylish updates throughout—perfect for comfortable living or entertaining. Fully remodeled bungalow features a new HVAC system, roof, plumbing, wiring, layout, and water heater, offering true move-in-ready peace of mind. Tucked away in a secluded and private cul-de-sac, the home delivers quiet living with immediate access to I-35, restaurants, and entertainment, making commuting a breeze. Just minutes from Halperin Park, Dallas’ most transformative green space project, opening in Spring 2026.
-
2026-04-03price $292,500 596-char remark
Show marketing remark (596 chars)
This 3-bedroom, 2-bath home offers plenty of parking, a smart modern layout, and stylish updates throughout—perfect for comfortable living or entertaining. Fully remodeled bungalow features a new HVAC system, roof, plumbing, wiring, layout, and water heater, offering true move-in-ready peace of mind. Tucked away in a secluded and private cul-de-sac, the home delivers quiet living with immediate access to I-35, restaurants, and entertainment, making commuting a breeze. Just minutes from Halperin Park, Dallas’ most transformative green space project, opening in Spring 2026.
-
2026-02-20$298,900 Active 596-char remark
Show marketing remark (596 chars)
This 3-bedroom, 2-bath home offers plenty of parking, a smart modern layout, and stylish updates throughout—perfect for comfortable living or entertaining. Fully remodeled bungalow features a new HVAC system, roof, plumbing, wiring, layout, and water heater, offering true move-in-ready peace of mind. Tucked away in a secluded and private cul-de-sac, the home delivers quiet living with immediate access to I-35, restaurants, and entertainment, making commuting a breeze. Just minutes from Halperin Park, Dallas’ most transformative green space project, opening in Spring 2026.
-
2023-11-07soldstatus
-
2023-11-07soldstatus
ⓘ Source: listings_history table (triggers on properties + properties_extension) + one-shot
backfill from property_details.listing_events for pre-trigger history.
Tax reassessment forecast TX · Resets to sale price
- Current annual tax
- $4,741 · $395/mo
- Projected year-2 tax
- $5,031 · $419/mo
- Expected delta
- +$289/yr (+$24/mo · 6.1%)
ⓘ Screening estimate from a state-policy table — verify with the county assessor before closing.
Climate risk First Street
- Flood 1/10 Low FEMA zone X (unshaded) · 0% chance over 30 yrs
- Wildfire 1/10 Low
- Heat 7/10 Severe 7 d/yr ≥109°F today · 23 d/yr by 30 yrs out
- Wind 6/10 Major 27% chance of damaging wind over 30 yrs
- Air quality 2/10 Low 1 unhealthy d/yr today · 2 by 30 yrs out
Nearby sold comps map
Loading sold comps map…
Walkable amenities ~0.75 mi
Loading nearby amenities…
Taxation est. · year 1
- Rental income
- $25,608
- − Mortgage interest
- −$15,399
- − Property taxes
- −$4,741
- − Insurance
- −$1,374
- − Repairs & maintenance
- −$2,049
- − Management
- −$2,049
- − Depreciation
- −$7,997
- Taxable loss
- −$8,001
- Est. tax savings @ 24.0%
- +$1,920
- After-tax cash flow
- $-1,264/yr
For passive investors: Depreciation is non-cash, so a rental often shows a tax loss while cash-flowing — sheltering income. Rental losses are passive: they offset passive income freely, and up to $25,000/yr can offset ordinary (W-2) income if you actively participate and your MAGI is under $100k (phasing out to $0 by $150k); unused losses carry forward. On sale, claimed depreciation is recaptured at up to 25%, and gains may owe capital-gains tax (a 1031 exchange can defer both). Figures are a year-1 estimate at your 24.0% rate — not tax advice; consult a CPA.
Schools (NCES district)
- District
- Dallas ISD
- NCES district ID
- 4816230
- Math proficiency
- 31% ▼ -16.00%
- Reading proficiency
- 36% ▼ -4.00%
- Median HH income
- $42,881
- Composite
- 28.41/100
- National rank
- #6763
- State rank
- #559 of 826 in TX
Livability — Dallas
- Score
- 81/100
- State rank
- #24
- US rank
- #1380
Category grades
Schools grade is shown separately in the Schools card above.
Census & demographics
- Census place
- Dallas, TX
- County
- Dallas County · 2,612,404 people
- City population
- 1,168,437
- Metro
- Dallas-Fort Worth-Arlington, TX
- Population (ZIP)
- 15,775
- Household income
- $46,989
- Rent vs Own
- Severe rent burden
- 948.0
Population outlook (Dallas County) Hauer SSP2
- Today (2025)
- 2,979,839 people
- By 2030
- 3,191,823 · +7.1%
- By 2040
- 3,619,611 · +21.5%
- By 2050
- 4,026,915 · +35.1%
- By 2075
- 4,957,073 · +66.4%
- By 2100
- 5,508,725 · +84.9%
Race, ethnicity, and origin ACS 2023
- Neighborhood character
- Diverse neighborhood (Simpson 0.55)
- Race & ethnicity
- Hispanic / Latino 59% Black 31% Two or more races 17% White 7% Native American 2%
- Hispanic origin (detail)
- Mexican 53%
- Common ancestry
- Lithuanian 1% Swiss 1%
- Foreign-born
- 29% · Canada, China, Jamaica
- Languages at home
- 47% English-only · Spanish 51% French/Haitian/Cajun 1%
Political lean MEDSL · Dallas
- 2024 margin
- Strong D (+22.2) · D 60.2% · R 38.0% · Other 1.8%
- 2008→2024 swing
- +6.9pp toward D · 2008: 15.3pp · 2024: 22.2pp
- All cycles
- 2024: D+22.2 2020: D+31.6 2016: D+26.2 2012: D+15.4 2008: D+15.3
Not yet ingested
- Civics
- —
Market trends
- HPI YoY
- ▲ 86.64%
- Current HPI
- 358.9507
- Rent YoY
- ▼ -2.72%
- Metro
- Dallas-Fort Worth-Arlington, TX
- State GDP YoY
- ▲ 3.95%
- F500 in state
- 110
Industry mix (Fortune 500 HQ in TX)
| Industry | F500 HQs | Revenue |
|---|---|---|
| Energy | 16 | $1,198B |
|
||
| Technology | 5 | $198B |
|
||
| Engineering / Construction | 4 | $72B |
|
||
| Energy Services | 3 | $60B |
|
||
| Utilities | 3 | $41B |
|
||
| Healthcare | 2 | $330B |
|
||
Price history
-8.0% since first listed5 events — show timeline
- 2026-05-07 Price Changed $274,900 NTREIS
- 2026-04-03 Price Changed $292,500 NTREIS
- 2026-02-20 Listed $298,900 NTREIS
- 2023-11-07 Sold (Public Records) — Public Records
- 2023-11-07 Sold (Public Records) — Public Records
Property tax history
+7.2%/yrLatest (2025): $4,741 · +14.1% YoY. Source: county tax records.
Cash-flow waterfall
monthlySold comps — $/sqft
last 12 mo · ≤1 miLoading sold comps…