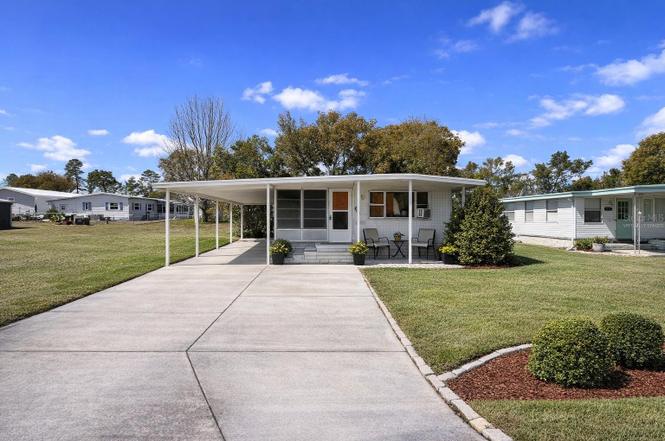
8095 Western Circle Dr · High Point, FL
Flood risk 6/10 · Moderate
- FEMA flood zone
- X (unshaded)
- Chance of flooding over 30 yrs
- 0.71%
- Est. flood insurance / yr
- $507 – $1,088
Fire risk 4/10 · Minor
- Est. fire insurance / yr
- $947 – $1,759
Heat risk 10/10 · Severe
- Hot days now (above 109°F)
- 7 days/yr
- Hot days in 30 yrs
- 24 days/yr
Wind risk 10/10 · Severe
- Chance of severe wind over 30 yrs
- 99.0%
Air-quality risk 2/10 · Minimal
- Unhealthy air days now
- 2 days/yr
- Unhealthy air days in 30 yrs
- 2 days/yr
Risk factors via First Street. Map © Google.
Why this score? — see what drove the B+ grade
The composite is a weighted blend of 9 inputs, each scored 0–100. Each bar is that input's sub-score; the figure is the points it added to the 100-point composite (weight × sub-score).
- Cash flow +30.0/30.0
- ARV discount +15.0/15.0
- 1% rule +10.0/10.0
- DSCR +10.0/10.0
- Schools +4.2/10.0
- Livability +3.2/5.0
- Rent growth +2.5/5.0
- Condition / age +2.5/5.0
- Appreciation +0.0/10.0
$89,000
🖨 Deal sheet 📄 Offer letter ✓ Due diligence
Listing remarks
One or more photo(s) has been virtually staged. Investor special or renovation opportunity in the sought-after High Point 55+ golf community! This 2-bedroom double LOT home with a private in-ground pool is ready for rehabilitation and offers outstanding potential to create value in an established, amenity-rich neighborhood. This property is ideal for buyers looking to customize their Florida retreat or investors seeking their next project. The in-ground pool provides a rare feature within the community and adds strong resale appeal once updated. High Point offers a vibrant, active lifestyle with amenities that include: Clubhouse with social events and activities, Heated community pool, Shuf
Key facts
- In-ground pool
- Shuffleboard courts
- 0.28 acre lot
Tags
Property features AI
Finance
- Other: Property is homesteaded
- Financial info: Lease restrictions apply
- HOA & community: Monthly HOA fee of $46; HOA approval required; Association amenities include clubhouse, pool, tennis courts, pickleball courts, and shuffleboard; Senior community; Pets allowed
Exterior
- Parking: Carport with 2 spaces
- Security: No specific security features listed
- Utilities: Public water; Public sewer; Electricity connected; Cable available; Sewer connected
- Home design: Residential mobile home (single wide); One story; Faces east
- Construction: Metal siding; Metal roof; Single wide mobile home
- Exterior features: Private mailbox; Asphalt road access
Interior
- Kitchen: No appliances listed
- Bedrooms: Two bedrooms
- Flooring: Other flooring
- Bathrooms: One full bathroom and one half bathroom
- Heating & cooling: No central heating; Wall/window air conditioning units
- Interior features: No notable interior features listed
- Laundry & utility: Laundry: Other (specifics not provided)
Neighborhood map
What this means for you Summary
Snapshot
- This is a 2-bed/2.0-bath manufactured listed at $89k.
Deal economics
- At list price, monthly cash flow is $620 ($7k/yr) — positive.
- The deal already cash-flows at list — no discount required.
- Meets the 1% rule at list price ($2k rent vs $89k).
- Recommended offer: $81k (9.0% below list) — sets the bar for market timing.
- Cap rate 14.6% vs local median 5.8% in High Point — top-decile yield for the area; either an underpriced asset or a hidden risk that comps aren't pricing in. Stress-test before assuming the spread holds.
Location & tenants
- Location reads 64/100 on livability (#677 in FL) — a middle-class / working-renter tenant base. Strengths: cost of living A+, housing A+, crime A; Watch: health & safety C-, schools F, amenities F.
- Hernando (suburban): math 50% / reading 50% proficiency, ranked #38 of 73 in FL (top 52%) — acceptable for families but not a draw, mixed tenant base, ~2y average lease.
- Market conditions: 691 active listings in the ZIP; 2 comparable units currently listed for rent nearby; 2,505 units permitted in Hernando County in 2024 (318 in 5+ unit buildings).
- This rent runs 32% of the median local income ($59k/yr) — at the standard rent-burdened threshold; future hikes will face affordability resistance.
Forward outlook
- Local home prices are declining (-3.0%/yr); year-one equity from $615 of loan paydown is wiped out by about $3k of value loss. Plan a longer hold.
- Hernando County population projected at +11% by 2050 — modest demand growth; plan on rents tracking national, not racing it.
- At projected returns (-3.0% appreciation + 3.0% rent growth), your $25k cash investment doubles in ~5 years — after that, you're playing with house money.
Negotiation context
- It's been on market 106 days — a 9% lower offer ($81k) is reasonable based on typical stale-listing flexibility.
- Current owner paid $17k; list at $89k implies a 424% gain — meaningful room to come down on a strong offer.
Risks & watch-outs
- Climate carrying-cost: major flood risk; severe wind risk, 99% chance of damaging wind over 30y; extreme-heat days projected 7→24/yr by 2055 (HVAC capex compounding) — expect insurance premiums to compound above CPI over the hold.
Questions for the listing agent
- It's been on market 106 days. Have you received any prior offers? Is the seller open to a 9% concession, seller financing, or rate buy-down credit?
- Built in 1972 — when were the roof, HVAC, electrical panel, plumbing, and water heater last replaced?
- What does the HOA fee cover, when was the last increase, and are there any pending special assessments or reserve-fund shortfalls?
- Why hasn't it sold? Are there any deal-killer items the seller is aware of (foundation, flood, title, zoning, code violations)?
- Is there a deadline driving the sale (1031 exchange, divorce, estate, relocation)? That informs how much negotiation room exists.
- Schools are F-rated, which usually means shorter tenancies and higher turnover. Who's the typical renter profile here, and what's been the actual vacancy rate?
- What's the average days-on-market for RENTAL listings here right now (not sales)? A rising rental-DOM trend means longer vacancies and softer asking-rent achievability than the comps imply.
- What's the recent tenant-quality profile in this submarket — average credit score on applications, eviction rate, late-payment / NSF rate, and stable-employment percentage? A property-management company in the area should have these aggregated.
- How much new for-sale + rental construction is in the pipeline within 1–3 miles? Heavy new supply typically softens prices + rents 12–24 months out; constrained supply supports both.
Investment metrics
- 1% rule
- 1.74% ✓
- Cap rate
- 14.65%
- Cash-on-cash
- 29.83%
- DSCR
- 2.33
- GRM
- 4.8
CMA / ARV
- ARV (on-the-fly)
- $117,528
- Comps found
- 9
Show comp detail 9 sales within ~0.75 mi
| Address | Dist | Beds/Ba | Sqft | Sold | Price | $/sf | Match |
|---|---|---|---|---|---|---|---|
| 7538 Fairlane Ave | 0.29mi | 2/1.0 | 720 (+2%) | 8mo | $112,000 | $156 | 73 |
| 8114 Western Circle Dr | 0.06mi | 2/1.0 | 784 (+11%) | 13mo | $130,000 | $166 | 64 |
| 7540 Western Circle Dr | 0.23mi | 2/1.0 | 768 (+8%) | 13mo | $130,000 | $169 | 60 |
| 7526 Highpoint Blvd | 0.33mi | 2/2.0 | 768 (+8%) | 14mo | $122,000 | $159 | 59 |
| 8348 Highpoint Blvd | 0.37mi | 2/2.0 | 805 (+14%) | 4mo | $143,000 | $178 | 57 |
| 8479 Highpoint Blvd | 0.61mi | 2/2.0 | 736 (+4%) | 10mo | $120,000 | $163 | 56 |
| 7252 Fairlane Ave | 0.64mi | 2/2.0 | 696 (-2%) | 14mo | $113,000 | $162 | 56 |
| 8338 Yellow Pine Ave #8338 | 0.51mi | 2/1.0 | 672 (-5%) | 17mo | $138,000 | $205 | 50 |
| 7174 Fairlane Ave | 0.69mi | 2/2.0 | 660 (-7%) | 12mo | $120,000 | $182 | 47 |
Match score weights: distance 35% · size 25% · config 20% · recency 20%. Top-matched comps best support the ARV.
Projected returns pro-forma
-3.0% appreciation · 3.0% rent growth · sell at horizon
- IRR
- 24.4%
- Equity multiple
- 2.01×
- Total profit
- $25,053
- Equity at exit
- $13,270
- IRR
- 32.2%
- Equity multiple
- 3.92×
- Total profit
- $72,696
- Equity at exit
- $7,695
Cash invested: $24,920 (down + closing). Projections, not guarantees.
Landlord ↔ Tenant lean methodology
- Overall (STATE)
- 87 Strongly Landlord-Friendly
- State Florida
- 87 Strongly Landlord-Friendly · R+3
- County
- — inherits STATE
- City
- — inherits STATE
ZIP-level market 34613
- Home prices YoY
- -17.2%
- Active inventory
- 691
- Price-to-rent
- 4.8×
Monthly cashflow live
- Estimated rent
- $1,551 medium interval (Pro) →
- Mortgage (P&I)
- −$467
- Tax from tax record
- −$56 /mo · $676/yr
- Insurance
- −$37
- HOA
- −$46
- Vacancy / Maint / Mgmt
- −$326
- Net cashflow
- $620
Break-even live
UW: 25.0% down · 7.5% · 30yr · 1.5% tax · 5.0% vac · 8.0% maint · 8.0% mgmt
Financing live
Cash to close
- Down payment
- $22,250
- Closing costs
- $2,670
- Reserves months
- —
- Total cash needed
- —
Loan-product check · same deal, 3 products live
Conventional
25% down · 7.5% · 30yr
- Down + closing
- —
- Monthly P&I
- —
- Monthly cashflow
- —
- DSCR
- —
- Eligible?
- —
Personal DTI + credit; lowest rate.
DSCR
20% down · 8.5% · 30yr
- Down + closing
- —
- Monthly P&I
- —
- Monthly cashflow
- —
- DSCR
- —
- Eligible?
- —
No personal income docs; deal must DSCR.
Hard money
10% down · 12.0% · 12mo
- Down + closing
- —
- Monthly P&I
- —
- Monthly cashflow
- —
- DSCR
- —
- Eligible?
- —
Short-term bridge; refi at stabilization.
Rent comps 2 comps
| Address | Beds | Baths | Sqft | Rent | $/sqft | DOM | Units | Dist |
|---|---|---|---|---|---|---|---|---|
| 7513 Highpoint Blvd Brooksville, FL | 2.0 | 1.0 | 672 | $1,150 | $1.71 | 24d | 1 | 0.32mi |
| 7402 Eastern Circle Dr Brooksville, FL | 2.0 | 1.0 | 720 | $1,200 | $1.67 | 24d | 1 | 1.00mi |
HOA detail
- Monthly dues
- $46 · $552/yr
- Likely covers
- pool
Listing history 20 events
-
2026-06-18days on market $89,000 Active 106 DOM
-
2026-06-17days on market $89,000 Active 105 DOM
-
2026-06-16days on market $89,000 Active 104 DOM
-
2026-06-15days on market $89,000 Active 103 DOM
-
2026-06-13days on market $89,000 Active 101 DOM
-
2026-06-13days on market $89,000 Active 100 DOM
-
2026-06-09days on market $89,000 Active 97 DOM
-
2026-06-08days on market $89,000 Active 96 DOM
-
2026-06-07days on market $89,000 Active 95 DOM
-
2026-06-04days on market $89,000 Active 92 DOM
-
2026-06-03days on market $89,000 Active 91 DOM
-
2026-06-02days on market $89,000 Active 90 DOM
-
2026-06-01days on market $89,000 Active 89 DOM
-
2026-05-31days on market $89,000 Active 88 DOM
-
2026-05-19price $89,000
-
2026-04-20price $98,000
-
2026-03-04$110,000 Active
-
1986-04-01soldstatus $17,000
-
1985-05-01soldstatus $7,000
-
1983-03-01soldstatus $13,500
ⓘ Source: listings_history table (triggers on properties + properties_extension) + one-shot
backfill from property_details.listing_events for pre-trigger history.
Tax reassessment forecast FL · Resets to sale price
- Current annual tax
- $676 · $56/mo
- Projected year-2 tax
- $739 · $62/mo
- Expected delta
- +$63/yr (+$5/mo · 9.3%)
ⓘ Screening estimate from a state-policy table — verify with the county assessor before closing.
Climate risk First Street
- Flood 6/10 Major FEMA zone X (unshaded) · 71% chance over 30 yrs
- Wildfire 4/10 Moderate
- Heat 10/10 Extreme 7 d/yr ≥109°F today · 24 d/yr by 30 yrs out
- Wind 10/10 Extreme 99% chance of damaging wind over 30 yrs
- Air quality 2/10 Low 2 unhealthy d/yr today · 2 by 30 yrs out
Nearby sold comps map
Loading sold comps map…
Walkable amenities ~0.75 mi
Loading nearby amenities…
Taxation est. · year 1
- Rental income
- $18,617
- − Mortgage interest
- −$4,985
- − Property taxes
- −$676
- − Insurance
- −$445
- − Repairs & maintenance
- −$1,489
- − Management
- −$1,489
- − HOA
- −$552
- − Depreciation
- −$2,589
- Taxable income
- $6,391
- Est. tax owed @ 24.0%
- −$1,534
- After-tax cash flow
- $5,900/yr
For passive investors: Depreciation is non-cash, so a rental often shows a tax loss while cash-flowing — sheltering income. Rental losses are passive: they offset passive income freely, and up to $25,000/yr can offset ordinary (W-2) income if you actively participate and your MAGI is under $100k (phasing out to $0 by $150k); unused losses carry forward. On sale, claimed depreciation is recaptured at up to 25%, and gains may owe capital-gains tax (a 1031 exchange can defer both). Figures are a year-1 estimate at your 24.0% rate — not tax advice; consult a CPA.
Schools (NCES district)
- District
- Hernando
- NCES district ID
- 1200810
- Math proficiency
- 50% ▼ -8.00%
- Reading proficiency
- 50% ▼ -4.00%
- Median HH income
- $41,985
- Composite
- 42.03/100
- National rank
- #3329
- State rank
- #38 of 73 in FL
Livability — High Point
- Score
- 64/100
- State rank
- #677
- US rank
- #14099
Category grades
Schools grade is shown separately in the Schools card above.
Census & demographics
- Census place
- High Point, FL
- County
- Hernando County · 169,677 people
- Metro
- Tampa-St. Petersburg-Clearwater, FL
- Population (ZIP)
- 19,337
- Household income
- $58,596
- Rent vs Own
- Severe rent burden
- 307.0
Population outlook (Hernando County) Hauer SSP2
- Today (2025)
- 189,218 people
- By 2030
- 194,367 · +2.7%
- By 2040
- 203,398 · +7.5%
- By 2050
- 209,589 · +10.8%
- By 2075
- 218,452 · +15.4%
- By 2100
- 205,923 · +8.8%
Race, ethnicity, and origin ACS 2023
- Neighborhood character
- Predominantly White (88%)
- Race & ethnicity
- White 88% Hispanic / Latino 6% Two or more races 4% Black 2% Asian 1%
- Hispanic origin (detail)
- Mexican 1% Puerto Rican 2% Cuban 1%
- Common ancestry
- Romanian 4% Lithuanian 3% Slovak 2%
- Foreign-born
- 8% · Canada, Vietnam
- Languages at home
- 92% English-only · Spanish 3% French/Haitian/Cajun 1% Russian/Polish/Slavic 1%
Political lean MEDSL · Hernando
- 2024 margin
- Solid R (+37.0) · D 31.1% · R 68.2%
- 2008→2024 swing
- -33.5pp toward R · 2008: -3.6pp · 2024: -37.0pp
- All cycles
- 2024: R+37.0 2020: R+30.2 2016: R+29.0 2012: R+8.5 2008: R+3.6
Not yet ingested
- Civics
- —
Market trends
- HPI YoY
- ▼ -57.51%
- Current HPI
- 276.2229
- Rent YoY
- —
- Metro
- Tampa-St. Petersburg-Clearwater, FL
- State GDP YoY
- ▲ 3.28%
- F500 in state
- 36
Industry mix (Fortune 500 HQ in FL)
| Industry | F500 HQs | Revenue |
|---|---|---|
| Industrial Technology | 2 | $29B |
|
||
| Insurance | 2 | $17B |
|
||
| Retail | 1 | $60B |
|
||
| Technology Distribution | 1 | $58B |
|
||
| Homebuilding | 1 | $35B |
|
||
| Technology Manufacturing | 1 | $35B |
|
||
Price history
+559.3% since first listed6 events — show timeline
- 2026-05-19 Price Changed $89,000 Stellar MLS as Distributed by MLS Grid
- 2026-04-20 Price Changed $98,000 Stellar MLS as Distributed by MLS Grid
- 2026-03-04 Listed $110,000 Stellar MLS as Distributed by MLS Grid
- 1986-04-01 Sold (Public Records) $17,000 Public Records
- 1985-05-01 Sold (Public Records) $7,000 Public Records
- 1983-03-01 Sold (Public Records) $13,500 Public Records
Property tax history
+13.1%/yrLatest (2025): $676 · +0.7% YoY. Source: county tax records.
Cash-flow waterfall
monthlySold comps — $/sqft
last 12 mo · ≤1 miLoading sold comps…