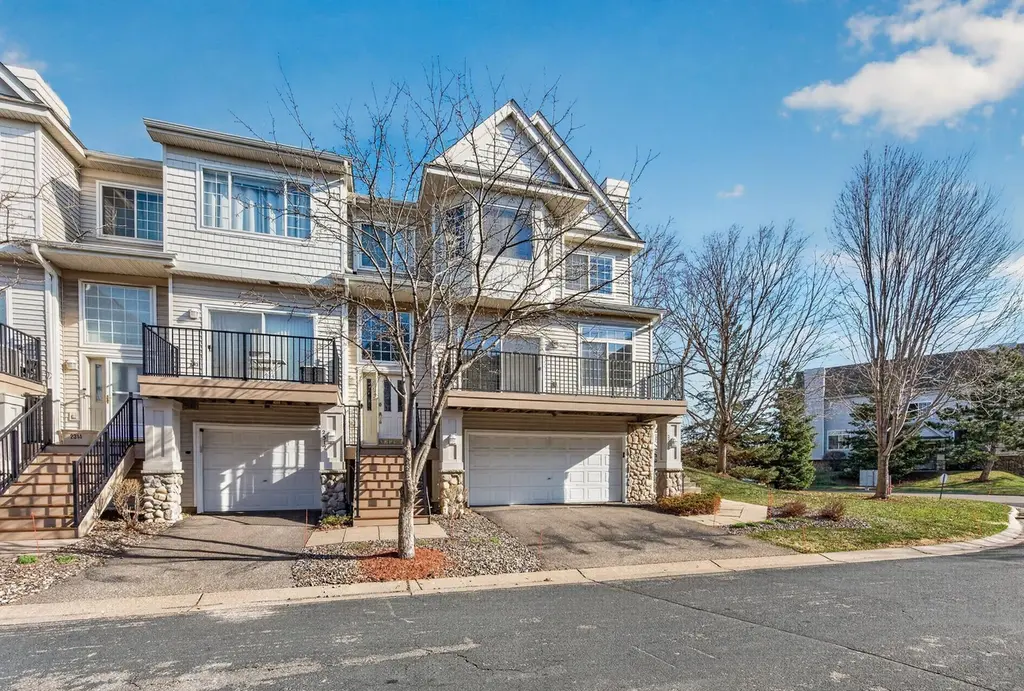
2310 Eagle Trace Ln · Woodbury, MN
Flood risk No data
- FEMA flood zone
- —
- Chance of flooding over 30 yrs
- —
- Est. flood insurance / yr
- —
Fire risk No data
- Est. fire insurance / yr
- —
Heat risk No data
- Hot days now (above threshold)
- —
- Hot days in 30 yrs
- —
Wind risk No data
- Chance of severe wind over 30 yrs
- —
Air-quality risk No data
- Unhealthy air days now
- —
- Unhealthy air days in 30 yrs
- —
Risk factors via First Street. Map © Google.
Why this score? — see what drove the D grade
The composite is a weighted blend of 9 inputs, each scored 0–100. Each bar is that input's sub-score; the figure is the points it added to the 100-point composite (weight × sub-score).
- ARV discount +10.7/15.0
- Cash flow +8.7/30.0
- Schools +5.2/10.0
- Livability +4.5/5.0
- 1% rule +4.0/10.0
- Rent growth +3.2/5.0
- Condition / age +2.5/5.0
- DSCR +2.4/10.0
- Appreciation +0.0/10.0
$275,000
🖨 Deal sheet (PDF) 📄 Offer letter ✓ Due diligence
Listing remarks MLS
Desirable end unit in great Eagle Trace neighborhood. 2 car garage. Large primary bedroom with large walk-in closet. New Central Air just installed. Most of the wall paper has been removed and replaced with freshpaint. Development adjacent to Eagle Valley Golf Course. Large deck off dinette. Brand new carpet in the living and dining room, steps and landing areas. New neutral carpet and walls. Cozy gas fireplace in living room. Large deck. Large corner tub. Easy access to shopping, parks, restaurants, and major roads. Flexible closing and possession
Key facts
- $372 HOA
- 2 garage spots
- Built 2002
Neighborhood map
What this means for you Summary
Snapshot
- This is a 2-bed/1.5-bath condo listed at $275k.
Deal economics
- At list price, monthly cash flow is $-229 ($-3k/yr) — negative.
- To cash-flow at today's rent, offer at most $234k (14.7% below list).
- To meet the 1% rule (rent ≥ 1% of price), the offer needs to be $247k (10.2% below list).
- Recommended offer: $234k (14.7% below list) — sets the bar for cash-flow.
- Cap rate 5.3% vs local median 3.2% in Woodbury — top-decile yield for the area; either an underpriced asset or a hidden risk that comps aren't pricing in. Stress-test before assuming the spread holds.
Location & tenants
- Location reads 89/100 on livability (#6 in MN, #153 nationally) — a professional / high-income tenant draw. Strengths: crime A+, commute A+, employment A+; Watch: cost of living F.
- South Washington County School District (suburban): math 52% / reading 61% proficiency, ranked #40 of 301 in MN (top 13%) — acceptable for families but not a draw, mixed tenant base, ~2y average lease; only 14% free/reduced lunch — higher-income household profile.
- Zoned schools: Middleton Elementary (math 64% / reading 57%, grade B-, #203 of 857 statewide, top 24%, 586 students, 19% FRL); Lake Middle School (math 54% / reading 71%, grade B+, #18 of 258 statewide, top 7%, 1,145 students, 14% FRL); Woodbury High School (math 62% / reading 71%, grade B, #21 of 471 statewide, top 5%, 1,979 students, 21% FRL) — zoned schools at 18% FRL track the district average.
- Market conditions: Rents rising (+2.9%/yr); 357 active listings in the ZIP; 3 comparable units currently listed for rent nearby; rentals leasing fast (median 0d on market — plan ~1-2 weeks tenant-placement turnaround); high-income renter base; 1,405 units permitted in Washington County in 2024 (121 in 5+ unit buildings).
Forward outlook
- Local home prices are declining (-3.0%/yr); year-one equity from $2k of loan paydown is wiped out by about $8k of value loss. Plan a longer hold.
- Washington County population projected at +16% by 2050 — long-run rental-demand tailwind backs the buy-and-hold thesis.
Negotiation context
- It's been on market 73 days — a 6% lower offer ($258k) is reasonable based on typical stale-listing flexibility.
- 4 sale attempts since 24y ago; this cycle's ask has dropped $15k (5%) from the opening price — seller is motivated, your offer sets the floor, not the list.
- Current owner paid $212k; 30% above their basis — modest negotiation headroom, anchor on the comps not their cost.
Questions for the listing agent
- What do current leases actually rent for vs. the listed asking? Can we see a recent rent roll and the last 12 months of T-12 income?
- It's been on market 73 days. Have you received any prior offers? Is the seller open to a 15% concession, seller financing, or rate buy-down credit?
- What does the HOA fee cover, when was the last increase, and are there any pending special assessments or reserve-fund shortfalls?
- Any open or pending special assessments — roof, HVAC, plumbing, elevator, façade? What's the per-unit balance and payoff schedule, and is the seller paying it off at close or rolling it to the buyer?
- Why hasn't it sold? Are there any deal-killer items the seller is aware of (foundation, flood, title, zoning, code violations)?
- Is there a deadline driving the sale (1031 exchange, divorce, estate, relocation)? That informs how much negotiation room exists.
- Schools are A-rated — typically a magnet for longer-tenancy family renters. What's the average tenant stay here, and is there a school-zone premium baked into asking?
- The area grade is low — what's the realistic commute time and amenity access for the typical tenant pool here? Any planned neighborhood developments (good or bad) we should know about?
- What's the average days-on-market for RENTAL listings here right now (not sales)? A rising rental-DOM trend means longer vacancies and softer asking-rent achievability than the comps imply.
- What's the recent tenant-quality profile in this submarket — average credit score on applications, eviction rate, late-payment / NSF rate, and stable-employment percentage? A property-management company in the area should have these aggregated.
- How much new apartment / multifamily construction is in the pipeline within 1–3 miles? Heavy new supply (>2% of stock underway) typically softens rents 12–24 months out; light construction supports rent growth.
Investment metrics
- 1% rule
- 0.90% ✗
- Cap rate
- 5.29%
- Cash-on-cash
- -3.58%
- DSCR
- 0.84
- GRM
- 9.3
CMA / ARV
- ARV (median comp)
- $295,908
- List price
- $275,000
- Delta
- -7.07%
- Verdict
- FAIR
- Comps
- 3 within 2.0 mi
Projected returns pro-forma
-3.0% appreciation · 2.91% rent growth · sell at horizon
- IRR
- -22.3%
- Equity multiple
- 0.23×
- Total profit
- $-59,190
- Equity at exit
- $41,003
- IRR
- -16.4%
- Equity multiple
- 0.09×
- Total profit
- $-70,426
- Equity at exit
- $23,777
Cash invested: $77,000 (down + closing). Projections, not guarantees.
Landlord ↔ Tenant lean methodology
- Overall (STATE)
- 46 Balanced
- State Minnesota
- 46 Balanced · D+2
- County
- — inherits STATE
- City
- — inherits STATE
ZIP-level market 55129
- Home prices YoY
- -24.4%
- Rents YoY
- 2.9%
- Active inventory
- 357
- Price-to-rent
- 9.3×
Monthly cashflow live
- Estimated rent
- $2,469 medium interval (Pro) →
- Mortgage (P&I)
- −$1,442
- Tax from tax record
- −$251 /mo · $3,016/yr
- Insurance
- −$115
- HOA
- −$372
- Vacancy / Maint / Mgmt
- −$519
- Net cashflow
- $-229
Break-even live
Sensitivity live
| Price | -10% $-74 | -5% $-152 | +0% $-229 | +5% $-307 | +10% $-385 |
|---|---|---|---|---|---|
| Rent | -10% $-425 | -5% $-327 | +0% $-229 | +5% $-132 | +10% $-34 |
| Rate | -1.0pp $-91 | -0.5pp $-160 | base $-229 | +0.5pp $-301 | +1.0pp $-373 |
UW: 25.0% down · 7.5% · 30yr · 1.5% tax · 5.0% vac · 8.0% maint · 8.0% mgmt
Financing live
Cash to close
- Down payment
- $68,750
- Closing costs
- $8,250
- Reserves months
- —
- Total cash needed
- —
Loan-product check · same deal, 3 products live
Conventional
25% down · 7.5% · 30yr
- Down + closing
- —
- Monthly P&I
- —
- Monthly cashflow
- —
- DSCR
- —
- Eligible?
- —
Personal DTI + credit; lowest rate.
DSCR
20% down · 8.5% · 30yr
- Down + closing
- —
- Monthly P&I
- —
- Monthly cashflow
- —
- DSCR
- —
- Eligible?
- —
No personal income docs; deal must DSCR.
Hard money
10% down · 12.0% · 12mo
- Down + closing
- —
- Monthly P&I
- —
- Monthly cashflow
- —
- DSCR
- —
- Eligible?
- —
Short-term bridge; refi at stabilization.
Rent comps 3 comps
| Address | Beds | Baths | Sqft | Rent | $/sqft | DOM | Units | Dist |
|---|---|---|---|---|---|---|---|---|
| 10285 Grand Forest Ln Saint Paul, MN | 1.0–3.0 | 1.0–2.5 | 1287 | $2,564 | $1.99 | 0d | 30 | 0.17mi |
| 2150 Vining Dr Saint Paul, MN | 1.0–3.0 | 1.0–2.5 | 1337 | $2,425 | $1.81 | 0d | 24 | 1.36mi |
| 3316 Hazel Trl Woodbury, MN | 2.0 | 3.0 | 1622 | $2,300 | $1.42 | 12d | 1 | 1.43mi |
HOA detail condo
- Monthly dues
- $372 · $4,464/yr
- Likely covers
- gas
- Assessments
- None detected in remarks — confirm with the listing agent.
Listing history 31 events
-
2026-06-21days on market $275,000 Active 73 DOM
-
2026-06-18days on market $275,000 Active 70 DOM
-
2026-06-17days on market $275,000 Active 69 DOM
-
2026-06-16days on market $275,000 Active 68 DOM
-
2026-06-15days on market $275,000 Active 67 DOM
-
2026-06-13days on market $275,000 Active 65 DOM
-
2026-06-13days on market $275,000 Active 64 DOM
-
2026-06-09days on market $275,000 Active 61 DOM
-
2026-06-08days on market $275,000 Active 60 DOM
-
2026-06-07days on market $275,000 Active 59 DOM
-
2026-06-04days on market $275,000 Active 56 DOM
-
2026-06-03days on market $275,000 Active 55 DOM
-
2026-06-02days on market $275,000 Active 54 DOM
-
2026-06-01days on market $275,000 Active 53 DOM
-
2026-05-31days on market $275,000 Active 52 DOM
-
2026-05-15price $275,000 554-char remark
Show marketing remark (554 chars)
Desirable end unit in great Eagle Trace neighborhood. 2 car garage. Large primary bedroom with large walk-in closet. New Central Air just installed. Most of the wall paper has been removed and replaced with freshpaint. Development adjacent to Eagle Valley Golf Course. Large deck off dinette. Brand new carpet in the living and dining room, steps and landing areas. New neutral carpet and walls. Cozy gas fireplace in living room. Large deck. Large corner tub. Easy access to shopping, parks, restaurants, and major roads. Flexible closing and possession
-
2026-04-10$289,900 Active 554-char remark
Show marketing remark (554 chars)
Desirable end unit in great Eagle Trace neighborhood. 2 car garage. Large primary bedroom with large walk-in closet. New Central Air just installed. Most of the wall paper has been removed and replaced with freshpaint. Development adjacent to Eagle Valley Golf Course. Large deck off dinette. Brand new carpet in the living and dining room, steps and landing areas. New neutral carpet and walls. Cozy gas fireplace in living room. Large deck. Large corner tub. Easy access to shopping, parks, restaurants, and major roads. Flexible closing and possession
-
2026-04-06historical $289,900 554-char remark
Show marketing remark (554 chars)
Desirable end unit in great Eagle Trace neighborhood. 2 car garage. Large primary bedroom with large walk-in closet. New Central Air just installed. Most of the wall paper has been removed and replaced with freshpaint. Development adjacent to Eagle Valley Golf Course. Large deck off dinette. Brand new carpet in the living and dining room, steps and landing areas. New neutral carpet and walls. Cozy gas fireplace in living room. Large deck. Large corner tub. Easy access to shopping, parks, restaurants, and major roads. Flexible closing and possession
-
2026-01-01historical
-
2025-09-16price $275,000
-
2025-08-29$285,000 Active
-
2025-08-26historical
-
2005-06-09soldstatus $212,000
-
2005-06-02historical
-
2005-06-01soldstatus $212,000
-
2005-03-23$214,900
-
2002-07-31soldstatus $197,000
-
2002-07-31soldstatus $197,000
-
2002-06-07historical
-
2002-05-30$195,000
-
2002-02-08soldstatus $183,765
ⓘ Source: listings_history table (triggers on properties + properties_extension) + one-shot
backfill from property_details.listing_events for pre-trigger history.
Tax reassessment forecast MN · Partial reset (capped growth)
- Current annual tax
- $3,016 · $251/mo
- Projected year-2 tax
- $3,048 · $254/mo
- Expected delta
- +$32/yr (+$3/mo · 1.1%)
ⓘ Screening estimate from a state-policy table — verify with the county assessor before closing.
Nearby sold comps map
Loading sold comps map…
Walkable amenities ~0.75 mi
Loading nearby amenities…
Taxation est. · year 1
- Rental income
- $29,629
- − Mortgage interest
- −$15,404
- − Property taxes
- −$3,016
- − Insurance
- −$1,375
- − Repairs & maintenance
- −$2,370
- − Management
- −$2,370
- − HOA
- −$4,464
- − Depreciation
- −$8,000
- Taxable loss
- −$7,371
- Est. tax savings @ 24.0%
- +$1,769
- After-tax cash flow
- $-985/yr
For passive investors: Depreciation is non-cash, so a rental often shows a tax loss while cash-flowing — sheltering income. Rental losses are passive: they offset passive income freely, and up to $25,000/yr can offset ordinary (W-2) income if you actively participate and your MAGI is under $100k (phasing out to $0 by $150k); unused losses carry forward. On sale, claimed depreciation is recaptured at up to 25%, and gains may owe capital-gains tax (a 1031 exchange can defer both). Figures are a year-1 estimate at your 24.0% rate — not tax advice; consult a CPA.
Schools (NCES district)
- District
- South Washington County School District
- NCES district ID
- 2733810
- Math proficiency
- 52% ▼ -13.00%
- Reading proficiency
- 61% ▼ -7.00%
- Median HH income
- $88,285
- Composite
- 51.8/100
- National rank
- #1670
- State rank
- #40 of 301 in MN
Livability — Woodbury
- Score
- 89/100
- State rank
- #6
- US rank
- #153
Category grades
Schools grade is shown separately in the Schools card above.
Census & demographics
- Census place
- Woodbury, MN
- County
- Washington County · 235,613 people
- City population
- 78,305
- Metro
- Minneapolis-St. Paul-Bloomington, MN-WI
- Population (ZIP)
- 34,120
- Household income
- $143,795
- Rent vs Own
- Severe rent burden
- 639.0
Population outlook (Washington County) Hauer SSP2
- Today (2025)
- 278,554 people
- By 2030
- 290,465 · +4.3%
- By 2040
- 310,014 · +11.3%
- By 2050
- 324,118 · +16.4%
- By 2075
- 362,697 · +30.2%
- By 2100
- 381,491 · +37.0%
Race, ethnicity, and origin ACS 2023
- Neighborhood character
- Predominantly White (66%)
- Race & ethnicity
- White 66% Asian 17% Black 8% Two or more races 5% Hispanic / Latino 3%
- Common ancestry
- Portuguese 8% Romanian 5% Lithuanian 2%
- Foreign-born
- 16% · Canada, China, Vietnam
- Languages at home
- 77% English-only · Other Indo-European 5% Other Asian/Pacific 5% Spanish 3%
Political lean MEDSL · Washington
- 2024 margin
- Lean D (+8.9) · D 53.5% · R 44.6% · Other 1.9%
- 2008→2024 swing
- +4.6pp toward D · 2008: 4.3pp · 2024: 8.9pp
- All cycles
- 2024: D+8.9 2020: D+9.2 2016: D+1.9 2012: D+0.8 2008: D+4.3
Not yet ingested
- Civics
- —
Market trends
- HPI YoY
- ▼ -69.89%
- Current HPI
- 216.0248
- Rent YoY
- ▲ 2.91%
- Metro
- Minneapolis-St. Paul-Bloomington, MN-WI
- State GDP YoY
- ▲ 2.41%
- F500 in state
- 34
Industry mix (Fortune 500 HQ in MN)
| Industry | F500 HQs | Revenue |
|---|---|---|
| Healthcare | 2 | $407B |
|
||
| Retail | 2 | $150B |
|
||
| Consumer Goods | 2 | $32B |
|
||
| Industrial Machinery | 2 | $6B |
|
||
| Agriculture | 1 | $40B |
|
||
| Healthcare / Medical Devices | 1 | $32B |
|
||
Price history
+49.6% since first listed16 events — show timeline
- 2026-05-15 Price Changed $275,000 NORTHSTARMLS as Distributed by MLS Grid
- 2026-04-10 Listed $289,900 NORTHSTARMLS as Distributed by MLS Grid
- 2026-04-06 Coming Soon $289,900 NORTHSTARMLS as Distributed by MLS Grid
- 2026-01-01 Listing Removed — NORTHSTARMLS as Distributed by MLS Grid
- 2025-09-16 Price Changed $275,000 NORTHSTARMLS as Distributed by MLS Grid
- 2025-08-29 Listed $285,000 NORTHSTARMLS as Distributed by MLS Grid
- 2025-08-26 Coming Soon — NORTHSTARMLS as Distributed by MLS Grid
- 2005-06-09 Sold (Public Records) $212,000 Public Records
- 2005-06-02 Listing Removed — NORTHSTARMLS as Distributed by MLS Grid
- 2005-06-01 Sold (MLS) $212,000 NORTHSTARMLS as Distributed by MLS Grid
- 2005-03-23 Listed $214,900 NORTHSTARMLS as Distributed by MLS Grid
- 2002-07-31 Sold (Public Records) $197,000 Public Records
- 2002-07-31 Sold (MLS) $197,000 NORTHSTARMLS as Distributed by MLS Grid
- 2002-06-07 Listing Removed — NORTHSTARMLS as Distributed by MLS Grid
- 2002-05-30 Listed $195,000 NORTHSTARMLS as Distributed by MLS Grid
- 2002-02-08 Sold (Public Records) $183,765 Public Records
Property tax history
+4.7%/yrLatest (2025): $3,016 · +0.1% YoY. Source: county tax records.
Cash-flow waterfall
monthlySold comps — $/sqft
last 12 mo · ≤1 miLoading sold comps…