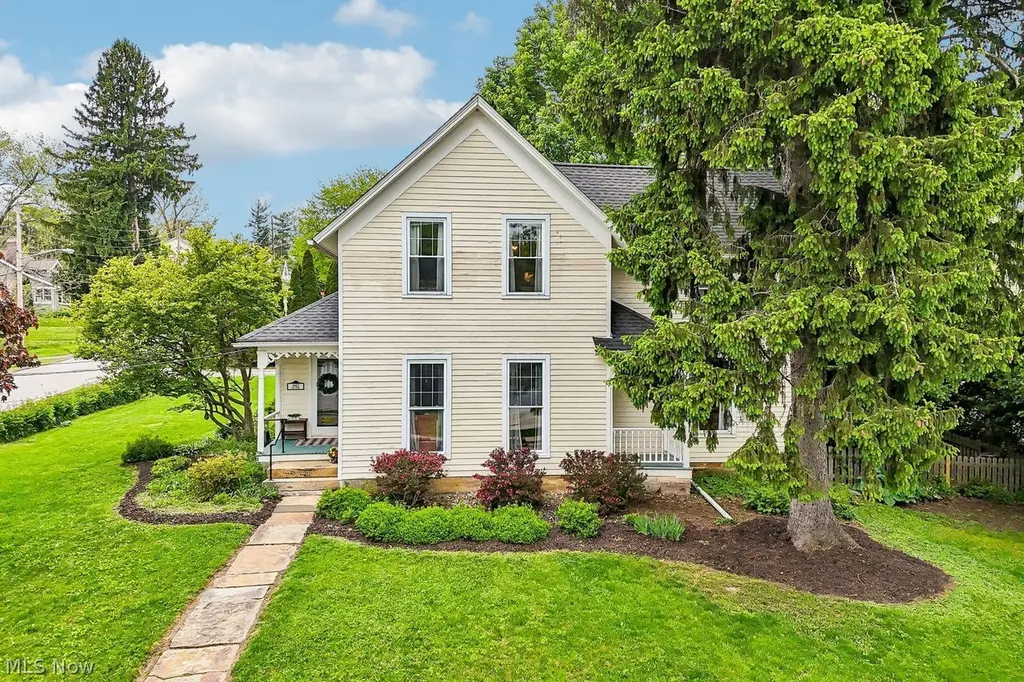
8942 Elm St · Brecksville, OH
Flood risk 1/10 · Minimal
- FEMA flood zone
- X (unshaded)
- Chance of flooding over 30 yrs
- 0.0%
- Est. flood insurance / yr
- $473 – $860
Fire risk 1/10 · Minimal
- Est. fire insurance / yr
- $713 – $1,323
Heat risk 3/10 · Minor
- Hot days now (above 97°F)
- 7 days/yr
- Hot days in 30 yrs
- 17 days/yr
Wind risk 1/10 · Minimal
- Chance of severe wind over 30 yrs
- —
Air-quality risk 2/10 · Minimal
- Unhealthy air days now
- 1 days/yr
- Unhealthy air days in 30 yrs
- 3 days/yr
Risk factors via First Street. Map © Google.
Why this score? — see what drove the D grade
The composite is a weighted blend of 9 inputs, each scored 0–100. Each bar is that input's sub-score; the figure is the points it added to the 100-point composite (weight × sub-score).
- ARV discount +12.6/15.0
- Cash flow +9.5/30.0
- Schools +7.5/10.0
- Livability +3.9/5.0
- 1% rule +3.3/10.0
- DSCR +2.7/10.0
- Rent growth +2.5/5.0
- Condition / age +2.5/5.0
- Appreciation +0.0/10.0
$390,000
🖨 Deal sheet (PDF) 📄 Offer letter ✓ Due diligence
Listing remarks MLS
4 Bedroom Century Home W/ 9ft ceilings & large open rooms. Hardwood floors throughout. First floor den or bedroom. Recently updated kitchen with new appliances and fresh paint. If your looking for a home with century home character this is it. The exterior offers a two car garage, four covered porches, rear patio and a sandstone walkway.
Key facts
- Updated finishes
- Spacious kitchen
- High ceilings
Tags
Neighborhood map
What this means for you Summary
Snapshot
- This is a 4-bed/2.0-bath single-family listed at $390k.
Deal economics
- At list price, monthly cash flow is $-274 ($-3k/yr) — negative.
- To cash-flow at today's rent, offer at most $342k (12.4% below list).
- To meet the 1% rule (rent ≥ 1% of price), the offer needs to be $323k (17.1% below list).
- Recommended offer: $323k (17.1% below list) — sets the bar for 1% rule.
- Cap rate 5.4% vs local median 2.8% in Brecksville — top-decile yield for the area; either an underpriced asset or a hidden risk that comps aren't pricing in. Stress-test before assuming the spread holds.
Location & tenants
- Location reads 77/100 on livability (#183 in OH, #2,852 nationally) — a middle-class / working-renter tenant base. Strengths: crime A+, employment A+, housing A+; Watch: amenities F, commute F, health & safety F.
- Brecksville-Broadview Heights City (suburban): math 85% / reading 85% proficiency, ranked #23 of 656 in OH (top 4%) — strong family-tenant draw, lease renewals of 3-5y typical; only 10% free/reduced lunch — higher-income household profile.
- Zoned schools: Brecksville-Broadview Heights Middle School (math 86% / reading 86%, grade A+, #13 of 654 statewide, top 2%, 796 students, 10% FRL); Brecksville-Broadview Heights High School (math 76% / reading 83%, grade A-, #35 of 781 statewide, top 6%, 1,232 students, 10% FRL) — zoned schools at 10% FRL track the district average.
- Market conditions: 98 active listings in the ZIP; 2 comparable units currently listed for rent nearby; high-income renter base; 1,441 units permitted in Cuyahoga County in 2024 (700 in 5+ unit buildings).
- This rent runs 30% of the median local income ($127k/yr) — at the standard rent-burdened threshold; future hikes will face affordability resistance.
Forward outlook
- Local home prices are declining (-3.0%/yr); year-one equity from $3k of loan paydown is wiped out by about $12k of value loss. Plan a longer hold.
- Cuyahoga County population projected to shrink 8% by 2050 — rents likely to lag national; underwrite the cash flow, not the appreciation.
Negotiation context
- Only 4 days on market — expect competitive offers; lowballing is unlikely to land.
- 10 sale attempts since 25y ago with the ask held roughly flat each time — persistent listings suggest the price (not the market) is what's stuck; bring a comps-based counter.
- Current owner paid $172k; list at $390k implies a 127% gain — meaningful room to come down on a strong offer.
Risks & watch-outs
- Watch-outs: built in 1868 — expect roof / HVAC / electrical / plumbing capex.
Questions for the listing agent
- What do current leases actually rent for vs. the listed asking? Can we see a recent rent roll and the last 12 months of T-12 income?
- Built in 1868 — when were the roof, HVAC, electrical panel, plumbing, and water heater last replaced?
- Is there a deadline driving the sale (1031 exchange, divorce, estate, relocation)? That informs how much negotiation room exists.
- Schools are A-rated — typically a magnet for longer-tenancy family renters. What's the average tenant stay here, and is there a school-zone premium baked into asking?
- The area grade is low — what's the realistic commute time and amenity access for the typical tenant pool here? Any planned neighborhood developments (good or bad) we should know about?
- What's the average days-on-market for RENTAL listings here right now (not sales)? A rising rental-DOM trend means longer vacancies and softer asking-rent achievability than the comps imply.
- What's the recent tenant-quality profile in this submarket — average credit score on applications, eviction rate, late-payment / NSF rate, and stable-employment percentage? A property-management company in the area should have these aggregated.
- How much new for-sale + rental construction is in the pipeline within 1–3 miles? Heavy new supply typically softens prices + rents 12–24 months out; constrained supply supports both.
Investment metrics
- 1% rule
- 0.83% ✗
- Cap rate
- 5.45%
- Cash-on-cash
- -3.02%
- DSCR
- 0.87
- GRM
- 10.1
CMA / ARV
- ARV (median comp)
- $439,432
- List price
- $390,000
- Delta
- -11.25%
- Verdict
- UNDERPRICED
- Comps
- 20 within 1.0 mi
Show comp detail 4 sales within ~0.75 mi
| Address | Dist | Beds/Ba | Sqft | Sold | Price | $/sf | Match |
|---|---|---|---|---|---|---|---|
| 7448 Amber Ln | 0.68mi | 4/2.5 | 2,224 (-6%) | 0mo | $361,500 | $163 | 56 |
| 8096 Long Forest Dr | 0.55mi | 3/2.5 (-1) | 2,710 (+15%) | 1mo | $560,000 | $207 | 42 |
| 7621 Winding Way | 0.64mi | 4/3.0 | 2,182 (-8%) | 15mo | $460,000 | $211 | 41 |
| 7435 Amber Ln | 0.74mi | 4/3.0 | 2,628 (+11%) | 8mo | $487,500 | $186 | 36 |
Match score weights: distance 35% · size 25% · config 20% · recency 20%. Top-matched comps best support the ARV.
Projected returns pro-forma
-3.0% appreciation · 3.0% rent growth · sell at horizon
- IRR
- -21.3%
- Equity multiple
- 0.26×
- Total profit
- $-80,543
- Equity at exit
- $58,150
- IRR
- -14.7%
- Equity multiple
- 0.16×
- Total profit
- $-92,110
- Equity at exit
- $33,720
Cash invested: $109,200 (down + closing). Projections, not guarantees.
Landlord ↔ Tenant lean methodology
- Overall (STATE)
- 73 Landlord-Friendly
- State Ohio
- 73 Landlord-Friendly · R+6
- County
- — inherits STATE
- City
- — inherits STATE
ZIP-level market 44141
- Active inventory
- 98
- Price-to-rent
- 10.1×
Monthly cashflow live
- Estimated rent
- $3,233 medium interval (Pro) →
- Mortgage (P&I)
- −$2,045
- Tax from tax record
- −$621 /mo · $7,446/yr
- Insurance
- −$162
- HOA
- −$0
- Vacancy / Maint / Mgmt
- −$679
- Net cashflow
- $-274
Break-even live
Sensitivity live
| Price | -10% $-54 | -5% $-164 | +0% $-274 | +5% $-385 | +10% $-495 |
|---|---|---|---|---|---|
| Rent | -10% $-530 | -5% $-402 | +0% $-274 | +5% $-147 | +10% $-19 |
| Rate | -1.0pp $-78 | -0.5pp $-175 | base $-274 | +0.5pp $-375 | +1.0pp $-478 |
UW: 25.0% down · 7.5% · 30yr · 1.5% tax · 5.0% vac · 8.0% maint · 8.0% mgmt
Financing live
Cash to close
- Down payment
- $97,500
- Closing costs
- $11,700
- Reserves months
- —
- Total cash needed
- —
Loan-product check · same deal, 3 products live
Conventional
25% down · 7.5% · 30yr
- Down + closing
- —
- Monthly P&I
- —
- Monthly cashflow
- —
- DSCR
- —
- Eligible?
- —
Personal DTI + credit; lowest rate.
DSCR
20% down · 8.5% · 30yr
- Down + closing
- —
- Monthly P&I
- —
- Monthly cashflow
- —
- DSCR
- —
- Eligible?
- —
No personal income docs; deal must DSCR.
Hard money
10% down · 12.0% · 12mo
- Down + closing
- —
- Monthly P&I
- —
- Monthly cashflow
- —
- DSCR
- —
- Eligible?
- —
Short-term bridge; refi at stabilization.
Rent comps 2 comps
| Address | Beds | Baths | Sqft | Rent | $/sqft | DOM | Units | Dist |
|---|---|---|---|---|---|---|---|---|
| 6803 Cranbrook Dr Brecksville, OH | 3.0 | 3.0 | 2304 | $3,500 | $1.52 | 14d | 1 | 0.47mi |
| 6960 Carriage Hill Dr Brecksville, OH | 3.0 | 2.0 | 1659 | $2,250 | $1.36 | 0d | 1 | 1.24mi |
Listing history 24 events
-
2026-05-18status Pending 1671-char remark
-
2026-05-18historical Contingent 1671-char remark
-
2026-05-14$390,000 Active 1671-char remark
-
2014-03-07soldstatus $172,000 345-char remark
Show marketing remark (345 chars)
4 Bedroom Century Home W/ 9ft ceilings & large open rooms. Hardwood floors throughout. First floor den or bedroom. Recently updated kitchen with new appliances and fresh paint. If your looking for a home with century home character this is it. The exterior offers a two car garage, four covered porches, rear patio and a sandstone walkway.
-
2013-09-25$172,000 345-char remark
Show marketing remark (345 chars)
4 Bedroom Century Home W/ 9ft ceilings & large open rooms. Hardwood floors throughout. First floor den or bedroom. Recently updated kitchen with new appliances and fresh paint. If your looking for a home with century home character this is it. The exterior offers a two car garage, four covered porches, rear patio and a sandstone walkway.
-
2013-01-10historical
-
2011-07-07$214,900
-
2007-09-14historical
-
2007-03-14$239,000
-
2006-10-13historical
-
2006-04-20$229,900
-
2005-01-03soldstatus $210,000
-
2005-01-03soldstatus $203,000
-
2004-12-06$239,500
-
2004-12-02historical
-
2004-06-02$239,500
-
2003-09-26soldstatus $210,000
-
2003-09-26soldstatus $215,000
-
2003-07-16$229,500
-
2002-07-12historical
-
2002-01-12$259,500
-
2001-06-26historical
-
2001-03-26$269,900
-
1994-06-17soldstatus $120,500
ⓘ Source: listings_history table (triggers on properties + properties_extension) + one-shot
backfill from property_details.listing_events for pre-trigger history.
Tax reassessment forecast OH · Partial reset (capped growth)
- Current annual tax
- $7,446 · $621/mo
- Projected year-2 tax
- $7,446 · $621/mo
- Expected delta
- $0/yr ($0/mo · 0.0%)
ⓘ Screening estimate from a state-policy table — verify with the county assessor before closing.
Climate risk First Street
- Flood 1/10 Low FEMA zone X (unshaded) · 0% chance over 30 yrs
- Wildfire 1/10 Low
- Heat 3/10 Moderate 7 d/yr ≥97°F today · 17 d/yr by 30 yrs out
- Wind 1/10 Low
- Air quality 2/10 Low 1 unhealthy d/yr today · 3 by 30 yrs out
Nearby sold comps map
Loading sold comps map…
Walkable amenities ~0.75 mi
Loading nearby amenities…
Taxation est. · year 1
- Rental income
- $38,792
- − Mortgage interest
- −$21,846
- − Property taxes
- −$7,446
- − Insurance
- −$1,950
- − Repairs & maintenance
- −$3,103
- − Management
- −$3,103
- − Depreciation
- −$11,345
- Taxable loss
- −$10,002
- Est. tax savings @ 24.0%
- +$2,401
- After-tax cash flow
- $-892/yr
For passive investors: Depreciation is non-cash, so a rental often shows a tax loss while cash-flowing — sheltering income. Rental losses are passive: they offset passive income freely, and up to $25,000/yr can offset ordinary (W-2) income if you actively participate and your MAGI is under $100k (phasing out to $0 by $150k); unused losses carry forward. On sale, claimed depreciation is recaptured at up to 25%, and gains may owe capital-gains tax (a 1031 exchange can defer both). Figures are a year-1 estimate at your 24.0% rate — not tax advice; consult a CPA.
Schools (NCES district)
- District
- Brecksville-Broadview Heights City
- NCES district ID
- 3904364
- Math proficiency
- 85% ▼ -7.00%
- Reading proficiency
- 85% ▼ -4.00%
- Median HH income
- $81,033
- Composite
- 74.78/100
- National rank
- #149
- State rank
- #23 of 656 in OH
Livability — Brecksville
- Score
- 77/100
- State rank
- #183
- US rank
- #2852
Category grades
Schools grade is shown separately in the Schools card above.
Census & demographics
- Census place
- Brecksville, OH
- County
- Cuyahoga · 1,045,444 people
- City population
- 13,954
- Metro
- Cleveland, OH
- Population (ZIP)
- 13,954
- Household income
- $127,347
- Rent vs Own
- Severe rent burden
- 7.6
Population outlook (Cuyahoga County) Hauer SSP2
- Today (2025)
- 1,244,621 people
- By 2030
- 1,230,093 · -1.2%
- By 2040
- 1,189,108 · -4.5%
- By 2050
- 1,145,706 · -7.9%
- By 2075
- 1,076,557 · -13.5%
- By 2100
- 978,987 · -21.3%
Race, ethnicity, and origin ACS 2023
- Neighborhood character
- Predominantly White (86%)
- Race & ethnicity
- White 86% Two or more races 7% Asian 5% Black 1%
- Common ancestry
- Romanian 17% Slovak 2% Italian 2%
- Foreign-born
- 7% · South Korea, China
- Languages at home
- 91% English-only · Russian/Polish/Slavic 3% Other Indo-European 2% Other Asian/Pacific 1%
Political lean MEDSL · Cuyahoga
- 2024 margin
- Solid D (+31.5) · D 65.4% · R 33.9%
- 2008→2024 swing
- -7.4pp toward R · 2008: 38.9pp · 2024: 31.5pp
- All cycles
- 2024: D+31.5 2020: D+34.1 2016: D+35.0 2012: D+38.7 2008: D+38.9
Not yet ingested
- Civics
- —
Market trends
- HPI YoY
- ▼ -147.81%
- Current HPI
- 196.4397
- Rent YoY
- —
- Metro
- —
- State GDP YoY
- ▲ 1.98%
- F500 in state
- 48
Industry mix (Fortune 500 HQ in OH)
| Industry | F500 HQs | Revenue |
|---|---|---|
| Insurance | 3 | $145B |
|
||
| Industrial Machinery | 3 | $49B |
|
||
| Financial Services | 3 | $24B |
|
||
| Consumer Goods | 2 | $93B |
|
||
| Aerospace / Defense | 2 | $47B |
|
||
| Utilities | 2 | $33B |
|
||
Price history
+223.7% since first listed24 events — show timeline
- 2026-05-18 Pending — MLSNOW
- 2026-05-18 Contingent — MLSNOW
- 2026-05-14 Listed $390,000 MLSNOW
- 2014-03-07 Sold (MLS) $172,000 MLSNOW
- 2013-09-25 Listed $172,000 MLSNOW
- 2013-01-10 Listing Removed — MLSNOW
- 2011-07-07 Listed $214,900 MLSNOW
- 2007-09-14 Listing Removed — MLSNOW
- 2007-03-14 Listed $239,000 MLSNOW
- 2006-10-13 Listing Removed — MLSNOW
- 2006-04-20 Listed $229,900 MLSNOW
- 2005-01-03 Sold (Public Records) $203,000 Public Records
- 2005-01-03 Sold (MLS) $210,000 MLSNOW
- 2004-12-06 Listed $239,500 MLSNOW
- 2004-12-02 Listing Removed — MLSNOW
- 2004-06-02 Listed $239,500 MLSNOW
- 2003-09-26 Sold (Public Records) $215,000 Public Records
- 2003-09-26 Sold (MLS) $210,000 MLSNOW
- 2003-07-16 Listed $229,500 MLSNOW
- 2002-07-12 Listing Removed — MLSNOW
- 2002-01-12 Listed $259,500 MLSNOW
- 2001-06-26 Listing Removed — MLSNOW
- 2001-03-26 Listed $269,900 MLSNOW
- 1994-06-17 Sold (Public Records) $120,500 Public Records
Property tax history
+4.9%/yrLatest (2025): $7,446 · +0.0% YoY. Source: county tax records.
Cash-flow waterfall
monthlySold comps — $/sqft
last 12 mo · ≤1 miLoading sold comps…