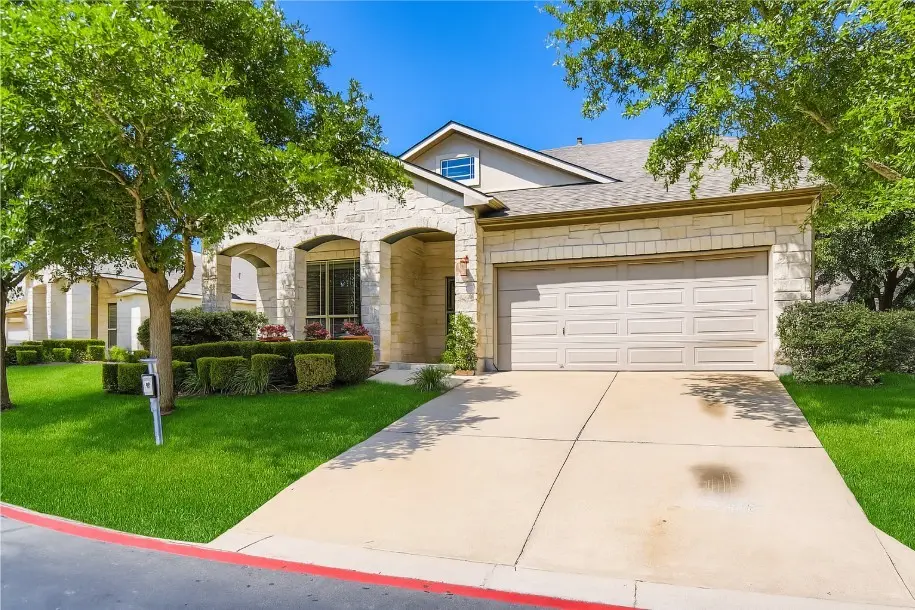
65 White Magnolia Cir #55 · Lakeway, TX
Flood risk 1/10 · Minimal
- FEMA flood zone
- X (unshaded)
- Chance of flooding over 30 yrs
- 0.0%
- Est. flood insurance / yr
- $507 – $1,088
Fire risk 4/10 · Minor
- Est. fire insurance / yr
- $1,222 – $2,270
Heat risk 8/10 · Major
- Hot days now (above 108°F)
- 7 days/yr
- Hot days in 30 yrs
- 22 days/yr
Wind risk 6/10 · Moderate
- Chance of severe wind over 30 yrs
- 73.0%
Air-quality risk 1/10 · Minimal
- Unhealthy air days now
- 0 days/yr
- Unhealthy air days in 30 yrs
- 0 days/yr
Risk factors via First Street. Map © Google.
Why this score? — see what drove the D- grade
The composite is a weighted blend of 9 inputs, each scored 0–100. Each bar is that input's sub-score; the figure is the points it added to the 100-point composite (weight × sub-score).
- ARV discount +14.0/15.0
- Cash flow +6.4/30.0
- Schools +5.5/10.0
- Rent growth +3.6/5.0
- Livability +3.6/5.0
- Condition / age +2.5/5.0
- 1% rule +2.0/10.0
- DSCR +0.7/10.0
- Appreciation +0.0/10.0
$459,900
🖨 Deal sheet 📄 Offer letter ✓ Due diligence
Listing remarks
NEW FLOORS INSTALLED on lower level: Luxury Laminant in kitchen, living, dining and lower level bedroom. More than $58,000 in recent seller improvements adds tremendous value to this charming home in the popular Courtyard at Preserve, Lakeway neighborhood. With a flexible layout and inviting spaces throughout, it’s designed to adapt easily to the way you live. The main level offers a bedroom and full bath—ideal for guests, extended family, or a private office—while upstairs you’ll find the primary suite alongside two additional bedrooms, creating a comfortable separation of space. Recent updates bring a fresh, cohesive feel to the home, including new interior paint,
Key facts
- 8,755 sq ft lot
- 2 garage spots
- Built 2005
Property features AI
Finance
- HOA & community: Part of Courtyard HOA; HOA fee $150 monthly; HOA covers common area maintenance
Exterior
- Parking: Attached garage with 2 covered spaces (2 total parking spaces)
- Utilities: Electricity available; Propane available; Water available (Municipal Utility District)
- Home design: 2-story property; Faces northeast; Slab foundation; Resale property
- Construction: Frame and stone construction; Composition roof; Built according to public records
- Exterior features: Back yard; Front yard; Landscaped yard; Medium-size trees; Wrought iron fencing; Has a view
Interior
- Kitchen: Built-in oven; Self-cleaning oven; Gas range; Dishwasher; Microwave; Disposal; Vented exhaust fan
- Bedrooms: One main-level bedroom
- Flooring: Carpet; Laminate; Tile
- Bathrooms: Three full bathrooms
- Heating & cooling: Central heating; Central air conditioning
- Interior features: Blinds on windows; Breakfast bar; Separate/formal dining room; Multiple dining areas; Fireplace in the family room
- Laundry & utility: Dedicated laundry room
Neighborhood map
What this means for you Summary
Snapshot
- This is a 4-bed/3.0-bath single-family listed at $460k.
Deal economics
- At list price, monthly cash flow is $-791 ($-9k/yr) — negative.
- To cash-flow at today's rent, offer at most $345k (24.9% below list).
- To meet the 1% rule (rent ≥ 1% of price), the offer needs to be $321k (30.2% below list).
- Recommended offer: $321k (30.2% below list) — sets the bar for 1% rule.
- Cap rate 4.2% vs local median 1.7% in Lakeway — top-decile yield for the area; either an underpriced asset or a hidden risk that comps aren't pricing in. Stress-test before assuming the spread holds.
Location & tenants
- Location reads 71/100 on livability (#330 in TX) — a middle-class / working-renter tenant base. Strengths: crime A+, employment A+, housing A+; Watch: amenities F, commute F, cost of living F.
- Lake Travis ISD (rural): math 57% / reading 61% proficiency, ranked #39 of 826 in TX (top 5%) — acceptable for families but not a draw, mixed tenant base, ~2y average lease; only 15% free/reduced lunch — higher-income household profile.
- Market conditions: Rents rising fast (+4.5%/yr); 478 active listings in the ZIP; 14 comparable units currently listed for rent nearby; rentals at typical pace (median 22d on market — plan ~3-4 weeks tenant-placement turnaround); high-income renter base; 17,121 units permitted in Travis County in 2024 (11,963 in 5+ unit buildings).
Forward outlook
- Local home prices are declining (-3.0%/yr); year-one equity from $3k of loan paydown is wiped out by about $14k of value loss. Plan a longer hold.
- Travis County population projected at +60% by 2050 — long-run rental-demand tailwind backs the buy-and-hold thesis.
Negotiation context
- It's been on market 40 days — a 3% lower offer ($446k) is reasonable based on typical stale-listing flexibility.
- 3 sale attempts with the ask held roughly flat each time — persistent listings suggest the price (not the market) is what's stuck; bring a comps-based counter.
Risks & watch-outs
- Climate carrying-cost: major wind risk, 73% chance of damaging wind over 30y; extreme-heat days projected 7→22/yr by 2055 (HVAC capex compounding) — expect insurance premiums to compound above CPI over the hold.
Questions for the listing agent
- What do current leases actually rent for vs. the listed asking? Can we see a recent rent roll and the last 12 months of T-12 income?
- It's been on market 40 days. Have you received any prior offers? Is the seller open to a 30% concession, seller financing, or rate buy-down credit?
- What does the HOA fee cover, when was the last increase, and are there any pending special assessments or reserve-fund shortfalls?
- Is there a deadline driving the sale (1031 exchange, divorce, estate, relocation)? That informs how much negotiation room exists.
- Schools are B-rated — typically a magnet for longer-tenancy family renters. What's the average tenant stay here, and is there a school-zone premium baked into asking?
- The area grade is low — what's the realistic commute time and amenity access for the typical tenant pool here? Any planned neighborhood developments (good or bad) we should know about?
- What's the average days-on-market for RENTAL listings here right now (not sales)? A rising rental-DOM trend means longer vacancies and softer asking-rent achievability than the comps imply.
- What's the recent tenant-quality profile in this submarket — average credit score on applications, eviction rate, late-payment / NSF rate, and stable-employment percentage? A property-management company in the area should have these aggregated.
- How much new for-sale + rental construction is in the pipeline within 1–3 miles? Heavy new supply typically softens prices + rents 12–24 months out; constrained supply supports both.
Investment metrics
- 1% rule
- 0.70% ✗
- Cap rate
- 4.23%
- Cash-on-cash
- -7.37%
- DSCR
- 0.67
- GRM
- 11.9
CMA / ARV
- ARV (median comp)
- $537,330
- List price
- $459,900
- Delta
- -14.41%
- Verdict
- UNDERPRICED
- Comps
- 20 within 1.0 mi
Show comp detail 12 sales within ~0.75 mi
| Address | Dist | Beds/Ba | Sqft | Sold | Price | $/sf | Match |
|---|---|---|---|---|---|---|---|
| 45 Cypress Knee Ln #86 | 0.09mi | 3/2.5 (-1) | 2,173 (+2%) | 1mo | $474,000 | $218 | 85 |
| 31 Cypress Knee Ln | 0.13mi | 3/2.5 (-1) | 2,173 (+2%) | 0mo | $475,000 | $219 | 84 |
| 36 White Magnolia Cir | 0.10mi | 3/2.5 (-1) | 2,173 (+2%) | 10mo | $450,000 | $207 | 77 |
| 310 Golf Crest Ln | 0.36mi | 3/3.0 (-1) | 2,138 (+0%) | 5mo | $400,000 | $187 | 74 |
| 207 Golf Crest Ln | 0.26mi | 3/3.0 (-1) | 2,097 (-2%) | 8mo | $499,999 | $238 | 74 |
| 1706 Lakeway Blvd | 0.43mi | 3/2.0 (-1) | 2,004 (-6%) | 1mo | $549,900 | $274 | 60 |
| 402 Golf Crest Ln | 0.40mi | 4/2.5 | 2,343 (+10%) | 7mo | $719,000 | $307 | 57 |
| 409 Heron Dr | 0.64mi | 4/2.0 | 2,291 (+7%) | 2mo | $639,000 | $279 | 52 |
| 125 Long Wood Ave | 0.74mi | 4/2.5 | 2,056 (-4%) | 7mo | $555,000 | $270 | 52 |
| 408 Hazeltine Dr | 0.61mi | 3/3.5 (-1) | 2,316 (+9%) | 3mo | $598,000 | $258 | 48 |
| 36 Green Terrace Cv | 0.29mi | 3/2.0 (-1) | 1,858 (-13%) | 12mo | $519,000 | $279 | 46 |
| 410 Rolling Green Dr | 0.60mi | 3/3.5 (-1) | 2,359 (+11%) | 8mo | $649,900 | $275 | 41 |
Match score weights: distance 35% · size 25% · config 20% · recency 20%. Top-matched comps best support the ARV.
Projected returns pro-forma
-3.0% appreciation · 4.54% rent growth · sell at horizon
- IRR
- -27.3%
- Equity multiple
- 0.07×
- Total profit
- $-119,726
- Equity at exit
- $68,573
- IRR
- -20.3%
- Equity multiple
- -0.14×
- Total profit
- $-147,182
- Equity at exit
- $39,764
Cash invested: $128,772 (down + closing). Projections, not guarantees.
Landlord ↔ Tenant lean methodology
- Overall (STATE)
- 87 Strongly Landlord-Friendly
- State Texas
- 87 Strongly Landlord-Friendly · R+5
- County
- — inherits STATE
- City
- — inherits STATE
ZIP-level market 78734
- Rents YoY
- 4.5%
- Active inventory
- 478
- Price-to-rent
- 11.9×
Monthly cashflow live
- Estimated rent
- $3,211 high interval (Pro) →
- Mortgage (P&I)
- −$2,412
- Tax est. 1.5%
- −$575 /mo · $6,898/yr
- Insurance
- −$192
- HOA
- −$150
- Vacancy / Maint / Mgmt
- −$674
- Net cashflow
- $-791
Break-even live
UW: 25.0% down · 7.5% · 30yr · 1.5% tax · 5.0% vac · 8.0% maint · 8.0% mgmt
Financing live
Cash to close
- Down payment
- $114,975
- Closing costs
- $13,797
- Reserves months
- —
- Total cash needed
- —
Loan-product check · same deal, 3 products live
Conventional
25% down · 7.5% · 30yr
- Down + closing
- —
- Monthly P&I
- —
- Monthly cashflow
- —
- DSCR
- —
- Eligible?
- —
Personal DTI + credit; lowest rate.
DSCR
20% down · 8.5% · 30yr
- Down + closing
- —
- Monthly P&I
- —
- Monthly cashflow
- —
- DSCR
- —
- Eligible?
- —
No personal income docs; deal must DSCR.
Hard money
10% down · 12.0% · 12mo
- Down + closing
- —
- Monthly P&I
- —
- Monthly cashflow
- —
- DSCR
- —
- Eligible?
- —
Short-term bridge; refi at stabilization.
Rent comps 14 comps
| Address | Beds | Baths | Sqft | Rent | $/sqft | DOM | Units | Dist |
|---|---|---|---|---|---|---|---|---|
| 64 White Magnolia Cir Austin, TX | 4.0 | 3.0 | 2133 | $2,890 | $1.35 | 24d | 1 | 0.04mi |
| 23 Juniper Berry Way #16 Austin, TX | 3.0 | 2.5 | 2173 | $2,850 | $1.31 | 14d | 1 | 0.14mi |
| 23 Juniper Berry Way #16 Austin, TX | 3.0 | 2.5 | 2173 | $2,949 | $1.36 | 24d | 1 | 0.14mi |
| 1701 Idle Hour Cv Lakeway, TX | 3.0 | 2.5 | 2577 | $3,300 | $1.28 | 24d | 1 | 0.43mi |
| 15101 Canary St Austin, TX | 3.0 | 3.0 | 2771 | $4,600 | $1.66 | 43d | 1 | 0.56mi |
| 409 S Meadowlark St Unit A Lakeway, TX | 3.0 | 2.5 | 2651 | $2,850 | $1.08 | 43d | 1 | 0.58mi |
| 15101 Mettle Dr Austin, TX | 3.0 | 2.5 | 2200 | $3,495 | $1.59 | 4d | 1 | 0.65mi |
| 204 Spellbrook Ln Lakeway, TX | 3.0 | 2.5 | 2379 | $2,695 | $1.13 | 2d | 1 | 0.90mi |
| 204 Spellbrook Ln Lakeway, TX | 3.0 | 2.5 | 2379 | $2,495 | $1.05 | 17d | 1 | 0.90mi |
| 439 Sailmaster St Unit B Lakeway, TX | 3.0 | 2.0 | 2127 | $2,500 | $1.18 | 24d | 1 | 1.22mi |
| 439 Sailmaster St Lakeway, TX | 3.0 | 2.0 | 2127 | $1,795 | $0.84 | 21d | 1 | 1.22mi |
| 2050 Lohmans Spur Rd Unit 1 Lakeway, TX | 3.0 | 2.5 | 1669 | $2,899 | $1.74 | 4d | 1 | 1.30mi |
| 6 Sunview Rd The Hills, TX | 3.0 | 3.5 | 2590 | $3,495 | $1.35 | 4d | 1 | 1.31mi |
| 295 Mooring Cir Unit A Lakeway, TX | 4.0 | 2.0 | 1550 | $2,295 | $1.48 | 4d | 1 | 1.36mi |
HOA detail
- Monthly dues
- $150 · $1,800/yr
Listing history 17 events
-
2026-06-18days on market $459,900 Active 40 DOM
-
2026-06-17days on market $459,900 Active 39 DOM
-
2026-06-16days on market $459,900 Active 38 DOM
-
2026-06-15days on market $459,900 Active 37 DOM
-
2026-06-13days on market $459,900 Active 35 DOM
-
2026-06-09days on market $459,900 Active 31 DOM
-
2026-06-08days on market $459,900 Active 30 DOM
-
2026-06-07days on market $459,900 Active 29 DOM
-
2026-06-04days on market $459,900 Active 26 DOM
-
2026-06-03days on market $459,900 Active 25 DOM
-
2026-06-02days on market $459,900 Active 24 DOM
-
2026-06-02price $459,900 Active 23 DOM
-
2026-06-01days on market $469,000 Active 23 DOM
-
2026-05-31days on market $469,000 Active 22 DOM
-
2026-05-16price $469,000 1574-char remark
-
2026-05-07$475,000 Active 1574-char remark
-
2025-09-25Active
ⓘ Source: listings_history table (triggers on properties + properties_extension) + one-shot
backfill from property_details.listing_events for pre-trigger history.
Climate risk First Street
- Flood 1/10 Low FEMA zone X (unshaded) · 0% chance over 30 yrs
- Wildfire 4/10 Moderate
- Heat 8/10 Severe 7 d/yr ≥108°F today · 22 d/yr by 30 yrs out
- Wind 6/10 Major 73% chance of damaging wind over 30 yrs
- Air quality 1/10 Low 0 unhealthy d/yr today · 0 by 30 yrs out
Nearby sold comps map
Loading sold comps map…
Walkable amenities ~0.75 mi
Loading nearby amenities…
Taxation est. · year 1
- Rental income
- $38,537
- − Mortgage interest
- −$25,762
- − Property taxes
- −$6,898
- − Insurance
- −$2,300
- − Repairs & maintenance
- −$3,083
- − Management
- −$3,083
- − HOA
- −$1,800
- − Depreciation
- −$13,379
- Taxable loss
- −$17,767
- Est. tax savings @ 24.0%
- +$4,264
- After-tax cash flow
- $-5,231/yr
For passive investors: Depreciation is non-cash, so a rental often shows a tax loss while cash-flowing — sheltering income. Rental losses are passive: they offset passive income freely, and up to $25,000/yr can offset ordinary (W-2) income if you actively participate and your MAGI is under $100k (phasing out to $0 by $150k); unused losses carry forward. On sale, claimed depreciation is recaptured at up to 25%, and gains may owe capital-gains tax (a 1031 exchange can defer both). Figures are a year-1 estimate at your 24.0% rate — not tax advice; consult a CPA.
Schools (NCES district)
- District
- Lake Travis ISD
- NCES district ID
- 4826470
- Math proficiency
- 57% ▼ -12.00%
- Reading proficiency
- 61% ▼ -9.00%
- Median HH income
- $101,194
- Composite
- 55.13/100
- National rank
- #1283
- State rank
- #39 of 826 in TX
Livability — Lakeway
- Score
- 71/100
- State rank
- #330
- US rank
- #7227
Category grades
Schools grade is shown separately in the Schools card above.
Census & demographics
- Census place
- Lakeway, TX
- County
- Travis County · 1,299,254 people
- City population
- 22,145
- Metro
- Austin-Round Rock-Georgetown, TX
- Population (ZIP)
- 22,145
- Household income
- $130,784
- Rent vs Own
- Severe rent burden
- 296.0
Population outlook (Travis County) Hauer SSP2
- Today (2025)
- 1,545,133 people
- By 2030
- 1,729,269 · +11.9%
- By 2040
- 2,097,596 · +35.8%
- By 2050
- 2,463,890 · +59.5%
- By 2075
- 3,249,374 · +110.3%
- By 2100
- 3,801,868 · +146.1%
Race, ethnicity, and origin ACS 2023
- Neighborhood character
- Predominantly White (76%)
- Race & ethnicity
- White 76% Hispanic / Latino 15% Two or more races 10% Asian 4% Black 1%
- Hispanic origin (detail)
- Mexican 13%
- Common ancestry
- Italian 6% Iranian 4% Slovak 3%
- Foreign-born
- 13% · Canada, China, Vietnam
- Languages at home
- 84% English-only · Spanish 10% Other Indo-European 2% Russian/Polish/Slavic 1%
Political lean MEDSL · Travis
- 2024 margin
- Solid D (+39.3) · D 68.8% · R 29.4% · Other 1.8%
- 2008→2024 swing
- +9.9pp toward D · 2008: 29.4pp · 2024: 39.3pp
- All cycles
- 2024: D+39.3 2020: D+45.0 2016: D+38.9 2012: D+23.9 2008: D+29.4
Not yet ingested
- Civics
- —
Market trends
- HPI YoY
- ▼ -227.08%
- Current HPI
- 216.0323
- Rent YoY
- ▲ 4.54%
- Metro
- Austin-Round Rock-Georgetown, TX
- State GDP YoY
- ▲ 3.95%
- F500 in state
- 110
Industry mix (Fortune 500 HQ in TX)
| Industry | F500 HQs | Revenue |
|---|---|---|
| Energy | 16 | $1,198B |
|
||
| Technology | 5 | $198B |
|
||
| Engineering / Construction | 4 | $72B |
|
||
| Energy Services | 3 | $60B |
|
||
| Utilities | 3 | $41B |
|
||
| Healthcare | 2 | $330B |
|
||
Price history
-3.2% since first listed5 events — show timeline
- 2026-06-01 Price Changed $459,900 Unlock MLS
- 2026-05-29 Relisted — Unlock MLS
- 2026-05-16 Price Changed $469,000 Unlock MLS
- 2026-05-07 Listed $475,000 Unlock MLS
- 2025-09-25 Listed — Unlock MLS
Cash-flow waterfall
monthlySold comps — $/sqft
last 12 mo · ≤1 miLoading sold comps…